-
氮(N)和磷(P)广泛存在于自然界中,是生物生存生长必需的营养元素。工业革命以来,人类活动已取代了自然力,成为湖泊和流域氮磷营养盐富集的重要驱动力。持续的营养物质输入会引起严重的富营养化问题,从而破坏生态系统的正常功能[1-2]。日益频繁的人类活动导致进入到环境中的生物可利用性氮、磷分别增加了10倍[3]和13倍[4]。在过去的几十年间,中国作为世界最大的农业集约化发展中国家,粮食生产中大量化学肥料投入农田,过量养分随降雨径流或壤中流流失,成为流域氮磷营养元素输入的主要来源[5-7]。然而,城市化进程带来了城市人口与城市用地增加、农业产业结构调整等变化,亦改变了流域的养分循环过程[8],导致非农业源的营养物质输入贡献占比随之增加[9]。因此,在城市化高度发达的区域,集约化农业造成的氮磷输入可能已不再是流域中营养元素的最大输入源[10]。
在大流域氮磷输移过程研究中,实地监测较为困难,采用各种数学模型进行流域内污染物迁移过程的模拟和迁移量的估算,已成为大流域/区域尺度氮磷输移研究的主流方法。常用的模型包括LOADEST模型[11]和SWAT模型[12]。上述模型能高精度地模拟点源和非点源氮磷等营养盐的排放,但此类模型对参数要求较高,在面对复杂流域问题时由于难以获得详细信息,使其应用受到限制[13]。近年来,人类活动净氮输入(net anthropogenic nitrogen input,NANI)和人类活动净磷输入(net anthropogenic phosphorus input,NAPI)模型作为估算大流域尺度氮磷输入量的可靠模型[14-16],逐渐被广泛应用。有研究者采用NANI和NAPI模型评估了长江流域人为氮磷输入强度,分析了其关键驱动因子及其时空变化特征[10,16]。这2种模型能够量化各种人类活动过程造成的氮磷输入,从而有效辨别各类输入源对流域的贡献。
珠江三角洲地区(以下简称“珠三角地区”)位于珠江流域,是我国重要的经济中心区域。该区域城市化率已经超过85%,是中国城市化率最高和人口聚集最多的城市群[17]。高度城市化导致了农业用地的压缩[18],使得该区域氮磷养分循环过程发生了重大变化,农业活动中的肥料可能已不再是氮、磷输入的最大来源[19]。因此,定量研究氮磷人为输入量及其时空变化,对珠三角地区氮磷排放的管控,以及维护流域环境和保障生态安全都具有重要意义。
本研究选择珠三角地区为研究区域,收集该区域中各种人为源的相关数据,采用NANI和NAPI模型计算2000—2019年该区域氮磷的输入强度,分析氮、磷的不同来源、区域污染特征及变化过程,以期为高度城市化区域氮磷输入及相关污染源的管控提供参考。
-
珠江三角洲地处于广东省中南部(21°32′24″-24°25′12″N,111°22′48″-115°22′48″E),位于珠江下游,是珠江水系的西江、北江和东江在入海时冲积沉淀而成的一个复合三角洲。该地区包括广州、深圳,珠海、佛山、江门、东莞、中山等市的全部,以及惠州市和肇庆市的部分区县(见图1)。珠三角区域土地面积约为5.6×10⁴ km2,占国土面积的0.58%,集聚了国内经济第一大省(广东省)53.35%的人口和79.67%的经济总量。世界银行报告显示,该地区已于2010年超越日本东京,成为世界上人口最多和面积最大的城市群[20]。
-
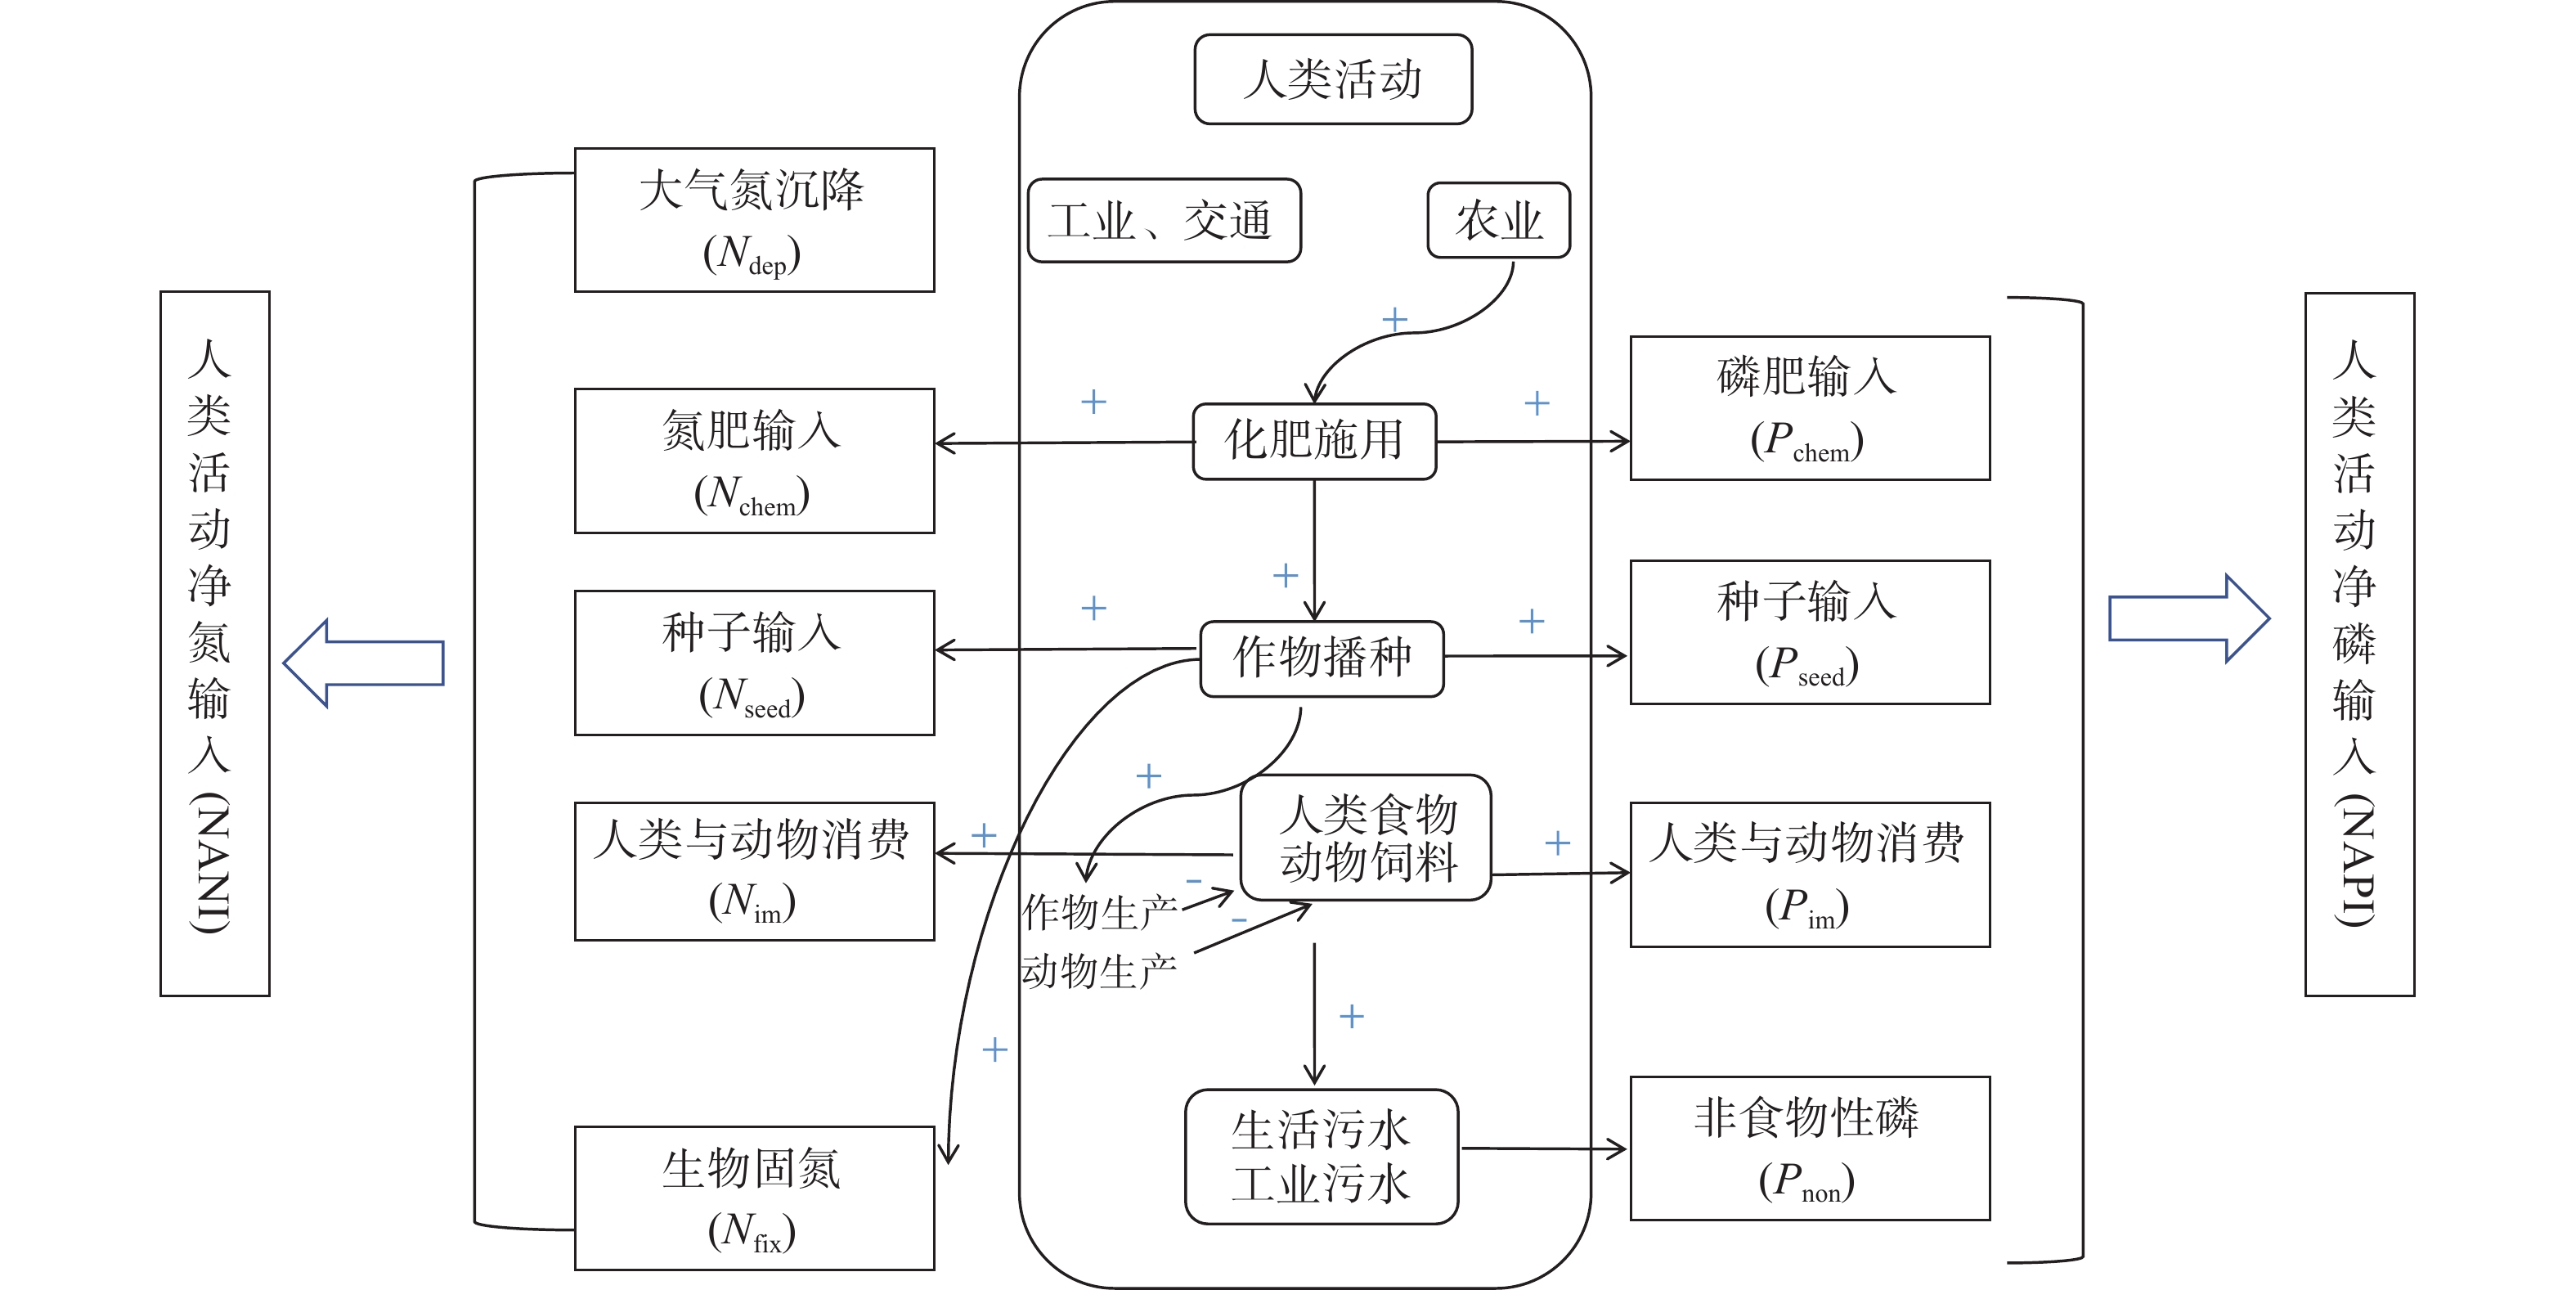
采用人类活动净氮/磷输入模型(NANI/NAPI)(见式(1)~(2))对人为氮、磷输入进行了估算。NANI和NAPI模型的估算路径如图2所示。
1)人类活动净氮输入。人类活动净氮输入(NANI)主要有5个来源:大气氮沉降、氮肥输入、种子播种输入、人类食品和动物饲料、作物固氮。NANI估算公式见式(1)。
式中:NANI为人类活动净氮输入量,kg·(km2·a)−1;
$ {N}_{dep} $ 为大气氮沉降输入量,kg·(km2·a)−1;$ {N}_{chem} $ 为氮肥输入量,kg·(km2·a)−1;$ {N}_{seed} $ 为种子中的氮输入量,kg·(km2·a)−1;$ {N}_{im} $ 代表区域人类食品和动物饲料中的净氮输入量,kg·(km2·a)−1;$ {N}_{fix} $ 为作物固氮量,kg·(km2·a)−1。大气氮沉降输入量为珠三角地区城镇和农村的面积分别乘以城镇和农村的氮沉积系数,同时扣除氮肥挥发而后重新沉积的氮。氮肥输入量为氮肥折纯量与复合肥中氮含量相加。种子中的氮输入量以每种作物种子单位面积含氮量乘以各类型作物的播种面积计算得到。人类食品和动物饲料中的净氮输入量是人类和动物的氮消耗量与动植物产品中氮含量的差值。结果为正值表示人类和动物对氮的需求超出了动植物产品的供给能力,需要从外界进口营养元素来填补亏损;结果为负值则表示氮源可对外生产。生物固氮量按作物种植面积乘以公布的固氮率计算。
2)人类活动净磷输入。NAPI的来源通常包括:磷肥施用输入、种子播种输入、人类和动物消费输入、非食物性磷输入(如用于清洁的磷基洗涤剂等)。值得注意的是,P的大气沉积是有限的,通常在NAPI计算中可忽略不计。NAPI的估算公式见式(2)。
式中:NAPI为人类活动净磷输入量,kg·(km2·a)−1;
$ {P}_{chem} $ 为磷肥输入量,kg·(km2·a)−1;$ {P}_{seed} $ 为种子中的磷输入量,kg·(km2·a)−1;$ {P}_{im} $ 代表区域人类食品和动物饲料中的净磷输入量,kg·(km2·a)−1;$ {P}_{non} $ 为非食物性磷输入量,kg·(km2·a)−1。肥料中的净磷输入量为磷肥折纯量与复合肥中的磷含量之和。由于磷肥折纯后以P2O5计,故乘以系数(0.436)转化为P的量。种子播种输入的磷、人类食品和动物饲料中的净磷输入量与上节中氮的计算相同。非食品净磷投入量按研究单位总数乘以人均非食品磷排放系数计算。
-
数据来源于2001—2020年的《广东统计年鉴》(广东省统计局,2001—2020年)、《广东农村统计年鉴》(2018—2020年),以及各市统计年鉴。NANI和NAPI各组分计算参数均从已发表的文献中获得(表1)。
-
本研究使用灰色关联度分析(grey relational analysis,GRA)对珠三角地区的NANI和NAPI与社会经济因素和农业因素之间的同步变化程度进行量化。灰色关联度分析采用DPS软件。
-
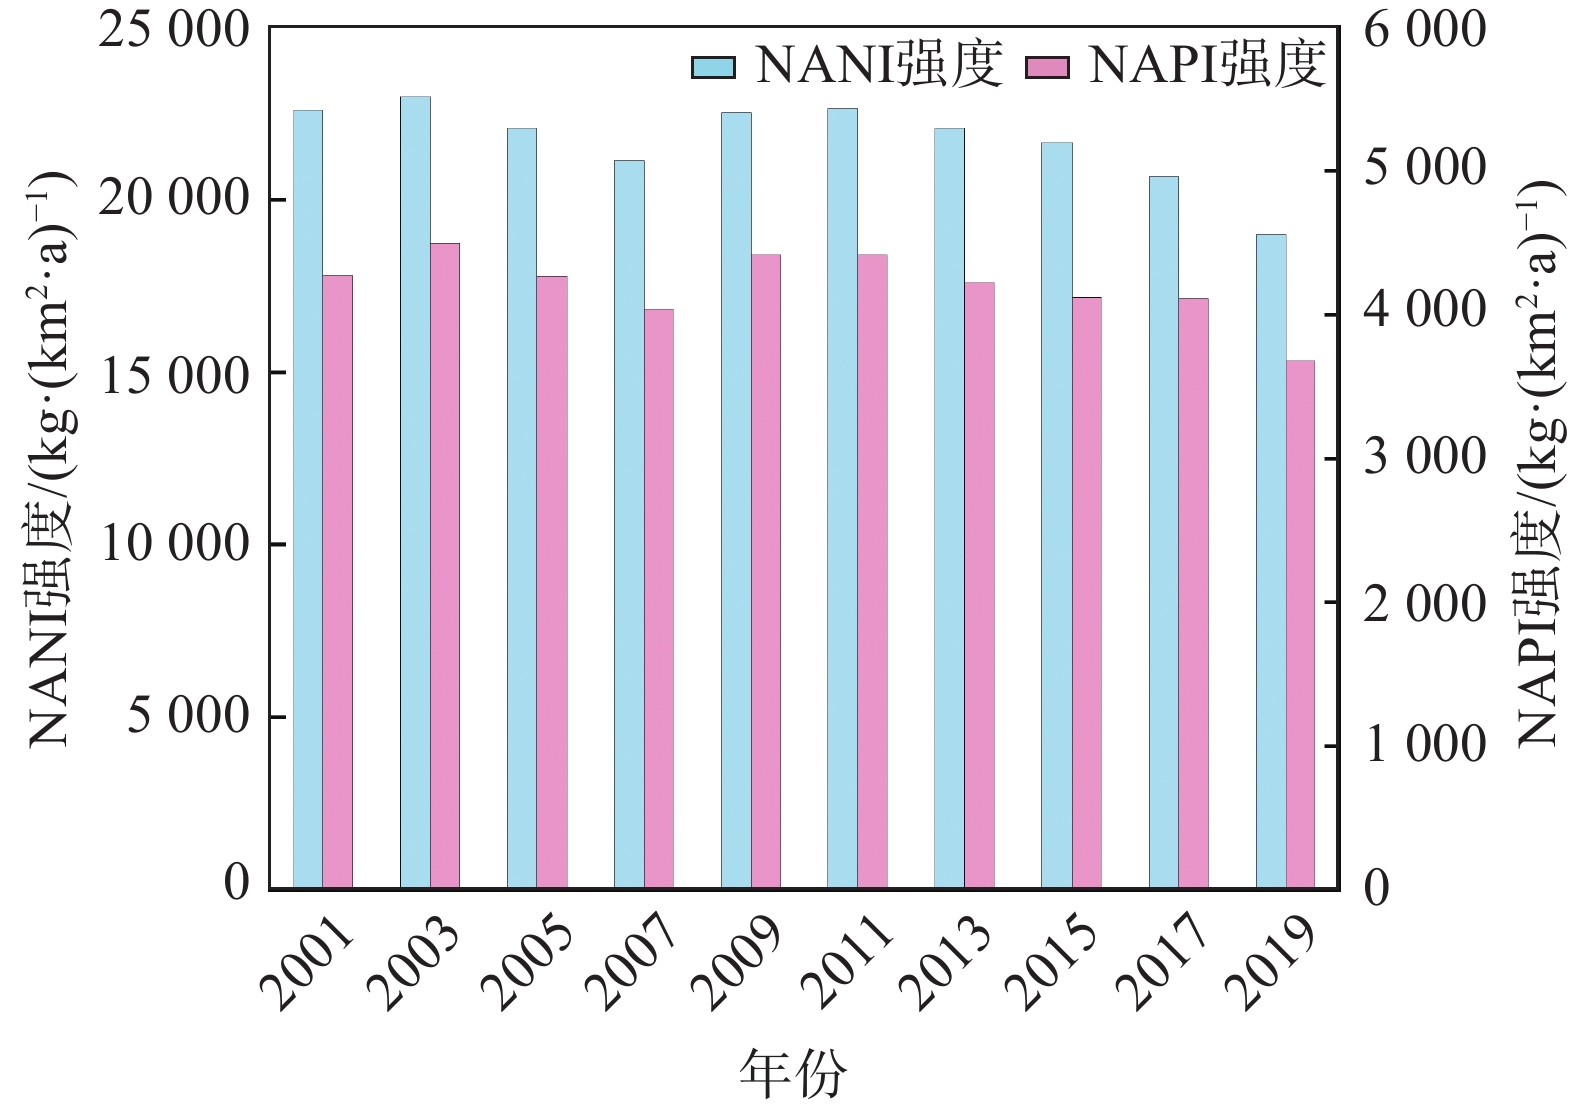
珠三角地区NANI和NAPI强度变化如图3所示。2000—2019年间,该地区的NANI和NAPI强度均呈现先下降后上升再缓慢下降的变化特点。整个地区的人类活动净氮/净磷输入强度的最高值出现在2004年,分别为23 301和4 603 kg·(km2·a)−1;在2007年之后上升并在2011年达到峰值,NANI为22 630 kg·(km2·a)−1,NAPI为4 413 kg·(km2·a)−1;然后在2019年分别降至18 985和3 678 kg·(km2·a)−1。近20 a间,NANI强度的下降幅度为18.5%,NAPI强度的下降幅度为20.1%。
珠三角地区NANI和NAPI的平均强度(分别为20 404 、4 007 kg·(km2·a)−1)远高于全国(除港澳台)和全球的平均水平[23,27-28],分别为全国平均水平的4倍和8倍。同时期,珠三角地区的NANI强度已相当于全球平均水平的17倍左右。与我国其他地区的平均水平相比,珠三角地区的强度属于较高水平,仅次于淮河流域[4,26-30]。大量的研究表明,流域中人类活动净氮/净磷的输入与河流的氮磷输出之间呈显著相关[31]。这表明较高的NANI/NAPI强度可能会导致流域面临严重的氮磷污染。目前,珠三角地区的湖泊和水库已面临较为严重的富营养化问题[32-33],过多的人为氮磷输入会导致环境恶化。因此,调查NANI和NAPI在珠三角地区的主要输入路径对控制该流域富营养化问题有重要意义。
-
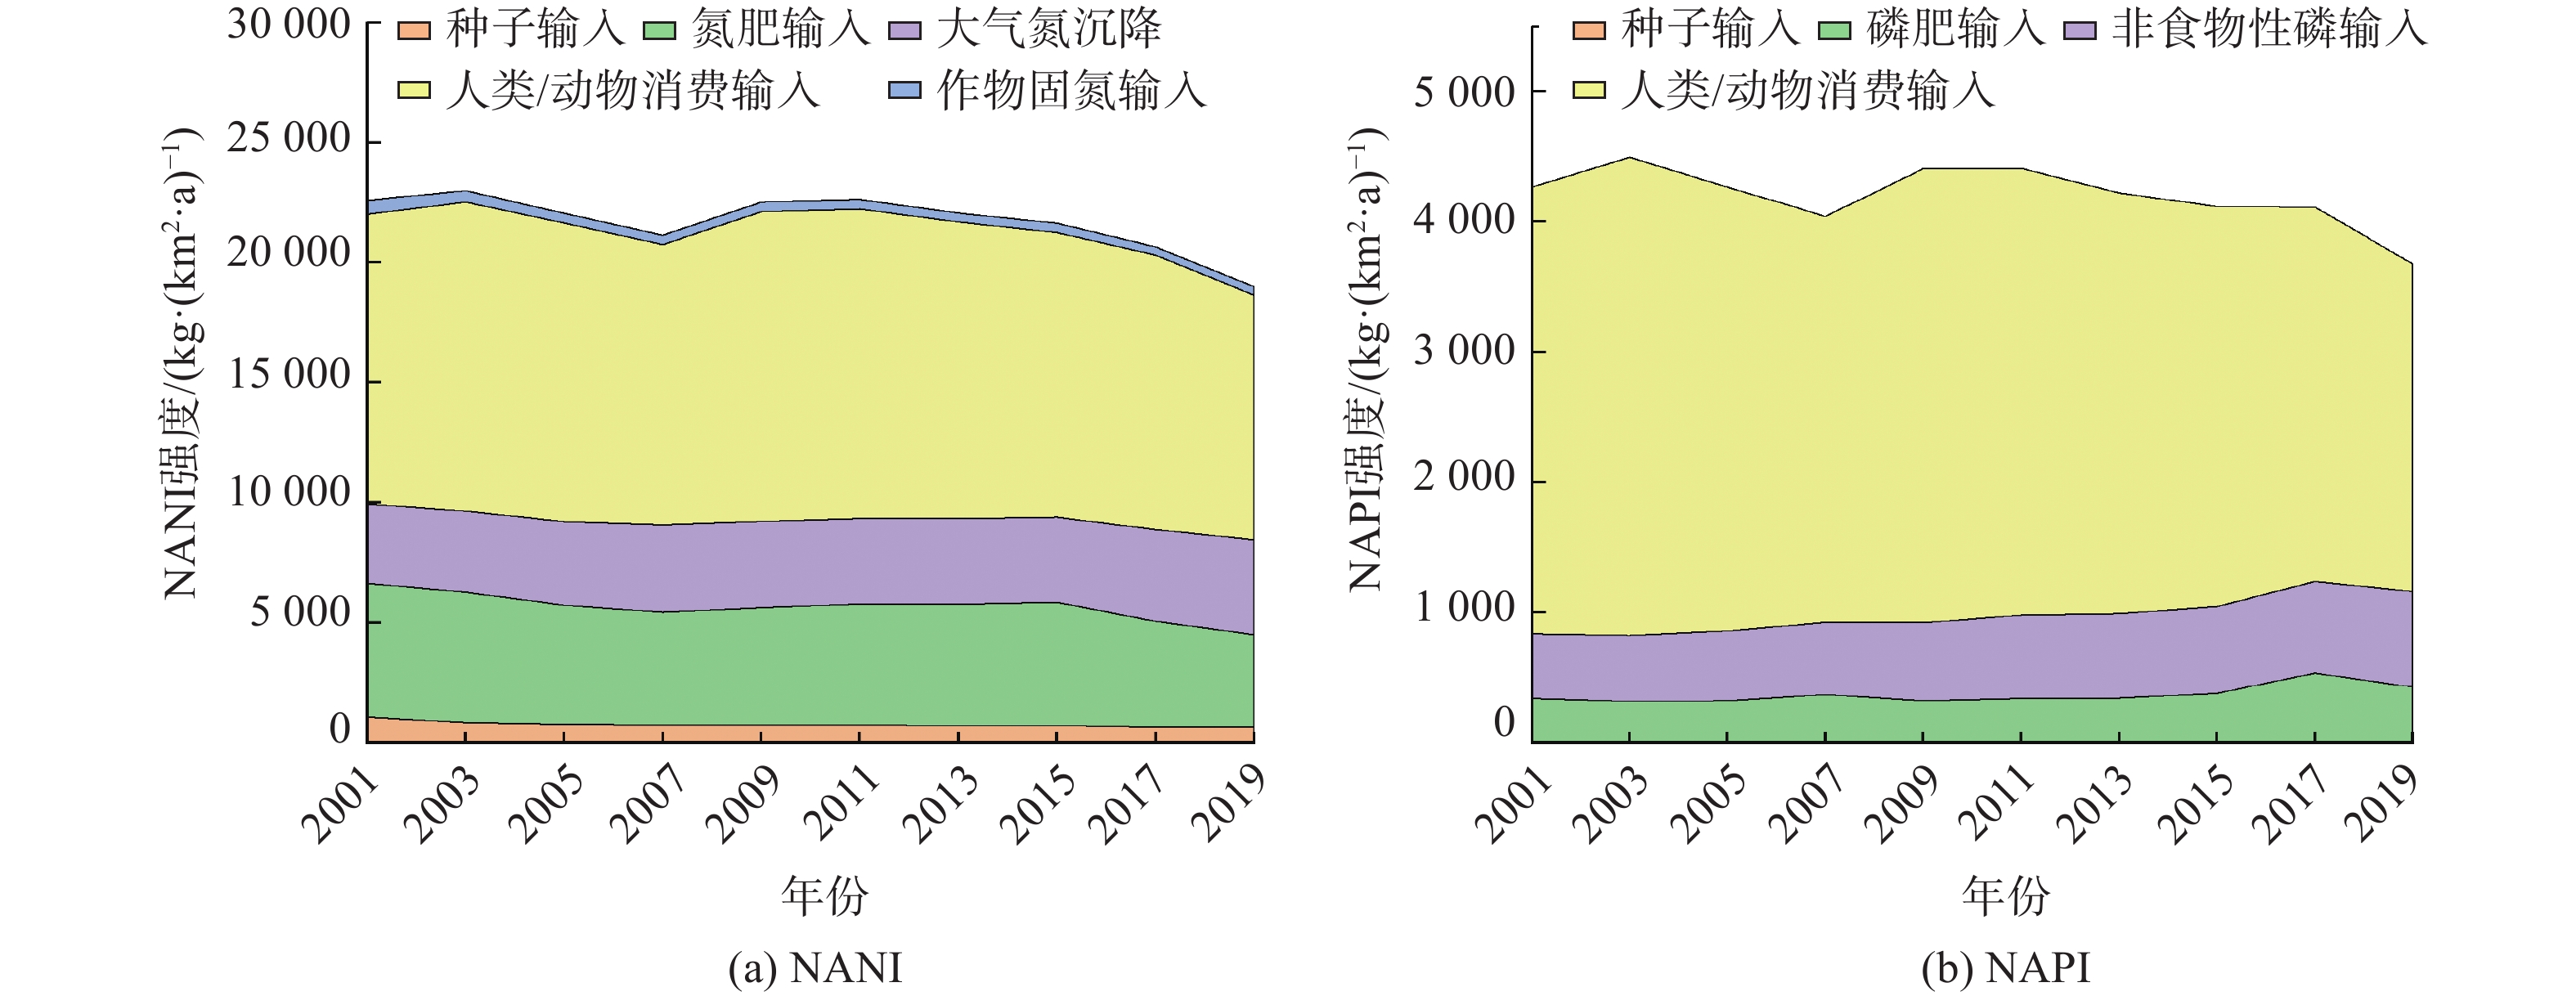
整个研究时期内,各项输入组分的变化情况如图4所示。氮和磷的输入源有明显差异。虽然NANI和NAPI的最大输入源都是人类食品和动物饲料消费,但其贡献量呈现逐年缓慢下降的趋势。肥料施用量随时间略有减少,多年平均值分别为氮、磷输入总量的22.5%和8.8%。值得注意的是,大气氮沉降量和非食品性磷在该时期内呈现一定的上升趋势。非食品性磷占比从11.7%升高至19.9%,大气氮沉降量从14.6%升高至20.8%。大气氮沉降量的增长主要是由于该地区工业、农业等产业的不断发展造成大量含氮气体的排放。通过控制人为燃料的燃烧可有效减少大气氮排放,如限制工业企业燃料燃烧、禁止农村秸秆焚烧等。
-
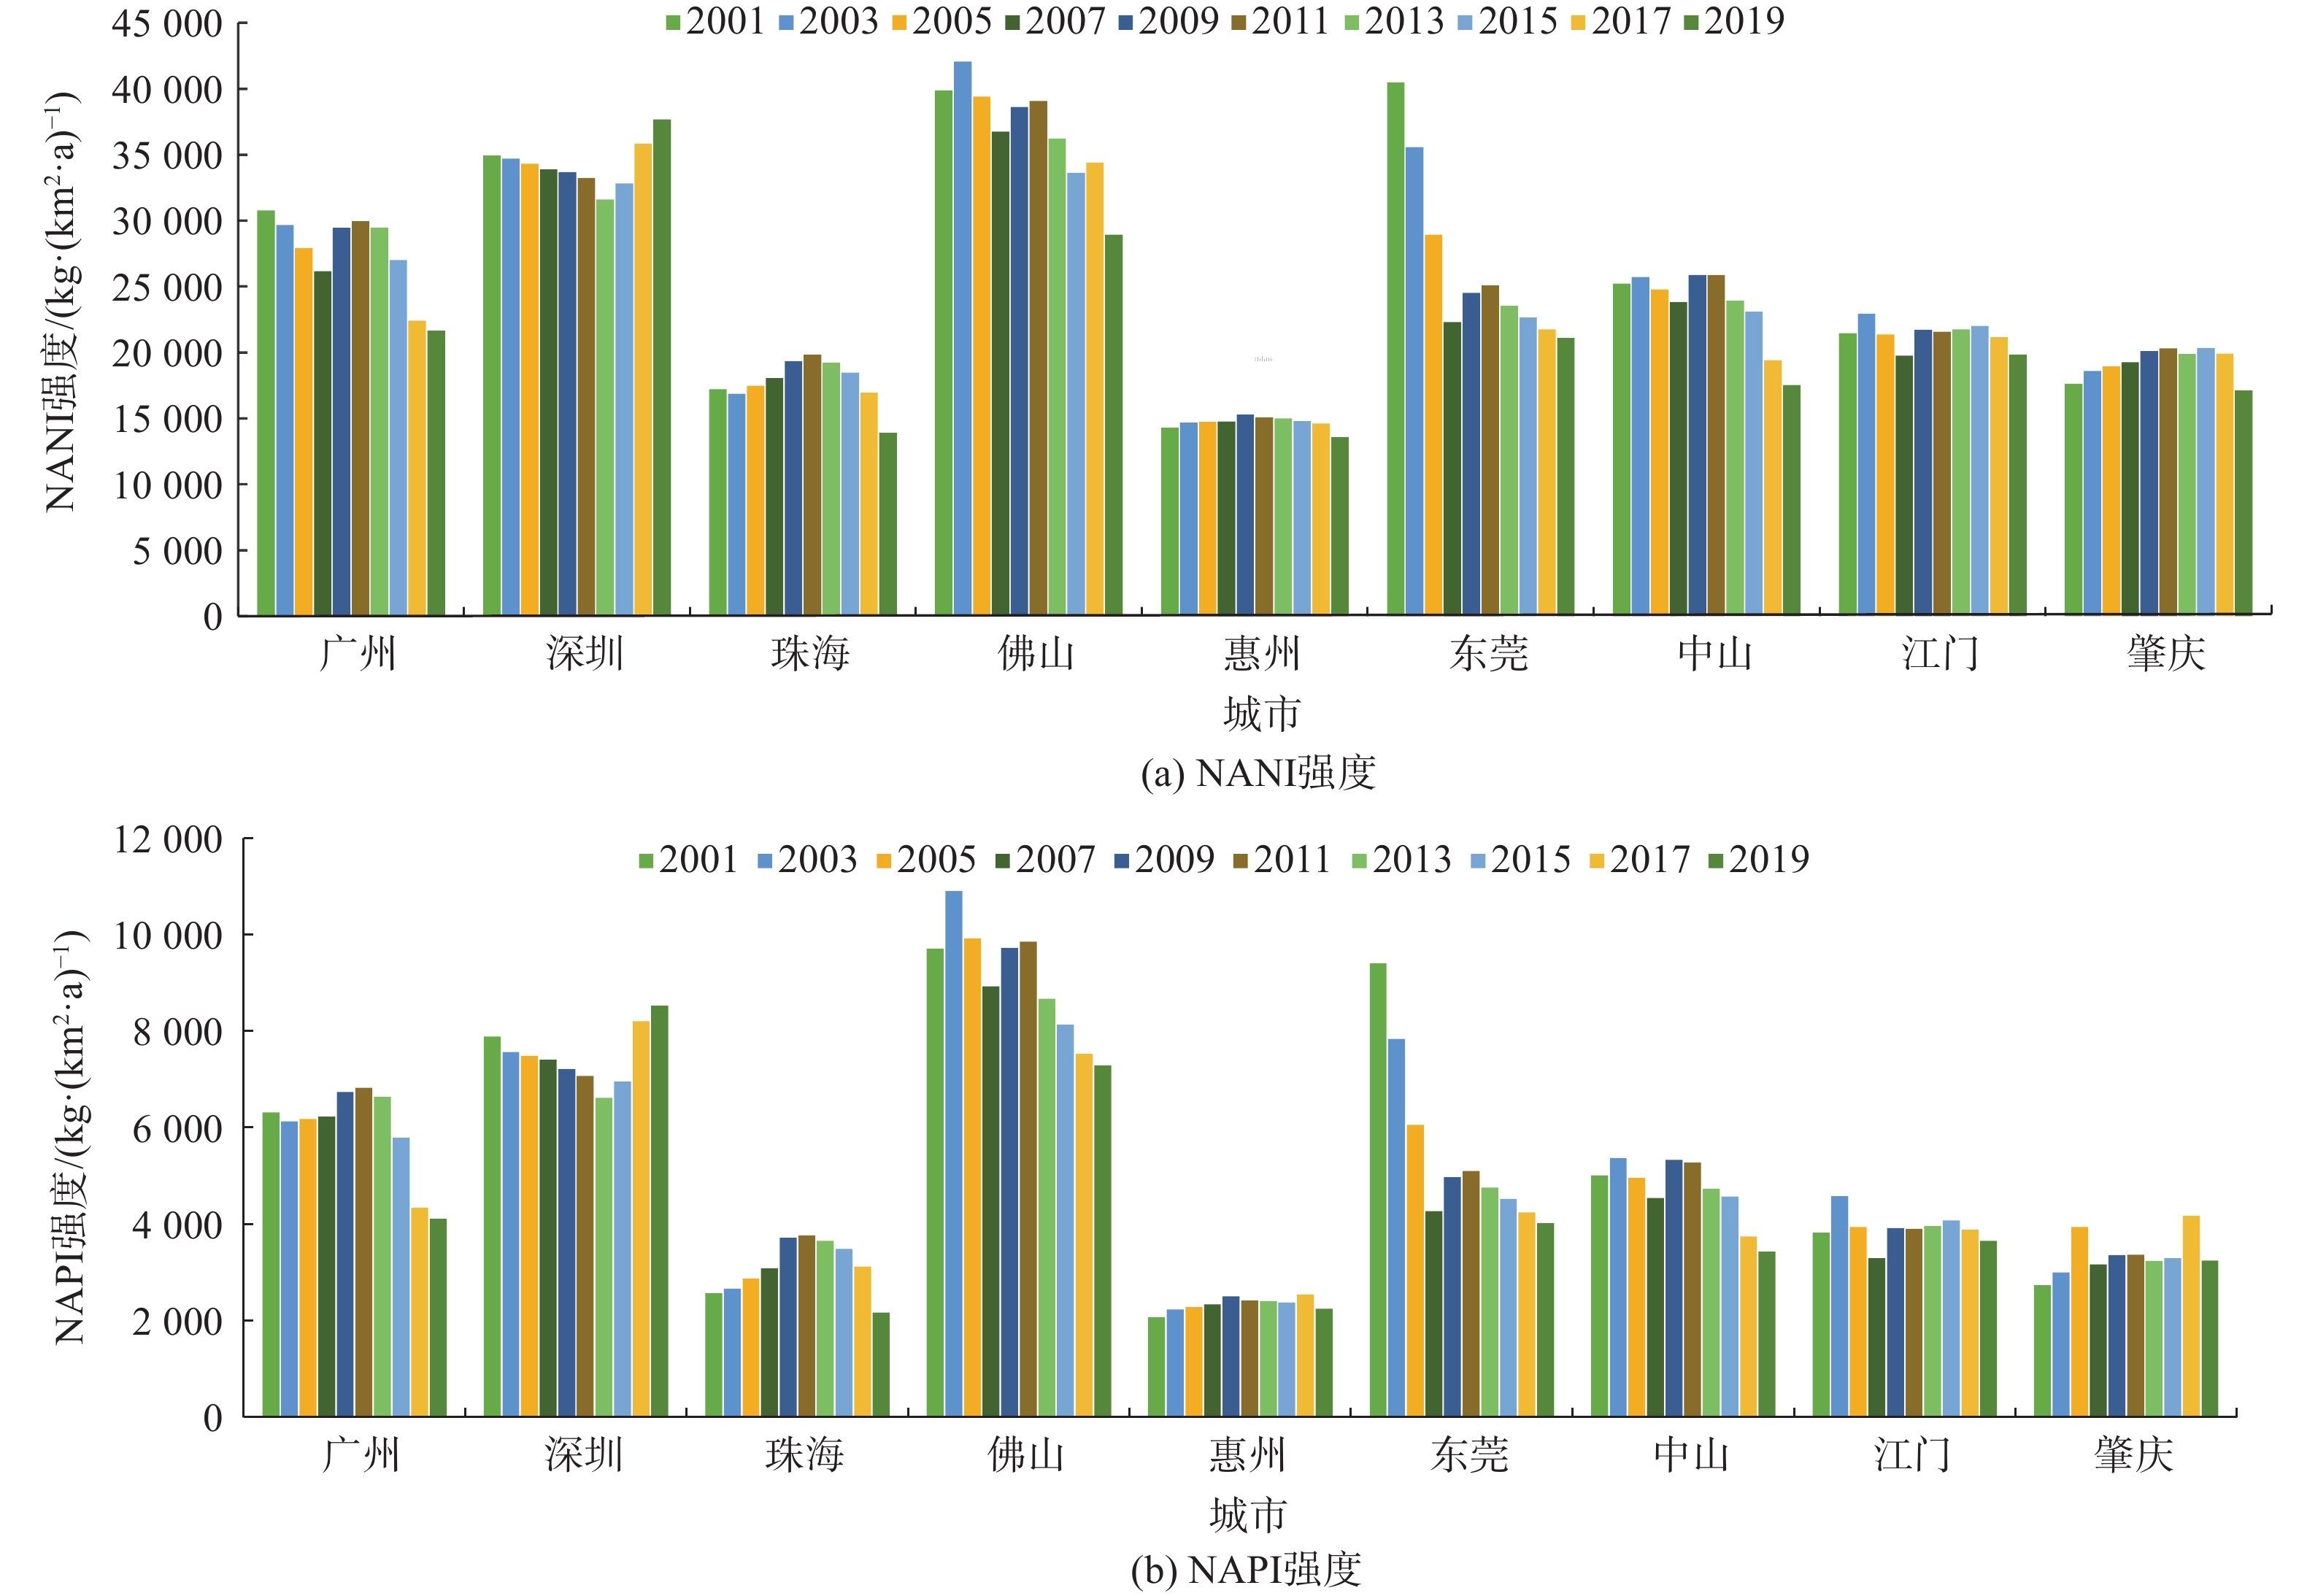
进一步对9个城市的时间变化情况(图5)进行分析后发现,只有深圳市的NANI和NAPI强度呈现上升趋势,而其他城市在调查年份中均有所下降,趋势与整个珠三角地区相一致。其中,东莞市的NANI强度下降幅度最大,约为48%,这主要源于农业肥料和动物消费两大输入源的减少。历史资料表明,东莞市政府自2005年起开始推行禁养政策,对全市畜禽养殖场进行全面整治[34],导致动物数量骤减。这也使得2005年之后东莞市动物饲料产生的氮磷输入量大幅度减少。从空间上看,2000—2019年各城市的NANI和NAPI强度表现出了较大的空间差异性,其均值的大小顺序为:佛山>深圳>广州>东莞>中山>江门>肇庆>珠海>惠州。整体规律为珠三角地区中部及沿海经济发达城市的营养元素输入强度高于其他周边城市,这种不平衡性可能是由于各城市的发展不均匀性所致。
-
2019年,珠三角地区的人为净氮、磷输入量分别为1 051 188 t和203 632 t,其输入途径如图6所示。人类食物和动物饲料是净氮和净磷输入的最大贡献源,分别占各自的53.68%和68.47%,故人口和动物的数量通常是人类食物和动物饲料中的净氮和净磷输入的主要影响因素;大气氮沉降是NANI的第二重要来源;非食物来源的净P输入是NAPI的第二大来源;肥料中的净氮和净磷输入分别是NANI和NAPI的第三大来源。上述分析表明,随着珠三角城市化进程的加快和人口密度的增加,人类食物和动物饲料的净氮和磷输入成为最大的NANI和NAPI来源,农业化肥的施用已不再是造成区域氮磷污染的最主要因素。
由于地理因素和人类活动程度的差异,珠三角地区各城市的不同组分贡献率也有所不同(见表2和表3),但总体上与整个珠三角地区一致。绝大部分城市人类和动物消费输入量占总输入量的50%以上。珠三角地区NANI和NAPI的主要输入来源与我国其他地区也存在显著差异。该区域人类食物和动物饲料带来的氮、磷输入年平均强度显著高于其他区域[27-29]。高城市化率带来的高水平人类活动对人类和动物消费营养输入有重大影响,这也是珠三角区别于其他地区的特征之一。NANI和NAPI在其他地区的最大输入源主要是农业化肥消耗[26-30]。珠三角地区的农业肥料输入占比不高的原因在于其农业用地比例的逐年降低,正是由于城市化进程的加快导致了农业用地向城市用地转化。
-
NANI、NAPI的影响因素主要包括社会经济因素、农业因素和土地利用方式[35-37]。本研究在社会经济因素中主要考虑人口密度、地区生产总值、农业总产值和城市化率;农业相关的影响因素考虑氮肥/磷肥施用量和家畜/家禽养殖密度;土地利用方式受社会经济因素的影响,与城市化过程息息相关,且其在模型计算中对人类活动氮磷输入的影响主要体现在氮肥和磷肥的投入量上,因而不做单独分析。对珠三角地区的NANI和NAPI与社会经济因素和农业因素进行了灰色关联度分析,结果见表4。分析结果显示,城市化率和畜禽养殖密度是珠三角地区NANI和NAPI最重要的影响因素。
1)城市化率。与NANI和NAPI排放强度变化关联度最高的是城市化率,其与NANI和NAPI的关联度达到了0.874和0.882;同时,人口密度的关联度也较高。这表明社会经济因素是珠三角地区人为氮磷输入量的主要影响因素。城市化的发展带来人口密度的增加,加剧了包括大量食品消费造成的餐厨废水和包括粪便废水、含磷洗涤废水在内的生活污水的排放。2018年,珠三角地区生活污水排放总量高达69.2×10⁹ t,占广东省的88.7%。人类食品消费量和洗涤剂用量的增长,造成大量营养物质输入到环境中,成为珠三角地区NANI和NAPI的主要来源。因此,有必要在珠三角地区构建绿色可循环的食物循环系统并实施严格的污水处理标准,以期控制珠三角地区大量的食品消费性氮磷输入和非食品性磷输入。
2)畜禽养殖密度。农业因素中,家畜/家禽的养殖密度与NANI和NAPI的关联度仅次于城市化率。结合模型计算数据可得出,近年来珠三角地区氮磷输入量逐渐减小的主要原因为畜禽养殖量的减少,这也是珠三角人口密度逐年增加的情况下其氮磷输入量缓慢减少的原因。在调查时段内政府出台了相关政策:首先在《珠三角地区改革发展规划纲要》(2008—2020年)中明确提出了珠三角地区要大力发展第二、第三产业的发展方略,故而2008年之后农业发展受到限制;最值得关注的是2008年广东省发布的《兴办规模化畜禽养殖场指南》《广东省环境保护厅关于加强规模化畜禽养殖污染防治促进生态健康发展的意见》等政策文件,直接导致了调查年份内畜禽养殖量的锐减(2000—2019年减少了27%)。另一个较为重要的农业因素是肥料施用量。随着珠三角地区城市化率的增加和产业结构的调整,耕地面积逐年减少,因而肥料施用量也有所减少。但实际上,逐年减少的耕地由于过度耕作造成施肥强度的不减反增,使得珠三角地区性肥料氮、磷污染也不容忽视。综上所述,可提出畜禽粪便资源化和科学施肥2条建议以控制珠三角地区的农业氮磷输入量。
-
1)珠三角地区整体的NANI和NAPI强度在前10年间呈现先减后增的波动,而近10年来持续下降,但仍高于国内大部分地区。在空间上,9个城市的NANI和NAPI强度差异较大,呈现出珠三角中心及沿海等发达城市高,周边城市低的规律。
2)来自人类食物和动物饲料消费的氮和磷输入是NANI和NAPI的主要贡献来源。这表明在高度城市化的地区,需要从外部进口氮和磷来满足密集人口对氮和磷的需求。肥料输入不再是该地区的氮磷主要输入源,这也是高度城市化使得农业衰落的体现。
3)城市化率是与NANI和NAPI强度变化关联度最高的影响因素,亦说明社会因素为珠三角地区人为氮磷输入的主要影响因素。其次,广东省政策指导下珠三角畜禽养殖密度的大幅度降低是2010年以来NANI和NAPI逐年降低的主要原因。
-
1)建立绿色可持续食物循环体系。由于珠三角地区经济的高度发展和其特有的饮食习惯,肉制品(包括猪肉、牛肉和羊肉)的人均消费量约为42.5 kg·a−1,远高于全国平均水平26.7 kg·a−1[38]。除此之外,餐厨垃圾在生活垃圾中的占比很大,大量的食物浪费也会对人为氮磷输入发挥较大影响。因此,建立一个可持续的绿色粮食循环系统将有助于减少珠三角的氮磷排放。具体措施有:①政府主观倡导人们建立绿色健康的饮食结构,这将导致有意识地减少肉类消费[39];②个人杜绝粮食浪费行为,积极响应国家的“光盘行动”号召,从而减少食物的不必要损耗。
2)污水处理厂终端控制。人类生活中的食物氮、磷消费和非食用性磷消费(洗涤剂等)由家庭污水排入城镇污水处理厂或直接进入水体。目前,珠三角地区的城市污水收集率为94.6%,其中佛山市仅为88.4%。尽管整体污水收集率较高,但生活污水排放量仍较大,约为4.0×10⁹ t·a−1。因此,可在提高污水收集率的同时,改良和升级传统污水生物处理工艺,探索短程硝化反硝化和厌氧氨氧化协同耦合工艺[40],以提高该区域城镇生活污水的氮磷处理效率。
3)畜禽粪便资源化。饲料中的营养物质只有约30%会被动物所吸收,剩余部分以排泄物形式进入环境[41]。因此,在珠三角地区进行畜禽排泄物的回收利用将有助于减少氮、磷进入环境的量。2020年,广东省畜禽粪污综合利用率达到75%以上,规模养殖场粪污处理设施装备配套率达到95%以上,基本完成了畜禽废弃物种养结合、农牧循环的资源化利用体系的构建[42]。目前,畜禽粪便资源化处理主要是堆肥,但畜禽粪肥中的重金属、抗生素及激素等有害物质残留会对土壤造成严重污染并影响农作物生长[43]。因此,珠三角地区应重点研发经济高效的畜禽粪便中重金属、抗生素及激素去除技术,以实现无害化和资源化利用。
4)科学施肥。肥料施用不合理不仅会造成氮磷流失,还会造成农田土壤的重金属污染,因此,有必要对肥料进行管控。若要在满足珠三角不断增加的粮食需求的同时减少肥料使用量,则关键在于提高养分的利用效率。相关措施有如下3点。①引入有机肥替代合成肥,可保持土壤肥力和作物产量,同时也是减少农田养分流失的有效途径[44-45]。②精准施肥技术,基于不同作物对肥料的不同类型和需求进行肥料管制。有研究证明,在充分了解农作物对养分的需求并调查土壤环境背景的基础上,可达到减少化肥施用量、提高产量且养分淋洗量同时减少的目的[46]。③施用新型肥料,如活性白云石磷石肥与传统的水溶性磷肥相比,可减少磷浸出,提高磷的利用率[47]。
珠江三角洲地区人为氮磷净输入特征及污染管控建议
Characteristics of anthropogenic net input of nitrogen and phosphorus and suggestions on pollution control in Pearl River Delta
-
摘要: 人为排放的氮磷对流域生态系统的大量输入会导致水体富营养化,因此,识别区域内氮、磷的输入来源对流域管理具有重要意义。珠江三角洲地区作为我国的高城市化城市群,其社会因素对生态环境的影响日益增大。利用珠江三角洲各城市社会经济统计数据,采用人类活动净氮、净磷输入(NANI和NAPI)模型,评估了珠江三角洲地区人为氮磷输入强度,分析了珠江三角洲氮磷输入的主要途径。结果表明:2000—2019年,珠江三角洲地区的NANI和NAPI强度呈现先波动上升后逐渐下降的趋势,波峰出现在2011年,分别为22 630 kg·(km2·a)−1和4 413 kg·(km2·a)−1;在2019年下降至近20 a来的最低值,分别为18 985 kg·(km2·a)−1和3 678 kg·(km2·a)−1。人类食品和动物饲料是人为氮磷净输入的最大来源,分别占各自的55.5%和68%。这表明大量的氮和磷通过食物系统进入环境中。灰色关联度分析结果表明,城市化率和畜禽养殖密度是影响珠江三角洲人为氮磷输入的最主要因素。本研究结果可为在该区域建立有效的氮磷综合管理措施提供参考。Abstract: The input of man-made nitrogen and phosphorus to the watershed ecosystem leads to water eutrophication. Therefore, identifying the input sources of nitrogen and phosphorus in the region is of great significance to watershed management. As a high urbanization urban agglomeration in China, the Pearl River Delta has an increasing impact on the ecological environment. Based on the socio-economic statistical data of cities in the Pearl River Delta, using the net anthropogenic N inputs (NANI) and net anthropogenic P inputs (NAPI) Models, this study evaluated the intensities of NANI and NAPI and revealed the main sources of nitrogen and phosphorus input in the Pearl River Delta. The results showed that the intensity of NANI and NAPI in this area increased firstly and then decreased gradually from 2000 to 2019. The fluctuation peaks appeared in 2011, which were 22 630 kg·(km2·a)−1 and 4 413 kg·(km2·a)−1 respectively. In 2019, it decreased to the lowest value of 18 985 kg·(km2·a)−1 and 3 678 kg·(km2·a)−1 in recent 20 years, respectively. Human food and animal feed were identified as the largest sources of nitrogen and phosphorus inputs, with contribution rates of about 55.5% and 68%, respectively. This indicated that large amounts of nitrogen and phosphorus entered the environment through the food system. The gray correlation analysis showed that the urbanization rate and livestock density are the main factors affecting the anthropogenic input of nitrogen and phosphorus in the Pearl River Delta region. The results of this study can provide a reference for establishing effective comprehensive management measures of nitrogen and phosphorus in the Pearl River Delta Basin.
-

-
表 1 NANI、NAPI模型计算公式与参数取值
Table 1. Calculation formulas and parameter values of NANI and NAPI models
输入模型类型 计算公式 符号含义 参数取值 参考文献 NANI $ {N}_{\mathrm{d}\mathrm{e}\mathrm{p}}={S}_{1}{I}_{1}+{S}_{2}{I}_{2} $ $ {S}_{1} $ $ {I}_{1} $ $ {S}_{2} $ $ {I}_{2} $
P:挥发后重新沉积的氮$ {I}_{1} $ $ {I}_{2} $ [21] NANI $ {N}_{\mathrm{c}\mathrm{h}\mathrm{e}\mathrm{m}} $ NF:氮肥折纯量;
CF:复合肥量;
rN:复合肥中氮含量rN=15% [22] NANI $ {N}_{\mathrm{s}\mathrm{e}\mathrm{e}\mathrm{d}} $ $ {{\sum }_{i=1}^{n}S}_{\mathrm{i}}{I}_{\mathrm{N}\mathrm{i}} $ $ {S}_{\mathrm{i}} $ $ {I}_{\mathrm{N}\mathrm{i}} $ $ {I}_{\mathrm{N}\mathrm{水}\mathrm{稻}} $ $ {I}_{\mathrm{N}\mathrm{薯}\mathrm{类}} $ $ {I}_{\mathrm{N}\mathrm{大}\mathrm{豆}} $ $ {I}_{\mathrm{N}\mathrm{油}\mathrm{料}} $ $ {I}_{\mathrm{N}\mathrm{蔬}\mathrm{菜}} $ $ {I}_{\mathrm{N}\mathrm{瓜}\mathrm{果}} $ [23] NANI $ {N}_{\mathrm{i}\mathrm{m}} $ $ {N}_{h\mathrm{c}}+{N}_{\mathrm{i}\mathrm{c}}-{N}_{\mathrm{i}\mathrm{p}}-{N}_{\mathrm{c}\mathrm{p}} $ $ {N}_{\mathrm{h}\mathrm{c}} $ $ {N}_{\mathrm{i}\mathrm{c}} $ $ {{\sum }_{i=1}^{n}k}_{\mathrm{i}}{P}_{\mathrm{i}} $ $ {N}_{\mathrm{i}\mathrm{p}} $ $ {{\sum }_{i=1}^{n}g}_{\mathrm{i}}{P}_{\mathrm{i}} $ $ {N}_{\mathrm{c}\mathrm{p}} $ $ {{\sum }_{i=1}^{n}q}_{\mathrm{i}}{Q}_{\mathrm{i}} $ $ {N}_{\mathrm{h}\mathrm{c}} $ $ {N}_{\mathrm{i}\mathrm{c}} $ $ {N}_{\mathrm{i}\mathrm{p}} $ $ {N}_{\mathrm{c}\mathrm{p}} $
k、$ {k}_{\mathrm{i}} $
Pe:各区域常住人口数;$ {P}_{\mathrm{i}} $ $ {g}_{\mathrm{i}} $ $ {q}_{\mathrm{i}} $ $ {Q}_{\mathrm{i}} $ k=4.58; $ {k}_{\mathrm{猪}} $ $ {k}_{\mathrm{牛}} $ $ {k}_{\mathrm{鸡}} $ $ {k}_{\mathrm{鸭}\mathrm{鹅}} $ $ {k}_{\mathrm{羊}} $ $ {g}_{\mathrm{猪}} $ $ {g}_{\mathrm{牛}} $ $ {g}_{\mathrm{鸡}} $ $ {g}_{\mathrm{鸭}\mathrm{鹅}} $ $ {g}_{\mathrm{羊}} $ $ {q}_{\mathrm{水}\mathrm{稻}} $ $ {q}_{\mathrm{薯}\mathrm{类}} $ $ {q}_{\mathrm{大}\mathrm{豆}} $ $ {q}_{\mathrm{油}\mathrm{料}} $ $ {q}_{\mathrm{蔬}\mathrm{菜}} $ $ {q}_{\mathrm{瓜}\mathrm{果}} $ [23-25] NANI $ {N}_{\mathrm{f}\mathrm{i}\mathrm{x}} $ $ {{\sum }_{i=1}^{n}S}_{i}{f}_{i} $ $ {S}_{\mathrm{i}} $ $ {\mathrm{I}}_{\mathrm{i}} $ $ {I}_{\mathrm{水}\mathrm{稻}} $ $ {I}_{\mathrm{花}\mathrm{生}} $ $ {I}_{\mathrm{大}\mathrm{豆}} $ [26] NAPI $ {P}_{\mathrm{c}\mathrm{h}\mathrm{e}\mathrm{m}} $ PF:磷肥折纯量(以P2O5计);
CF:复合肥量;
rP:复合肥中五氧化二磷含量rP=15% [22] NAPI $ {\mathrm{P}}_{\mathrm{s}\mathrm{e}\mathrm{e}\mathrm{d}} $ $ {{\sum }_{i=1}^{n}S}_{\mathrm{i}}{I}_{\mathrm{P}\mathrm{i}} $ $ {S}_{\mathrm{i}} $ $ {I}_{\mathrm{P}\mathrm{i}} $ $ {I}_{\mathrm{P}\mathrm{水}\mathrm{稻}} $ $ {I}_{\mathrm{P}\mathrm{薯}\mathrm{类}} $ $ {I}_{\mathrm{P}\mathrm{大}\mathrm{豆}} $ $ {I}_{\mathrm{P}\mathrm{油}\mathrm{料}} $ $ {I}_{\mathrm{P}\mathrm{蔬}\mathrm{菜}} $ $ {I}_{\mathrm{P}\mathrm{瓜}\mathrm{果}} $ [27] NAPI $ {P}_{\mathrm{i}\mathrm{m}} $ $ {P}_{\mathrm{h}\mathrm{c}}+{P}_{\mathrm{i}\mathrm{c}}-{P}_{\mathrm{i}\mathrm{p}}-{P}_{\mathrm{c}\mathrm{p}} $ $ {P}_{\mathrm{h}\mathrm{c}} $ $ {P}_{\mathrm{i}\mathrm{c}} $ $ {{\sum }_{i=1}^{n}k}_{\mathrm{P}\mathrm{i}}{P}_{\mathrm{i}} $ $ {P}_{\mathrm{i}\mathrm{p}} $ $ {{\sum }_{i=1}^{n}g}_{\mathrm{P}\mathrm{i}}{P}_{\mathrm{i}} $ $ {P}_{\mathrm{c}\mathrm{p}} $ $ {{\sum }_{i=1}^{n}q}_{\mathrm{P}\mathrm{i}}{Q}_{\mathrm{i}} $ $ {N}_{\mathrm{h}\mathrm{c}} $ $ {N}_{\mathrm{i}\mathrm{c}} $ $ {N}_{\mathrm{i}\mathrm{p}} $ $ {N}_{\mathrm{c}\mathrm{p}} $
k、$ {k}_{\mathrm{P}\mathrm{i}} $
Pe:各区域常住人口数;$ {P}_{\mathrm{i}} $ $ {g}_{\mathrm{P}\mathrm{i}} $ $ {q}_{\mathrm{P}\mathrm{i}} $ $ {Q}_{\mathrm{i}} $ k=0.52; $ {k}_{\mathrm{猪}} $ $ {k}_{\mathrm{牛}} $ $ {k}_{\mathrm{鸡}} $ $ {k}_{\mathrm{鸭}\mathrm{鹅}} $ $ {k}_{\mathrm{羊}} $ $ {g}_{\mathrm{猪}} $ $ {g}_{\mathrm{牛}} $ $ {g}_{\mathrm{鸡}} $ $ {g}_{\mathrm{鸭}\mathrm{鹅}} $ $ {g}_{\mathrm{羊}} $ $ {q}_{\mathrm{水}\mathrm{稻}} $ $ {q}_{\mathrm{薯}\mathrm{类}} $ $ {q}_{\mathrm{大}\mathrm{豆}} $ $ {q}_{\mathrm{油}\mathrm{料}} $ $ {q}_{\mathrm{蔬}\mathrm{菜}} $ $ {q}_{\mathrm{瓜}\mathrm{果}} $ [23,25,27] NAPI $ {P}_{\mathrm{n}\mathrm{o}\mathrm{n}} $ l:人均非食物性磷年排放量,kg;
Pe:各区域常住人口数l=0.63 [27] 表 2 各组分对9市及珠三角地区NANI的贡献率
Table 2. Contribution rate of each component to NANI in 9 cities and Pearl River Delta %
地域 $ {N}_{\mathrm{d}\mathrm{e}\mathrm{p}} $ $ {N}_{\mathrm{c}\mathrm{h}\mathrm{e}\mathrm{m}} $ $ {N}_{\mathrm{s}\mathrm{e}\mathrm{e}\mathrm{d}} $ $ {N}_{\mathrm{i}\mathrm{m}} $ $ {N}_{\mathrm{f}\mathrm{i}\mathrm{x}} $ 广州 13.9±3.67 18.5±4.76 2.54±0.794 63.9±3.40 1.25±0.390 深圳 13.8±0.899 4.00±1.43 0.082 3±0.080 82.1±0.938 0.029 4±0.043 珠海 23.3±3.62 17.1±6.47 1.58±0.778 57.2±6.46 0.726±0.360 佛山 9.17±2.57 17.6±3.25 1.04±0.735 71.7±2.71 0.491±0.345 惠州 27.2±1.15 24.2±0.960 4.75±1.12 40.9±2.74 2.97±0.735 东莞 16.5±4.85 8.6±3.62 0.467±0.379 74.3±1.934 0.181±0.179 中山 14.4±4.91 25.4±6.11 2.08±1.67 57.3±3.19 0.888±0.731 江门 16.6±1.13 25.3±1.16 6.23±0.352 48.7±2.07 3.16±0.207 肇庆 16.3±2.13 32.9±2.66 4.50±0.329 43.8±1.83 2.52±0.149 珠三角 16.6±1.86 22.6±1.29 3.47±0.447 55.5±1.26 1.87±0.250 注: $ {N}_{\mathrm{d}\mathrm{e}\mathrm{p}} $ $ {N}_{\mathrm{c}\mathrm{h}\mathrm{e}\mathrm{m}} $ $ {N}_{\mathrm{s}\mathrm{e}\mathrm{e}\mathrm{d}} $ $ {N}_{\mathrm{i}\mathrm{m}} $ $ {N}_{\mathrm{f}\mathrm{i}\mathrm{x}} $ 表 3 各组分对9市及珠三角地区NAPI的贡献率
Table 3. Contribution rate of each component to NAPI in nine cities and Pearl River Delta %
地域 $ {P}_{\mathrm{c}\mathrm{h}\mathrm{e}\mathrm{m}} $ $ {P}_{\mathrm{s}\mathrm{e}\mathrm{e}\mathrm{d}} $ $ {P}_{\mathrm{i}\mathrm{m}} $ $ {P}_{\mathrm{n}\mathrm{o}\mathrm{n}} $ 广州 4.92±1.81 0.011 4±0.003 95 77.2±6.33 17.8±6.28 深圳 2.61±2.60 0.000 3±0.000 37 53.6±8.62 43.8±7.52 珠海 5.63±2.34 0.009 0±0.005 32 75.7±6.06 18.7±5.36 佛山 3.14±0.342 0.004 3±0.002 82 84.5±3.60 12.4±3.33 惠州 17.3±1.85 0.028 9±0.009 39 72.4±2.05 10.3±0.958 东莞 3.01±0.975 0.002 2±0.001 68 60.7±10.9 36.3±11.6 中山 11.6±2.55 0.011 6±0.007 51 66.2±5.19 22.3±5.94 江门 9.64±0.923 0.032 6±0.003 64 82.9±1.61 7.41±0.729 肇庆 14.7±5.47 0.026 2±0.003 75 80.3±5.33 5.02±0.358 珠三角 8.88±1.94 0.017 5±0.002 86 76.4±4.23 14.72±2.55 注: $ {P}_{\mathrm{c}\mathrm{h}\mathrm{e}\mathrm{m}} $ $ {P}_{\mathrm{s}\mathrm{e}\mathrm{e}\mathrm{d}} $ $ {P}_{\mathrm{i}\mathrm{m}} $ $ {P}_{\mathrm{n}\mathrm{o}\mathrm{n}} $ 表 4 NANI、NAPI与社会经济和农业因素灰色关联度分析
Table 4. Grey relational grade analysis of NANI with socio-economic and agricultural factors
模型种类 社会经济因素 农业因素 人口密度 地区生产总值 农业生产总值 城市化率 氮肥 磷肥 家畜养殖密度 家禽养殖密度 NANI 0.822 0.569 0.668 0.874 0.905 \ 0.834 0.858 NAPI 0.832 0.573 0.673 0.882 \ 0.811 0.840 0.863 -
[1] 吴锋, 战金艳, 邓祥征, 等. 中国湖泊富营养化影响因素研究——基于中国22个湖泊实证分析[J]. 生态环境学报, 2012, 21(1): 94-100. doi: 10.3969/j.issn.1674-5906.2012.01.018 [2] LIU W, QIU R L. Water eutrophication in China and the combating strategies[J]. Journal of Chemical Technology & Biotechnology: International Research in Process, Environmental & Clean Technology, 2007, 82.9: 781-786. [3] GALLOWAY J N. The global nitrogen cycle: past, present and future[J]. Biogeochemistry, 2004, 70(2): 153-226. doi: 10.1007/s10533-004-0370-0 [4] ZHANG W S, LI H P, LI Y L. Spatio-temporal dynamics of nitrogen and phosphorus input budgets in a global hotspot of anthropogenic inputs[J]. Science of the Total Environment, 2019, 656: 1108-1120. doi: 10.1016/j.scitotenv.2018.11.450 [5] 张维理, 武淑霞, 冀宏杰, 等. 中国农业面源污染形势估计及控制对策 I. 21世纪初期中国农业面源污染的形势估计[J]. 中国农业科学, 2004(7): 1008-1017. doi: 10.3321/j.issn:0578-1752.2004.07.012 [6] 张锋. 中国化肥投入的面源污染问题研究[D]. 南京: 南京农业大学, 2011. [7] FAN L C, YUAN Y M, YING Z C, et al. Decreasing farm number benefits the mitigation of agricultural non-point source pollution in China[J]. Environmental Science and Pollution Research, 2019, 26.1: 464-472. [8] 郝璐, 孙阁. 城市化对流域生态水文过程的影响研究综述[J]. 生态学报, 2021, 41(1): 13-26. [9] REISINGER A J, GROFFMAN P M, ROSI-MARSHALL E J. Nitrogen-cycling process rates across urban ecosystems[J]. FEMS Microbiology Ecology. 2016, 92 (12). [10] 蔡梓灿, 王晟, 陈岩, 等. 长江经济带人为磷输入驱动效应多时空测度[J]. 环境科学与技术, 2020, 43(6): 197-204. [11] RYAN Z J, ERIC C, MARTY M. Load estimations using loadest within agriculturally dominated watersheds across the continental united states[P]. American Ecological Engineering Society 10th Annual Meeting, 2010. [12] DOUGLAS-MANKIN K R, SRINIVASAN R, ARNOLD J G. Soil and Water Assessment Tool (SWAT) model: Current developments and applications[J]. Transactions of the ASABE, 2010, 53,(5): 1423-1431. doi: 10.13031/2013.34915 [13] 王雨珊. 中国七大流域人为净磷输入及河流入海磷通量研究[D]. 北京: 北京林业大学, 2020. [14] HOWARTH R W, SWANEY D P, BOYER E W, et al. The influence of climate on average nitrogen export from large watersheds in the Northeastern United States[J]. Nitrogen cycling in the Americas:natural and anthropogenic influences and controls. Springer, Dordrecht, 2006: 163-186. [15] HONG B, SWANEY D P, MORTH C M, et al. Evaluating regional variation of net anthropogenic nitrogen and phosphorus inputs (NANI/NAPI), major drivers, nutrient retention pattern and management implications in the multinational areas of Baltic Sea basin[J]. Ecological Modelling, 2012, 227: 117-135. doi: 10.1016/j.ecolmodel.2011.12.002 [16] 姚梦雅, 胡敏鹏, 陈丁江. 1980~2015年长江流域净人为氮输入与河流氮输出动态特征[J]. 环境科学, 2021, 42(12): 5777-5785. doi: 10.13227/j.hjkx.202104259 [17] 陈新闯, 李锋, 李小倩, 等. 珠三角城市群生态空间分区方法与管控对策[J]. 生态学报, 2021, 41(13): 5233-5241. [18] 赵鑫. 珠三角地区土地利用变化及生态承载力研究[D]. 赣州: 江西理工大学, 2020. [19] MAO Y P, ZHANG H, TANG W Z, et al. Net anthropogenic nitrogen and phosphorus inputs in Pearl River Delta region (2008–2016)[J]. Journal of Environmental Management, 2021, 282: 111952. doi: 10.1016/j.jenvman.2021.111952 [20] The World Bank. East Asia’s Changing Urban Landscape: Measuring a Decade of Spatial Growth[EB]. [2015-1-26]. https://www.worldbank.org/en/topic/urbandevelopment/publication/east-asias-changing-urban-landscape-measuring-a-decade-of-spatial-growth [21] YU X, PAN Y P, SONG W, et al. Wet and dry nitrogen depositions in the Pearl River Delta, South China: observations at three typical sites with an emphasis on water-soluble organic nitrogen[J]. Journal of Geophysical Research: Atmospheres, 2020, 125, (3). [22] 刘艳萍. 洞庭湖流域人类活动净氮/磷输入(NANI/NAPI)时空分布评估[D]. 北京: 北京林业大学, 2019. [23] HAN Y G, FAN Y T, YANG P L, et al. Net anthropogenic nitrogen inputs (NANI) index application in Mainland China[J]. Geoderma, 2014, 213(2): 87-94. [24] 高伟, 高波, 严长安, 等. 鄱阳湖流域人为氮磷输入演变及湖泊水环境响应[J]. 环境科学学报, 2016, 36(9): 3137-3145. [25] JORDAN T E, WELLER D E. Human contributions to terrestrial nitrogen flux[J]. BioScience, 1996, 46.9: 655-664. [26] ZHANG W S, SWANEY D P, LI X Y, et al. Anthropogenic point-source and non-point-source nitrogen inputs into Huai River basin and their impacts on riverine ammonia–nitrogen flux[J]. Biogeosciences, 2015, 12(14): 4275-4289. doi: 10.5194/bg-12-4275-2015 [27] HAN Y G, FAN Y T, YANG P L, et al. Net anthropogenic phosphorus inputs (NAPI) index application in Mainland China[J]. Chemosphere, 2013, 90(2): 329-337. doi: 10.1016/j.chemosphere.2012.07.023 [28] HAN Y G, FENG G, SWANEY D P, et al. Global and regional estimation of net anthropogenic nitrogen inputs (NANI)[J]. Geoderma, 2020, 361: 114066. doi: 10.1016/j.geoderma.2019.114066 [29] GAO W, SWANEY D P, HONG B, et al. Evaluating anthropogenic N inputs to diverse lake basins: A case study of three Chinese lakes[J]. Ambio, 2015, 44(7): 635-646. doi: 10.1007/s13280-015-0638-8 [30] HU M P, LIU Y M, ZHANG Y F, et al. Long-term (1980–2015) changes in net anthropogenic phosphorus inputs and riverine phosphorus export in the Yangtze River basin[J]. Water Research, 2020, 177: 115779. doi: 10.1016/j.watres.2020.115779 [31] CHEN F, HOU L J, LIU M, et al. Net anthropogenic nitrogen inputs (NANI) into the Yangtze River basin and the relationship with riverine nitrogen export[J]. Journal of Geophysical Research:Biogeosciences, 2016, 121(2): 451-465. doi: 10.1002/2015JG003186 [32] 黄成, 侯伟, 顾继光, 等. 珠江三角洲城市周边典型中小型水库富营养化与蓝藻种群动态[J]. 应用与环境生物学报, 2011, 17(3): 295-302. [33] 曾丹娜, 牛丽霞, 陶伟, 等. 夏季珠江口水域营养盐分布特征及其富营养化评价[J]. 广东海洋大学学报, 2020, 40(3): 73-82. doi: 10.3969/j.issn.1673-9159.2020.03.010 [34] 陈志坚, 陈楠, 陈庆垒. 东莞畜禽养殖现状及存在的问题[J]. 当代畜禽养殖业, 2017(4): 51-52. doi: 10.3969/j.issn.1005-5959.2017.04.045 [35] 徐浩林, 杨培岭, 邢伟民, 等. 湖北省2008~2017年人类活动净氮输入状况[J]. 中国环境科学, 2020, 40(9): 4017-4028. doi: 10.3969/j.issn.1000-6923.2020.09.034 [36] 丁雪坤, 王云琦, 韩玉国, 等. 三峡库区人类活动净氮输入量估算及其影响因素[J]. 中国环境科学, 2020, 40(1): 206-216. doi: 10.3969/j.issn.1000-6923.2020.01.023 [37] 李影, 刘宏斌, 雷秋良等. 洱海流域乡镇尺度上人类活动对净氮输入量的影响[J]. 环境科学, 2018, 39(9): 4189-4198. [38] CHEN C, WEN Z G, WANG Y H. Nitrogen flow patterns in the food system among cities within urban agglomeration: A case study of the Pearl River Delta region[J]. Science of The Total Environment, 2020, 703: 135506. doi: 10.1016/j.scitotenv.2019.135506 [39] MOZAFFARIAN D, ANGELL S Y, LANG T, et al. Role of government policy in nutrition—barriers to and opportunities for healthier eating[J]. Brit Med J, 2018: 361. [40] 李健伟, 彭永臻, 张亮. 主流城市污水部分厌氧氨氧化技术的研究与工程化应用[J]. 给水排水, 2020, 56(S2): 5-9+16. [41] 吴银宝, 吴根义, 廖新俤. 实施清洁生产源头控制畜禽养殖污染[J]. 农业环境科学学报, 2021, 40(11): 2283-2291. doi: 10.11654/jaes.2021-1101 [42] 广东省农业农村厅. 2020年广东省畜禽粪污综合利用率将达到75%以上[EB]. [2018-1-31]. http://dara.gd.gov.cn/gzdt2266/content/post_1555779.html [43] 郑莉, 许燕滨, 黄绍松, 等. 集约化养殖场畜禽粪便治理及资源化利用的关键技术研究[R]. 广州:广东工业大学, 2019-06-12. [44] MENCARONI M, DAL F N, FURLANETTO J, et al. Identifying N fertilizer management strategies to reduce ammonia volatilization: Towards a site-specific approach[J]. Journal of Environmental Management, 2021, 277: 111445. doi: 10.1016/j.jenvman.2020.111445 [45] 訾利梅, 方一平. 不同养分替代模式对控制氮磷流失的影响[J]. 安徽农学通报, 2021, 27(7): 73-75. doi: 10.3969/j.issn.1007-7731.2021.07.029 [46] 薛利红, 李刚华, 侯朋福, 等. 太湖地区稻田持续高产的减量施氮技术体系研究[J]. 农业环境科学学报, 2016, 35(4): 729-736. doi: 10.11654/jaes.2016.04.017 [47] WANG X L, XIONG J B, HE Z L. Activated dolomite phosphate rock fertilizers to reduce leaching of phosphorus and trace metals as compared to superphosphate[J]. Journal of Environmental Management, 2020, 255: 109872. doi: 10.1016/j.jenvman.2019.109872 -


 下载:
下载:


