-
人类对土地的需求及开发日益增多,使其对河流岸线的侵占日益严重,导致河流岸边水土保持功能降低,面源污染物在降雨过程中随着径流和泥沙进入河流,对河流水生态功能造成严重影响[1-4]。河流生态缓冲带(本文主要探讨其中最主要的类型“河岸植被缓冲带”,后简称“缓冲带”)是保护河流水质的一道屏障,是具有改善河流水环境、控制面源污染和水土流失等重要作用的带状缓冲区域,可通过建立和恢复缓冲带来拦截面源污染[5]。近年来,国内外学者与管理部门加强了对缓冲带的研究与重视。我国先后颁布了《水污染防治法》《水污染防治行动计划》《重点流域水生态环境保护“十四五”规划编制技术大纲》等相关管理文件,对缓冲带保护与生态修复提出了新要求[5]。在实际应用中,如何合理确定植被缓冲带的宽度及构建方法,逐渐成为学者们与管理部门关注的热点之一。
国内外学者对缓冲带宽度的研究主要采用经验值和模型模拟计算2种方式[6]。其中,基于经验值的定量研究较少且适应性窄,难以推广应用;基于模拟计算的模型较多,主要包括VFSMOD模型、MANDER模型、REMM模型、SWAT模型等,模型模拟计算缓冲带宽度尽管所需参数较多、难度较大,但针对性较强,同等情景下可推广应用。其中,VFSMOD模型是一种用于模拟面源污染的田间尺度机制模型,模型参数获取相对简单,通过参数的设置与输入,可模拟计算不同情景下不同宽度的缓冲带对地表径流污染物的去除效率,取得了较好的效果并在国外得到了广泛的应用[7-12]。
大钱港是浙江省水生态保护与修复的重点示范水体,属于典型的平原河网型河流。平原河网型河流的水环境特点主要有:1)水系发达、河港纵横,水系成网状分布;2)地势平坦,水系水位落差小,水利闸坝较多,流向不定,水体流动性较差,水动力较弱;3)居住人口密集,水利水系变动较大,岸线被侵占问题突出;4)汊港水质一般较差,水体透明度较低,水环境承载力不足。对平原河网型缓冲带的划定,是指在地形坡度的基础上,结合汊港水体流向,综合考虑调整汇水分区,再结合土地利用状况、降水条件、土壤类型等现状条件,确定缓冲带的宽度。
本研究以浙江省湖州市大钱港为例,结合VFSMOD模型和大钱港流域自然和社会条件,沿干流及入河汊港两岸划定缓冲带,并选择典型区域构建缓冲带,以期为平原河网型缓冲带的划定与修复、水生态提升、水环境改善提供参考。
-
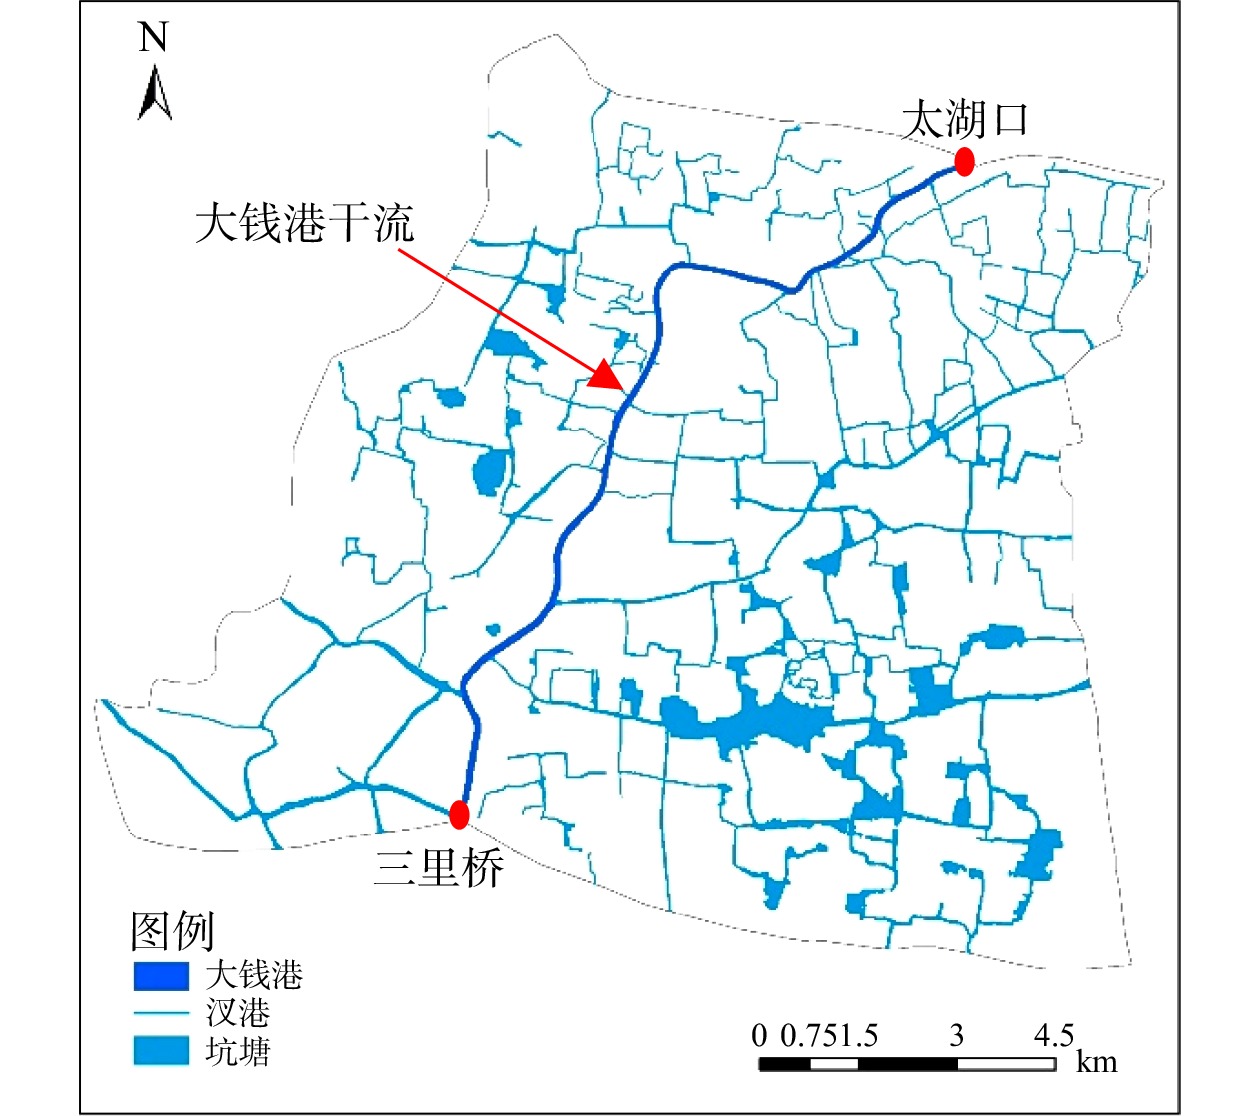
大钱港位于浙江省湖州市吴兴区、南太湖新区,起点为三里桥,终点为太湖口,是湖州市入太湖的主要支流之一。其干流长约12.9 km,河宽67 ~ 80 m,汊港宽度为3 ~ 110 m。大钱港区域水系总长度约520 km,区域面积约148 km2,河网密度约为3.5 km·km−2。河网水系情况如图1。湖州市地处北亚热带季风气候区,年平均气温12.2 ~ 17.3 ℃,年降水量761 ~ 1 780 mm,年平均风速1.7 ~ 3.2 m·s−1。湖州市东部区域为平原水网区,平均海拔仅3 m左右。其中,大钱港位于东部平原区,属于平原河网型河流。通过对大钱港区域缓冲带、农田等土地进行取样检测。研究区域内以壤土类土壤为主,土壤组成中黏粒成分较少,空隙适中,具有较好的透水性。
-
1)水文分区提取方法。大钱港(溇港)区域属于平原河网地区,因地势平坦,城镇化速度较快,河道受人类活动影响较大,故直接从DEM中提取汇水分区边界与实际情况的偏差较大[13-14],而DRLN算法、多流向算法、Burn in 算法等对人类活动影响较大的平原河网地区进行汇水分区划分的精度也不高[13-16]。因此,本研究在基于DEM提取河网子流域的基础上,结合对汊港、坑塘的水系连通、流向、水利等情况的现场踏勘与分析,最终确定大钱港区域的汇水分区。
2)土地利用类型解译方法。本研究采用10 m分辨率的遥感影像,利用多波段信息、NDWI数据以及NDVI时间序列数据,分析耕地、林地、草地、水域、城乡工矿居民用地等土地利用类型随时间变化的NDVI曲线特征及光谱特征,获得初级土地利用图;在一级土地利用分类图的基础上,结合实地踏勘结果进行校正,进一步对二级土地类别进行提取。
3)面源污染负荷核算方法。面源污染定量测定的方法主要有以下几种:一是模型模拟测算,基于小流域进行实验与模拟,通过数学模型,对污染负荷进行模拟测算[17-18];二是经验统计法,利用化肥、农药等农用化学品使用量、畜禽粪便排放量、水土流失、产排污系数等输出系数核算[17,19];三是综合分析,如磷指数法、潜在非点源污染指数法等[19-20]。基于区域数据资料,本研究采取等标排放量计算污染物的产排污系数法,对大钱港区域内面源污染负荷进行核算。
4)缓冲带宽度确定方法。依据《浙江省河流生态缓冲带划定与生态修复技术指南(建议稿)》(浙环函〔2020〕264号)(简称《指南》)[5],对大钱港(干流)及其部分汊港进行缓冲带的划定。
首先,按照河流两岸土地利用类型对河流河段进行划分。大钱港(干流)及其部分汊港主要包含城镇型河段、农田型河段、村落型河段3种类型。按照河流功能,又将农田型和村落型河段分为一般河流(河段)与特殊河流(河段)。其中,一般河流(河段)指满足水功能区要求、无特殊生态环境保护目标的河流(河段);特殊河流(河段)指不满足水功能区要求、具有特殊水环境功能与生态保护目标的河流(河段),如涉及生态红线区、水产种质资源保护区、饮用水水源保护区、鱼类“三场”及洄游通道、重要湿地等特殊保护区域。根据上述划分标准,大钱港(干流)及其部分汊港属于一般河流(河段)。
其次,对不同类型河段确定缓冲带的宽度。堤防型河段主要结合水利部门河道管理范围,将两岸堤防之间的沙洲、滩地、行洪区和堤防及护堤地,以及堤防背水侧护堤地范围划为缓冲带,其宽度为5~10 m;城镇型河段结合城市河道蓝线确定缓冲带的宽度;针对农田型、村落型和林草型河段,采用VFSMOD模型,通过选择设置土壤类型、坡度、降雨、径流区宽度、土地管理因子、种植植被信息、阻控污染物类型(沉积物、溶解物)等模型参数,进行模型计算,综合确定缓冲带的宽度。按表1给出的坡度值,采用插值法计算其余坡度条件下不同类型河流所对应缓冲带的宽度。
-
河流生态缓冲带的构建应遵循自然规律,尽量选取土著优势物种,慎重引进外来植物品种,且要选择对氮、磷等污染物去除能力较强、用途广泛、经济价值较高、观赏性强的物种。同时,应该考虑常绿树种与落叶树种混交、深根系植物和浅根系植物搭配、乔灌草相结合等。植物搭配一般采用“草本+乔木”、“草本+灌木”、“草本+灌木+乔木”3种配置方式。研究区河岸边主要为草本或者稀疏乔木。结合现状情况,本研究试点选择“草本+乔木”组合搭配方式,其径流截流效率较好[20]。邻水区域以乔木林带为主,保护堤岸、去除污染物,并为野生动物提供栖息地;近陆区域主要以草本植物为主,用于阻滞地表径流中的沉积物,吸收氮、磷和降解农药等污染物。
-
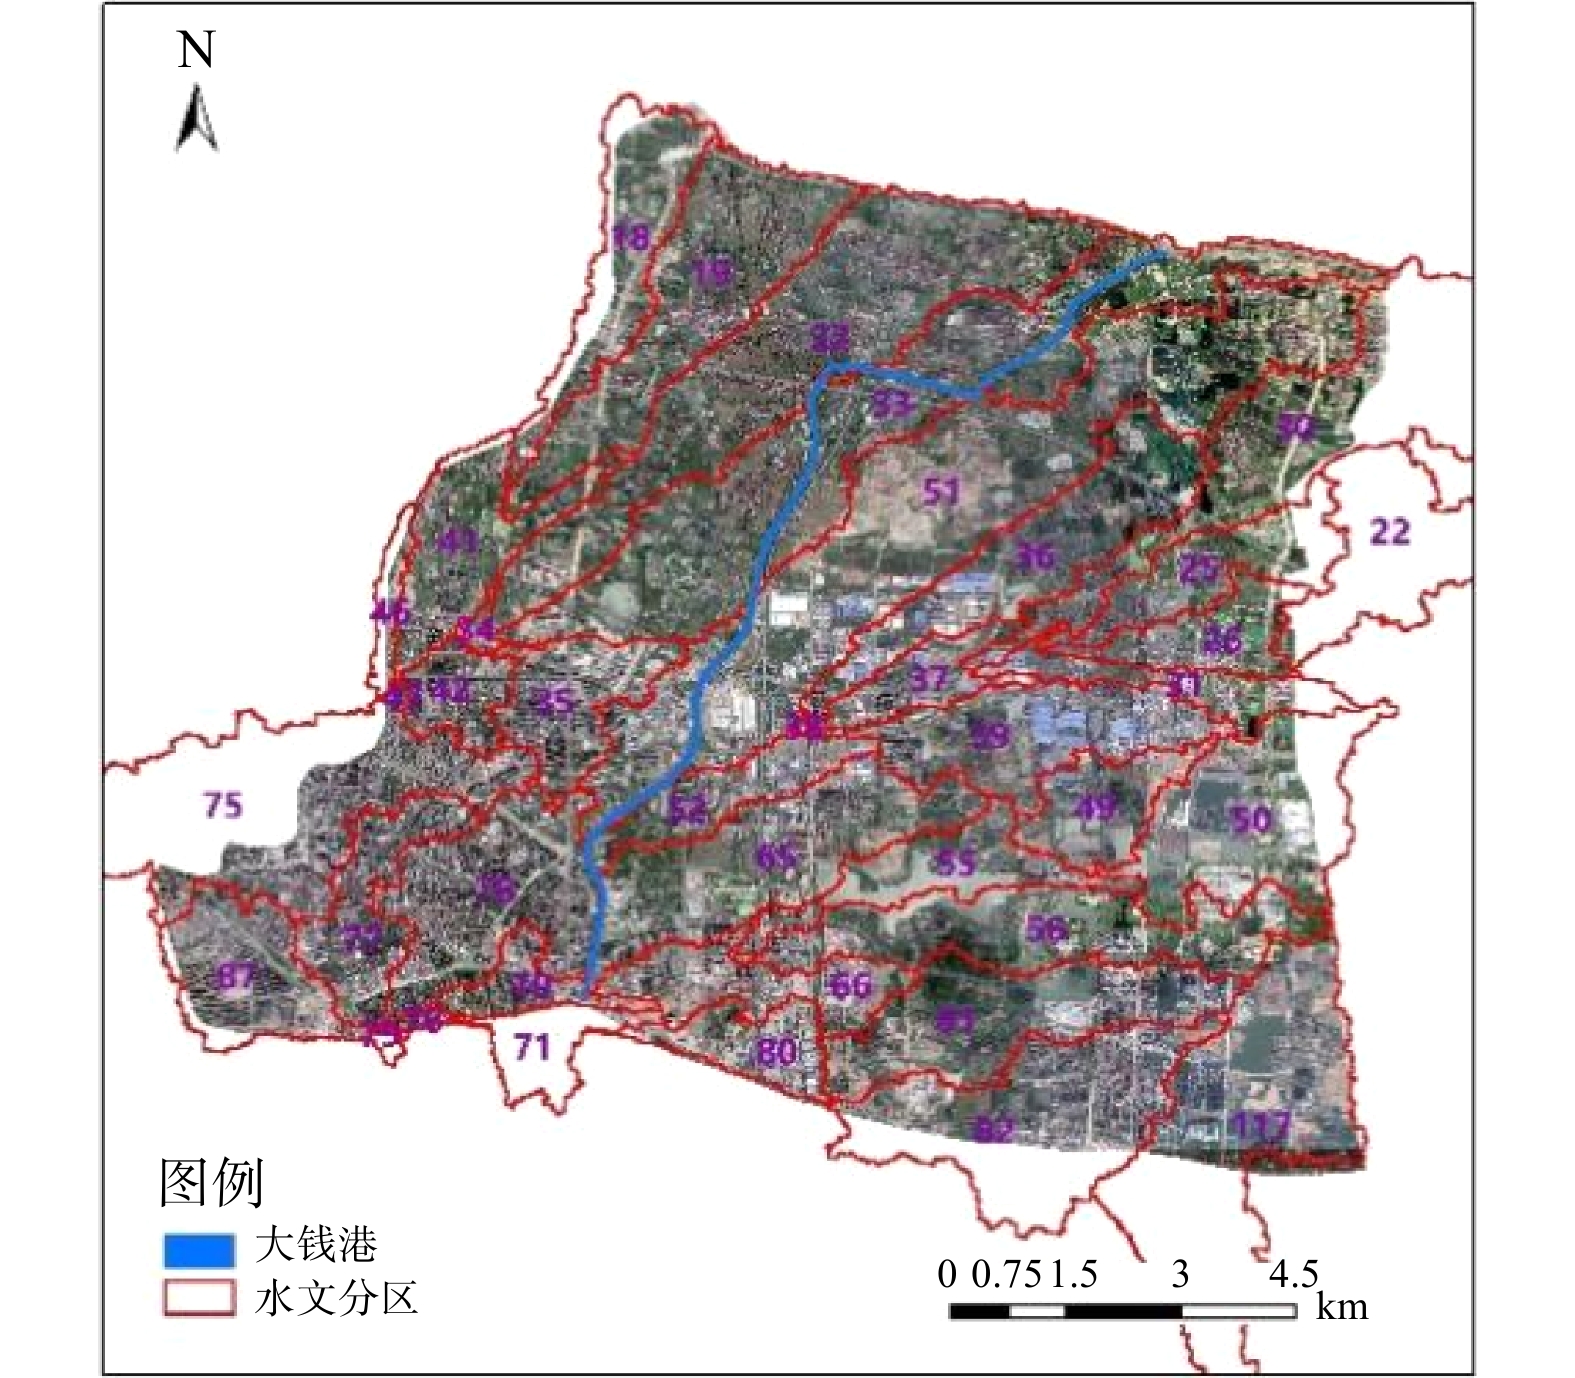
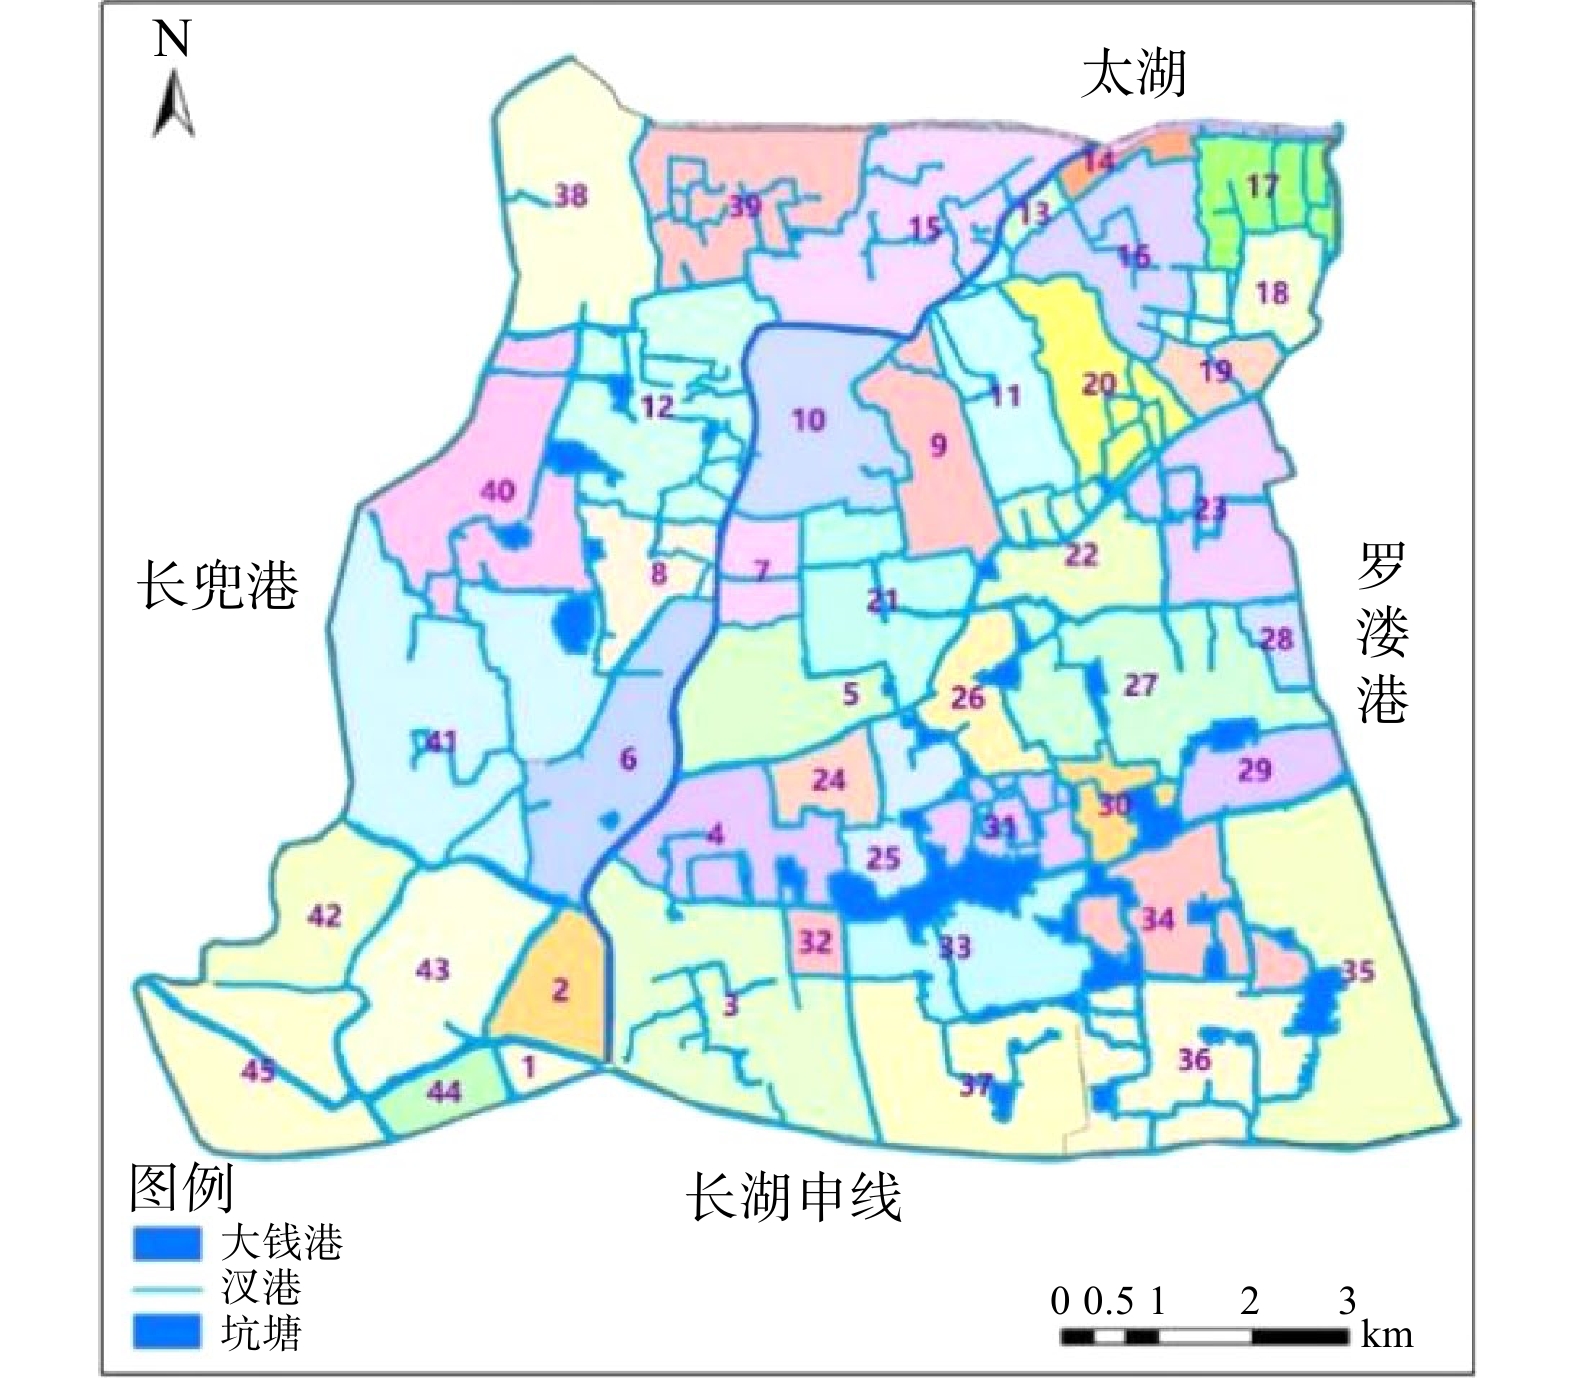
基于大钱港(溇港)区域内DEM数据,采用ArcGIS的水文分析模块进行水文分区的提取,共提取39个子流域分区(图2),其中大钱港干流途径7个子流域区。结合区域内汊港的水系连通、水体流向,对区域内DEM提取的39个子流域分区进行了综合调整,最终调整为45个水文分区,如图3所示。
-
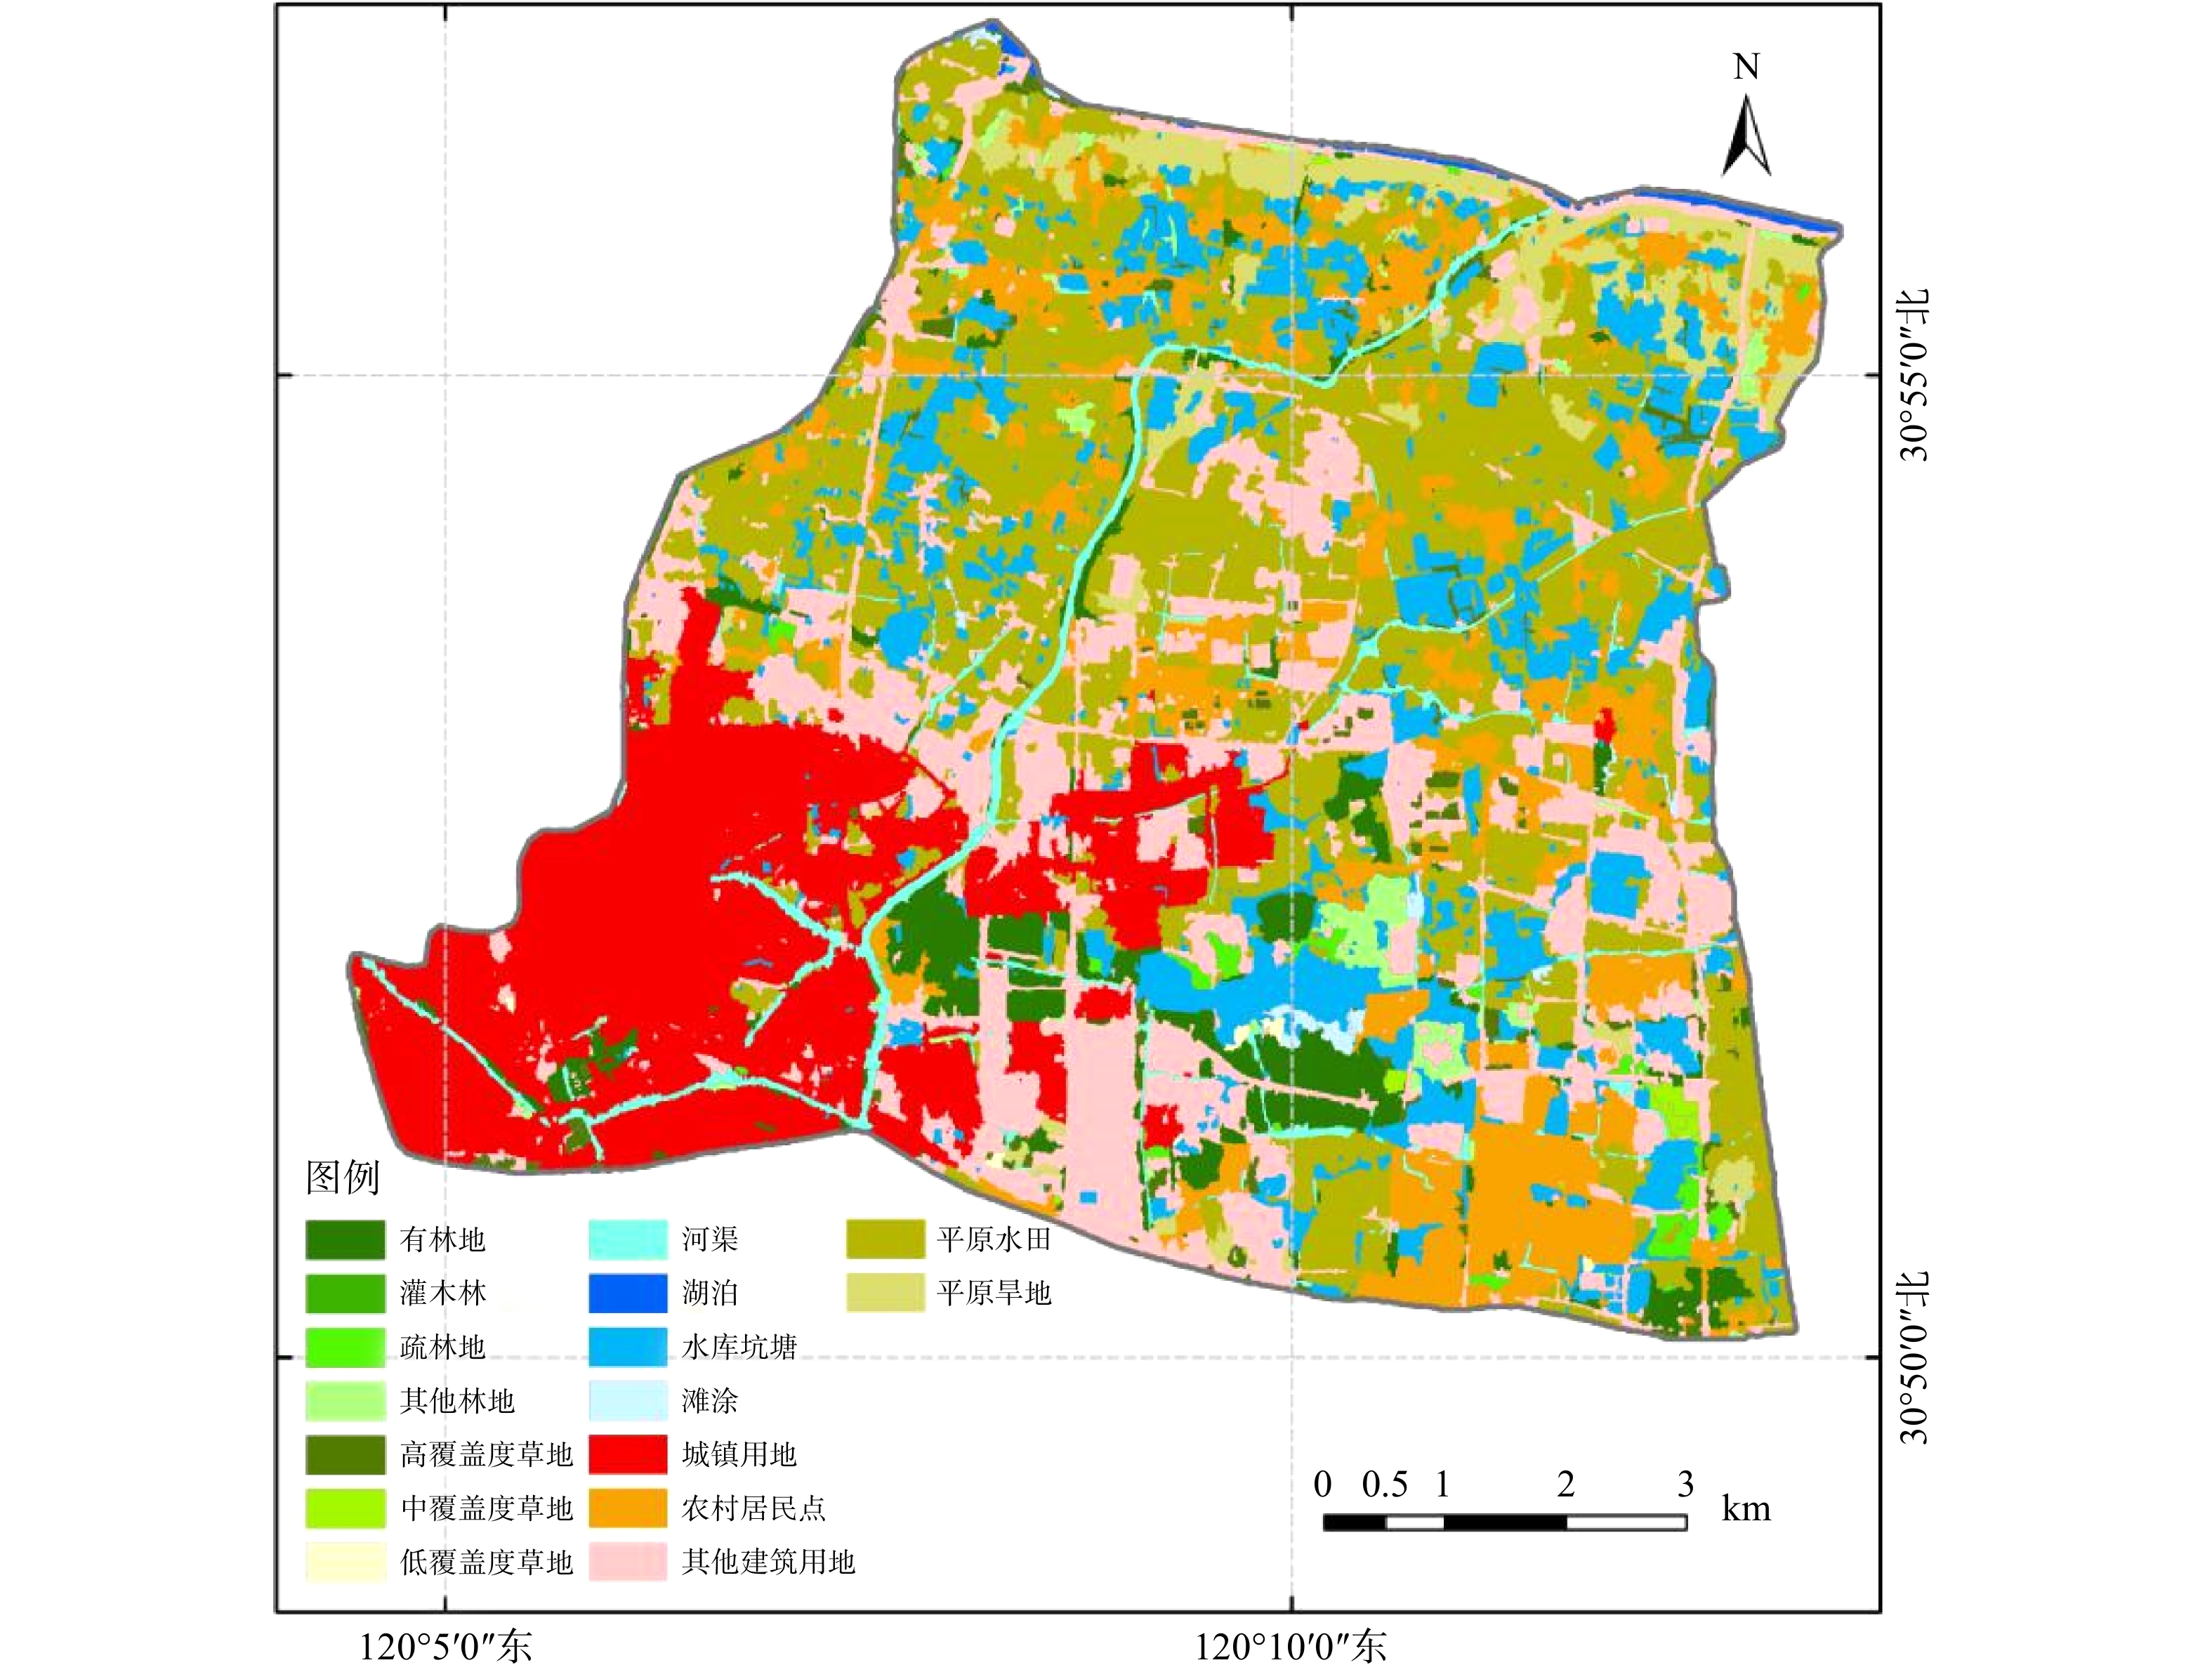
利用多波段卫星遥感信息、NDWI数据以及NDVI时间序列数据,对区域内土地利用现状进行解译和分析。在国家一级土地利用分类图的基础上,进一步对二级类别进行提取,得出16类土地类型,分别为有林地、灌木林、疏林地、其他林地、高覆盖度草地、中覆盖度草地、低覆盖度草地、河渠、湖泊、水库坑塘、滩涂、城镇用地、农村居民点、其他建设用地、平原旱地、平原水田。土地类型分布情况如图4所示。区域内土地利用情况较为集中,城镇居住区主要集中在区域的西南部,即大钱港上游区域;其余区域主要为农业种植、村落聚集区,即大钱港中下游区域。其中,建设用地面积为38.50 km2,占区域面积的比例最大,约45.62%,主要分布在区域的西南部;其次为耕地,耕地包含平原水田和平原旱地,耕地总面积为26.56 km2,占区域面积的31.47%,主要分布在区域中、下部;水域面积为12.37 km2,占区域面积的14.66%,形成水域网遍布于流域内;林地面积为5.41 km2,占区域面积的6.41%;草地面积最少,为1.54 km2,占区域面积的1.83%。
-
基于缓冲带的定义及功能,结合水文分区、土地利用类型解译结果,对区域内45个水文分区的农业农村面源污染进行了解析。依据《全国饮用水水源地环境保护规划》、生态环境部公布的农田径流污染物流失源强系数、《全国水环境容量核定技术指南》等相关资料,结合大钱港区域特征,标准农田的COD排放系数取为149 kg·(hm2·a)−1,氨氮排放系数取为30 kg·(hm2·a)−1,TN排放系数取为34 kg·(hm2·a)−1,TP排放系数取为1.79 kg·(hm2·a)−1;农村居民生活污染物排放系数中生活污水取为80 L·(人·d)−1,COD排放系数取为16.4 g·(人·d)−1,氨氮排放系数取为4.0 g·(人·d)−1,TN排放系数取为5.0 g·(人·d)−1,TP排放系取数为0.44 g·(人·d)−1。农业、农村生活污染物入河系数均取0.2。
依据遥感解译数据、区域内农村居住人口数据、污染物排放系数、入河系数等数据,大钱港45个水文分区的农田径流污染物COD的入河量为109.36 t·a−1,氨氮的入河量为21.86 t·a−1,TP的入河量为1.31 t·a−1,TN的入河量为25.13 t·a−1。
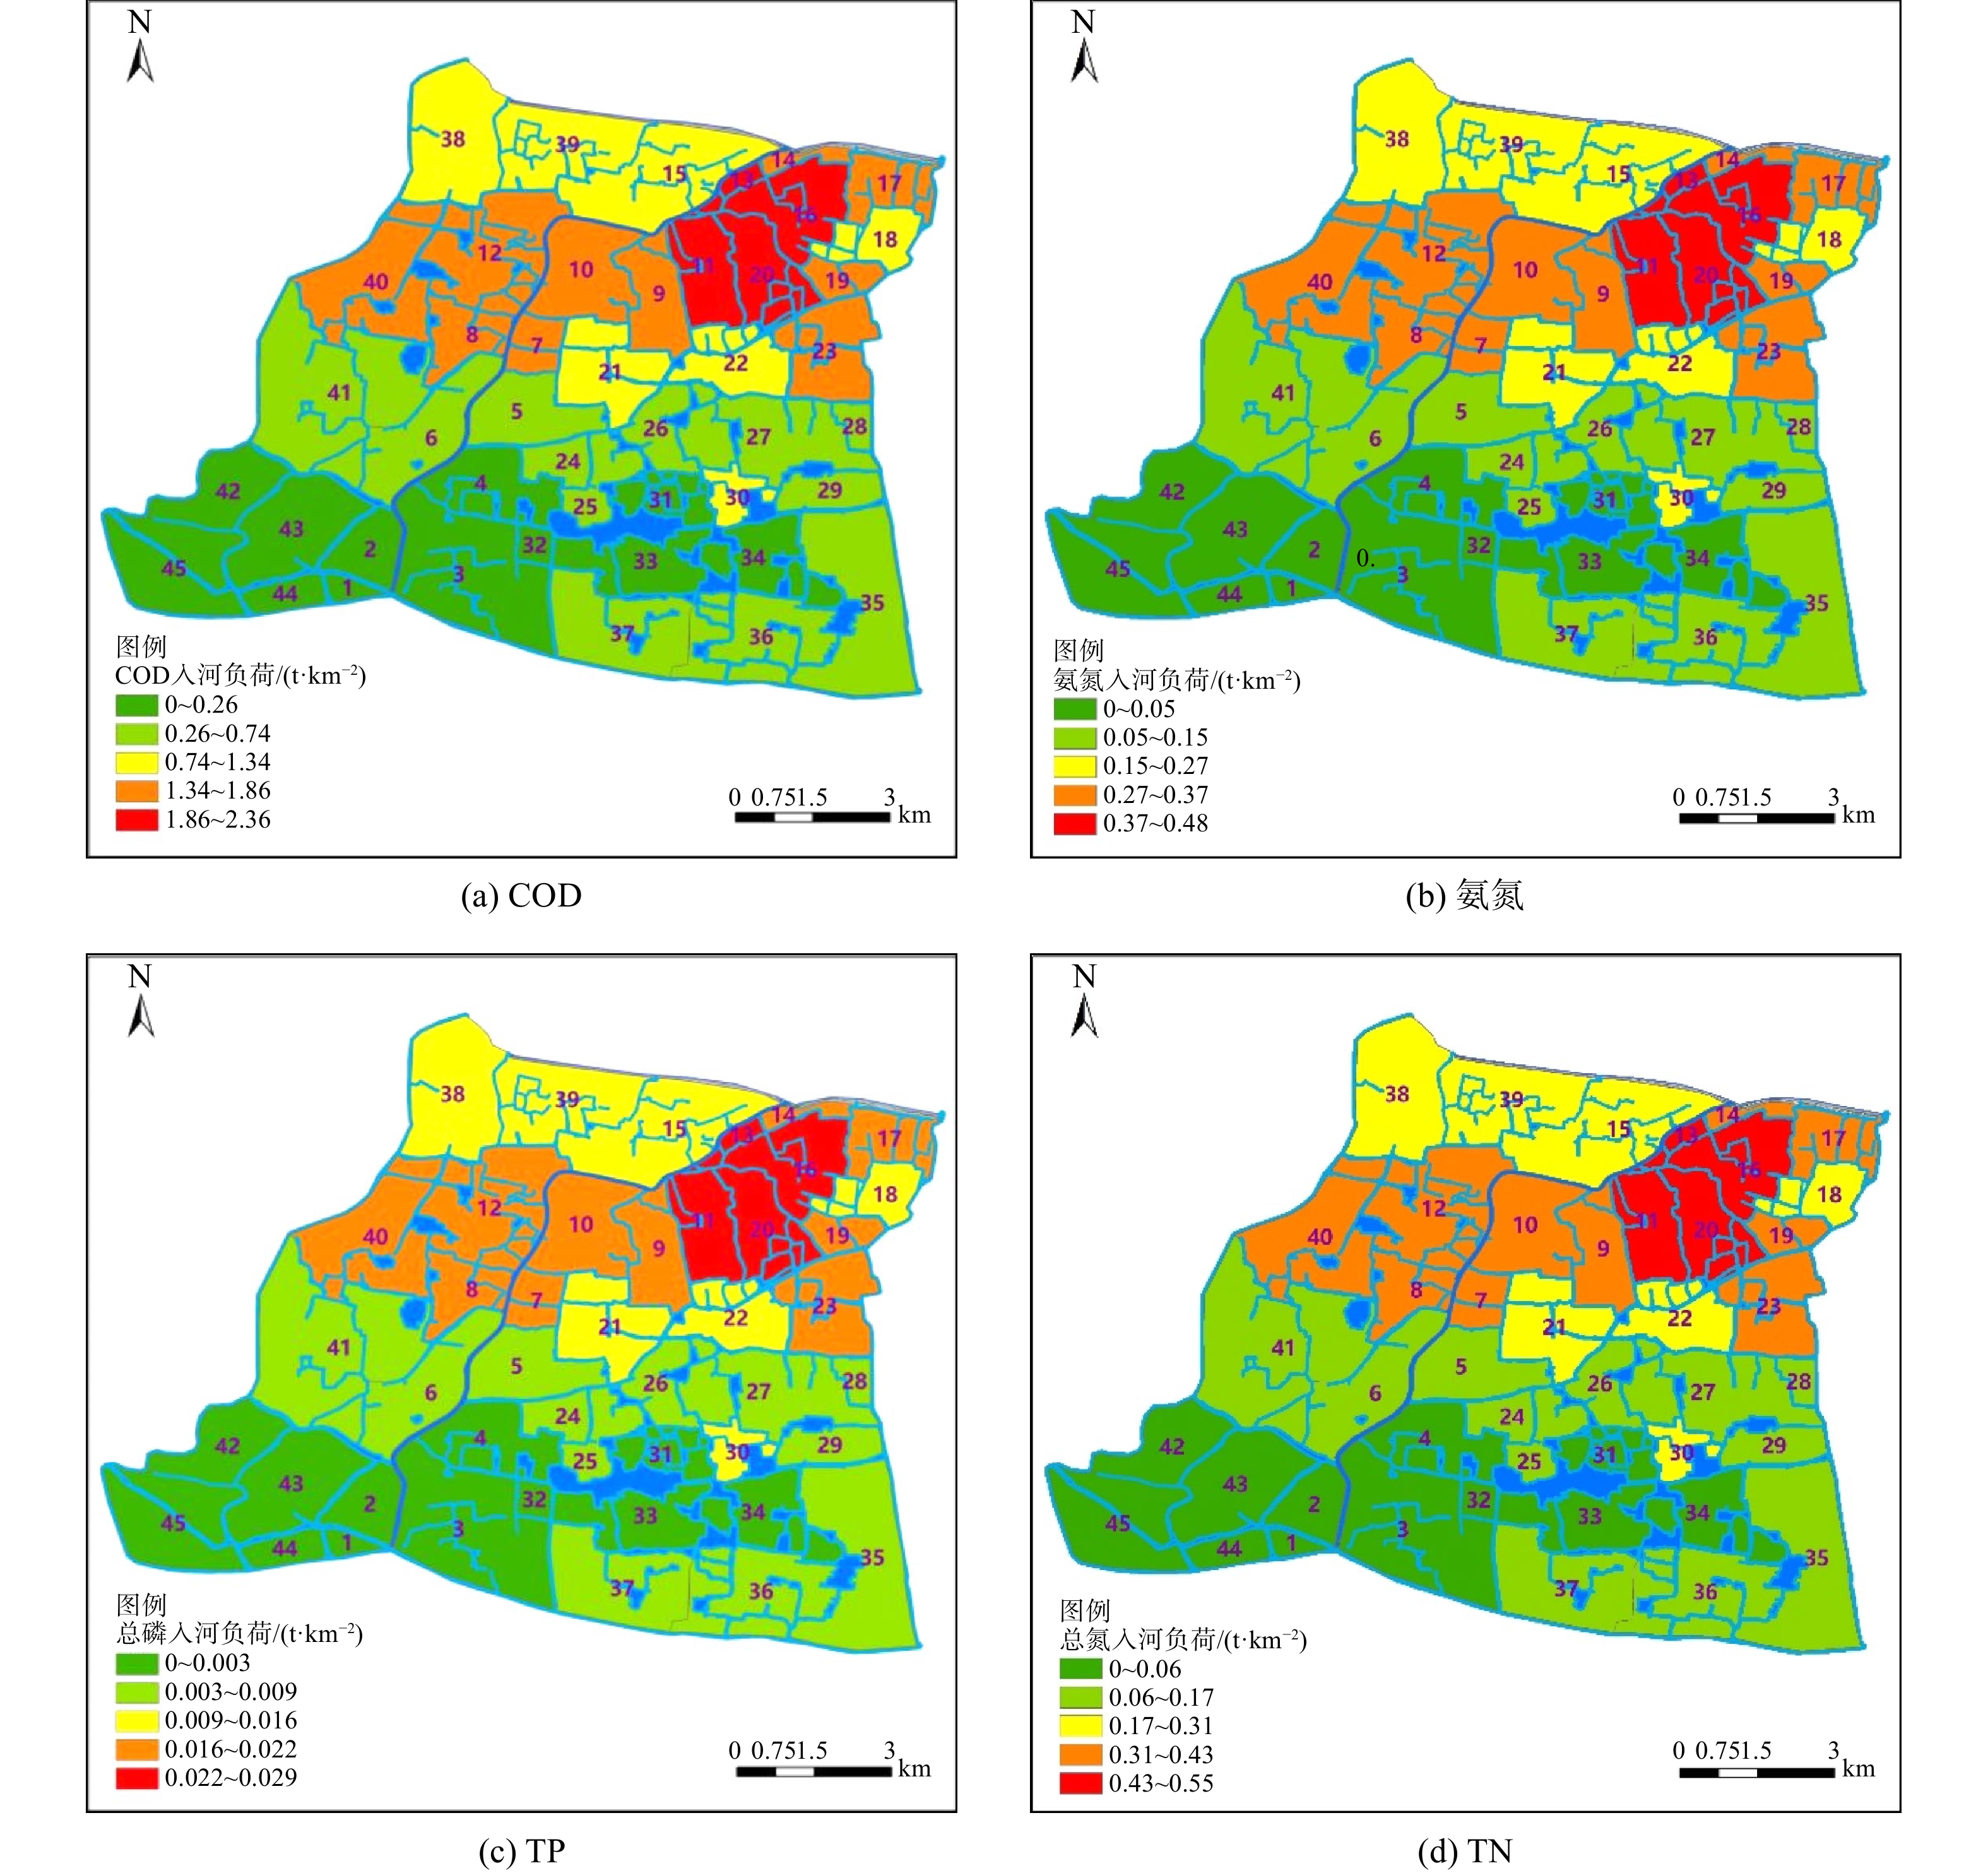
按照水文区,结合Arcgis软件将污染物排放负荷及入河负荷进行空间分析,其结果如图5所示。区域内中部和东北部面源污染排放负荷及入河负荷较高,其主要原因为该区域农业种植面积占比较多。
按照农田径流型和农村生活型污染源类别,对COD、氨氮、TN和TP指标等污染指标的排放量和入河量进行了统计分析(如表2所示)。结果表明,区域内面源污染主要来源于农田径流型污染,各污染指标分别占其区域总污染量的99.7%、99.6%、99.6%和99%。
-
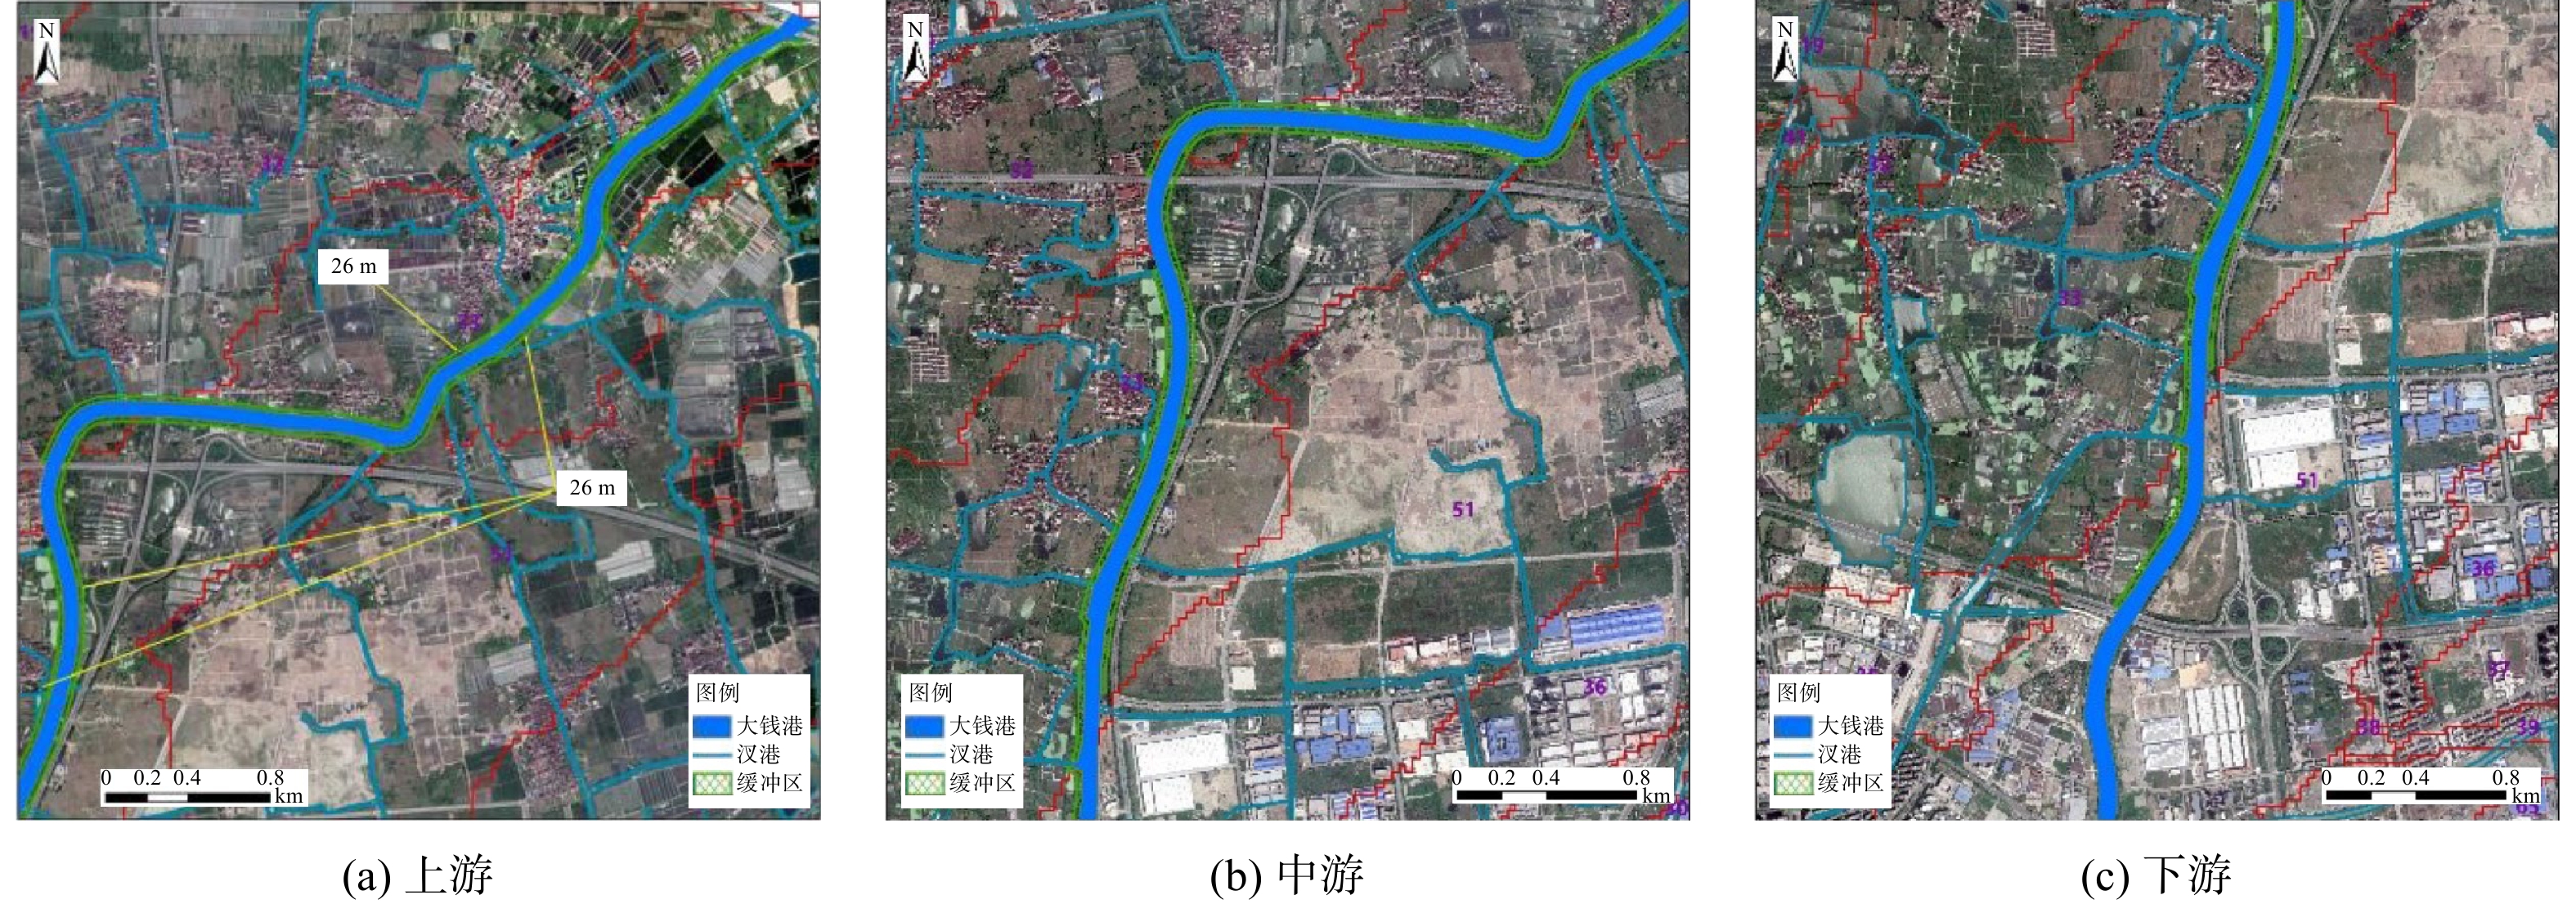
根据DEM坡度分析及土地利用解译结果,大钱港干流岸边带坡度约为2%,划分为城镇型河段、农田型河段、村落型河段3种类型。其中,左岸城镇型河段长度为4.6 km,农田型河段长度为6.0 km,村落型河段长度为2.3 km;右岸城镇型河段长度为4.7 km,农田型河段长度为8.2 km。结合河流河段划分,分别得出农田型河段、村落型河段的缓冲带宽度,其结果如表3所示。大钱港(干流)左岸划定生态缓冲带长度共约7.9 km,面积共约0.194 km2;右岸划定生态缓冲带长度共约8.2 km,面积共约0.214 km2。其中,农田型河段和村落型河段的生态缓冲带宽度分别为26 m和21 m。结合GIS对缓冲带划定结果可视化表达,其效果如图6所示。
-
本研究中的试点河段为唐家浒自然村汊港段,位于大钱港下游,长度约500 m,汊港沿岸常住居民约500户,无相关配套生活污水收集转运装置。通过对唐家浒自然村汊港段进行污染源分析可知,污染源主要为居民生活污水、周边农田废水、养虾等池塘养殖废水未经处理直接排入汊港,导致汊港河道水质浑浊并有腥臭气味。另外,沿河两岸边坡裸露,河道内及岸边生态系统破坏较严重。唐家浒自然村汊港段水环境及水生态均受到严重破坏。
针对唐家浒自然村汊港段的环境问题,在河流周边区域采取控源截污措施,避免生活污水、农田废水、养虾等池塘养殖废水等直接入河。在控源截污的基础上,对河道水生态及岸边带进行生态修复,从而达到增强河流生态功能、提升河流自净能力的目的。根据唐家浒两岸土地利用情况,按照文献[5]中生态缓冲带的划定原则,唐家浒自然村汊港段可划分为农田型河段和村落型河段,如图7所示。其中,农田型河段的长度约为50 m,村落型河段的长度约为450 m。从汊港常水位线往岸上延伸,构建缓冲带,阻控地表径流中的污染物进入河道。其中,农田型河段缓冲带宽度为26 m、村落型河段缓冲带宽度为21 m。具体构建方案如下。
1)村落型河段构建方案。唐家浒自然村汊港中的村落型河段主要特点为村民沿河两岸邻水而居,对此类型河段,重点从护岸改造、水生态系统构建2个方面进行生态修复。其中,护岸改造以天然土质护坡为主,在护岸原有植被的基础上,增加种植当地优势草本植物,如百慕大、百花三叶草、高羊茅、狗尾草、再力花等1种或多种植物。
河道水生态系统的构建包括植被系统和水生动物系统的构建。植物的配置从河道亲水区域向水体深处依次由挺水植物、浮叶植物、沉水植物。两岸亲水区域的挺水植物可选择当地优势草本植物,如芦苇、莲、梭鱼草、黄菖蒲、再力花等1种或多物种;河道中间搭配种植铜钱草等浮叶植物;沉水植物可选择苦草、黑藻、金鱼藻、眼子菜等1种或多物种。另外,在不满足种植挺水植物要求的区域,可采用木桩、仿木桩、砖砌、石砌、卵石等围护措施,设计和建造“种植平台”,并种植容易蔓延的挺水植物如芦苇、香蒲等。水生动物系统根据水体环境修复要求与鱼类生态学的特点,选取投放可操纵性强的滤食性鱼、蟹、螺、贝类等,这些水生动物可帮助清扫水草表面的悬浮物和通过食物链转移水体中的氮、磷营养物质。
2)农田型河段构建方案。唐家浒自然村汊港两岸为农田的河段,即农田型河段。农田型河段缓冲带由河岸向陆地方向延伸,其宽度不低于26 m。缓冲带内植被搭配选取种植当地优势植被物种,由河岸向陆地方向,按照“乔木+草本”组合搭配种植,植被种植宽度比例为3∶4。为了确保面源污染物去除效率的最大化,草本植物选取百慕大、百花三叶草、高羊茅、狗尾草、再力花等1种或多种,草本植株的间隔最小为40 cm;乔木选择江南桤木、水松、湿地松、腺柳、池杉、落羽杉、水杉、枫杨、垂柳等1种或多种,其间隔为5 m。建议在生态修复完成后,重点关注水生植物及缓冲带的维护与管理,其中包括植物的生长控制、植物残体的收获处理、植物病虫害防治、人为侵占破坏、定期垃圾清理等,以保证生态系统稳定健康运行。
-
1)大钱港干流左岸包含城镇型河段、农田型河段、村落型河段3种类型,划定缓冲带长度共约7.9 km,面积共约0.194 km2;右岸包含城镇型河段和农田型河段2种类型,划定缓冲带长度共约8.2 km,面积共约0.214 km2。
2)通过农业农村面源污染空间分析,筛选出高污染入河负荷区的唐家浒自然村汊港为缓冲带修复试点。针对该试点区域空间分布特点,确定河流河段类型为农田型及村落型河段,其缓冲带宽度分别为26 m和21 m。农田型缓冲带从河道常水位线往岸上延伸,可按照“乔木+草本”组合搭配种植,种植宽度比例为3:4;村落型缓冲带植物的配置从河道亲水区域向水体深处延伸,依次搭配种植如芦苇等挺水植物、铜钱草等浮叶植物、苦草等沉水植物。
湖州大钱港(溇港)河流生态缓冲带的划定与构建
Delineation and construction of riparian ecological buffer zone in Daqiangang ( Lougang ) of Huzhou, China
-
摘要: 河流生态缓冲带(后称“缓冲带”)对改善河流水环境、控制面源污染和水土流失等具有重要作用。如何确定缓冲带的宽度并对其进行合理构建,已成为学者与管理部门关注的热点之一。以浙江省湖州市平原河网型河流大钱港(溇港)为例,基于VFSMOD模型计算和地形坡度、水体流向、土地利用状况、降水条件、土壤类型等现状条件,确定了农田型河段、村落型河段、林草型河段的缓冲带宽度;针对城镇型河段,结合城市河道蓝线,确定了缓冲带的宽度。结果表明,大钱港干流左右岸缓冲带长度共约16.1 km,面积共约0.408 km2;同时,采用GIS对数据进行处理,并实现了缓冲带的可视化表达。结合农业农村面源污染负荷空间分析,筛选出高污染入河负荷区中的唐家浒自然村汊港段,并提出了缓冲带修复方案,以期为其他缓冲带划定与构建提供参考。Abstract: The riparian ecological buffer zone plays an important role in improving river water environment, controlling non-point source pollution and soil erosion. The delineation and construction of the riparian ecological buffer zone has been become a hot topic to many researchers and government regulators. This study took the river Daqiangang (Lougang) in Huzhou City, Zhejiang Province as an example for the buffer zone width determination of farmland-type river section, village-type river section, and forest-grass river section based on the current conditions such as terrain slope, water flow direction, land use status, precipitation conditions and soil types using VFSMOD model. The buffer zone width of the urban river section was determined according to the blue line of the urban river. Using GIS for data processing and visual expression, it was indicated that the length of the ecological buffer zone on the left and right banks of Daqiangang (Lougang) was about 16.1 km, and the total area was about 0.408 km2. The branch port section of Daqiangang near Tangjiahu Natural Village, as a high-pollution load area based on the spatial analysis of agricultural and rural non-point source pollution, was selected as a pilot for design of the buffer zone restoration plan, which would provide a reference for the delineation and construction of the ecological buffer zone of analogous rivers.
-

-
表 1 河流生态缓冲带的宽度参照值
Table 1. Reference values of river ecological buffer width
河流类型 坡度/% 一般河流
最小宽度/m特殊河流
最小宽度/m堤防型河段 — 5 ~ 10 5 ~ 10 城镇型河段 — 城市河道蓝线 城市河道蓝线 农田型河段 1 25 45 农田型河段 3.5 30 60 农田型河段 9 35 80 农田型河段 30 70 125 村落型河段 1 20 35 村落型河段 3.5 25 45 村落型河段 9 30 60 村落型河段 30 70 120 林草型河段 — 15 15 注:堤防型河段的最小宽度参照水利部门河道管理范围5~
10 m;城镇型河段的最小宽度按城市河道蓝线划定范围确定。表 2 大钱港区域不同污染类型面源污染排放统计列表
Table 2. Statistics list of non-point source pollution emissions of different types of pollution in Daqian Harbor
t·a−1 污染
类型COD 氨氮 TP TN 排放量 入河量 排放量 入河量 排放量 入河量 排放量 入河量 农田径
流型547 109 109 22 7 1 126 25 农村生
活型1.8 0.36 0.44 0.09 0.05 0.01 0.55 0.11 合计 548.8 109.36 109.44 22.09 7.05 1.01 126.55 25.11 表 3 大钱港(干流)两岸缓冲带统计结果
Table 3. Characteristics of the buffer zone on both sides of the Daqian Harbor (main stream)
河流河段
类型左岸缓冲带 右岸缓冲带 宽度/m 长度/km 宽度/m 长度/km 城镇型 — 4.6 — 4.7 农田型 26 6.0 26 8.2 村落型 21 2.3 — — 合计 — 12.9 — 12.9 -
[1] YAN R H, LI L L, GAO J F. Framework for quantifying rural NPS pollution of a humid catchment in Taihu Basin. Eastern China[J]. Science of the Total Environment, 2019, 688: 983-993. [2] LOU H Z, YANG S T, HAO F H, et al. Evolution and driving forces of non-point source pollution in a developing megacity: Beijing as a longterm case study[J]. Polish Journal of Environmental Studies, 2020, 29(1): 763-777. [3] LOU H Z, YANG S T, ZHAO C S, et al. Detecting and analyzing soil phosphorus loss associated with critical source areas using a remote sensing approach[J]. Science of the Total Environment, 2016, 573: 397-408. [4] 杜鹃, 王乐宜, 周皓媛, 等. 农业面源污染时空分布及污染源解析: 以安徽怀远县为例[J]. 中国农业大学学报, 2021, 26(2): 139-149. doi: 10.11841/j.issn.1007-4333.2021.02.16 [5] 袁鹏, 刘瑞霞, 俞洁, 等. 《浙江省河流生态缓冲带划定与生态修复技术指南(试行)》解读[J]. 环境工程技术学报, 2021, 11(1): 1-5. doi: 10.12153/j.issn.1674-991X.20210003 [6] 刘赢男, 杨帆, 韩辉, 等. 阿什河流域河岸植被缓冲带宽度规划[J]. 国土与自然资源研究, 2018(6): 46-48. doi: 10.3969/j.issn.1003-7853.2018.06.011 [7] MUNOZ-CARPENA R, ZAJAC Z, KUO Y M. Global sensitivity and uncertainty analyses of the water quality model VFSMOD-W[J]. Transactions of the ASABE, 2007, 50(5): 1719-1732. doi: 10.13031/2013.23967 [8] CHEN H, GRIENEISEN M L, ZHANG M. Predicting pesticide removal efficacy of vegetated filter strips: A meta-regression analysis[J]. Science of the Total Environment, 2016, 548-549: 122-130. doi: 10.1016/j.scitotenv.2016.01.041 [9] MAJED A Z, RAMESH P R, MANON N L, et al. Experimental investigation of runoff reduction and sediment removal by vegetated filter strips[J]. Hydrological Processes, 2004, 18(11): 2029-2037. doi: 10.1002/hyp.1400 [10] DORIOZ J M, WANG D, POULENARD J, et al. The effect of grass buffer strips on phosphorus dynamics: A critical review and synthesis as a basis for application in agricultural landscapes in France[J]. Agriculture, Ecosystems & Environment, 2006, 117(1): 4-21. [11] CHAUBEY I, EDWARDS D R, DANIEL T C, et al. Effectiveness of vegetative filter strips in controlling losses of surface-applied poultry litter constituents[J]. Transactions of the ASAE, 1995, 38(6): 1687-1692. doi: 10.13031/2013.27995 [12] 付婧, 王云琦, 马超, 等. 植被缓冲带对农业面源污染物的削减效益研究进展[J]. 水土保持学报, 2019, 33(2): 1-8. [13] 左俊杰, 蔡永立. 平原河网地区汇水区的划分方法: 以上海市为例[J]. 水科学进展, 2011, 22(3): 337-343. [14] JOHN N C, KIMBERLY P V N, GUY S B. How does modifying a DEM to reflect known hydrology affect subsequent terrain analysis?[J]. Joumal of Hydrology, 2007, 332: 30-39. doi: 10.1016/j.jhydrol.2006.06.020 [15] QUINN P, REVEN K, CHEVALLIER P, et al. The prediction of hillslope flow paths for distributed hydrological modelling using digital terrain models[J]. Hydrological Processes, 1999, 5: 59-79. [16] TURCOTTE R, FORTIN J P, ROUSSEAU A N, et al. Determination of the drainage structure of a watershed using a digital elevation model and a digital river and lake network[J]. Journal of Hydrology, 2001, 240: 225-242. doi: 10.1016/S0022-1694(00)00342-5 [17] 姜峰, 江苏省农业面源污染时空特征及削减方案研究[D]. 南京: 南京农业大学, 2012. [18] ONGLEY E D, ZHANG X L, TAO Y, Current status of agricultural and rural non-point source Pollution assessment in China[J]. Environmental Pollution, 2020, 158(5): 1159-1168. [19] 刘洋, 李丽娟, 李九一. 面向区域管理的非点源污染负荷估算: 以浙江省嵊州市为例[J]. 环境科学学报, 2021, 41(10): 3938-3946. [20] 吕永鹏. 平原河网地区城市集水区非点源污染过程模拟与系统调控管理研究[D]. 上海: 华东师范大学, 2011. -


 下载:
下载:
