-
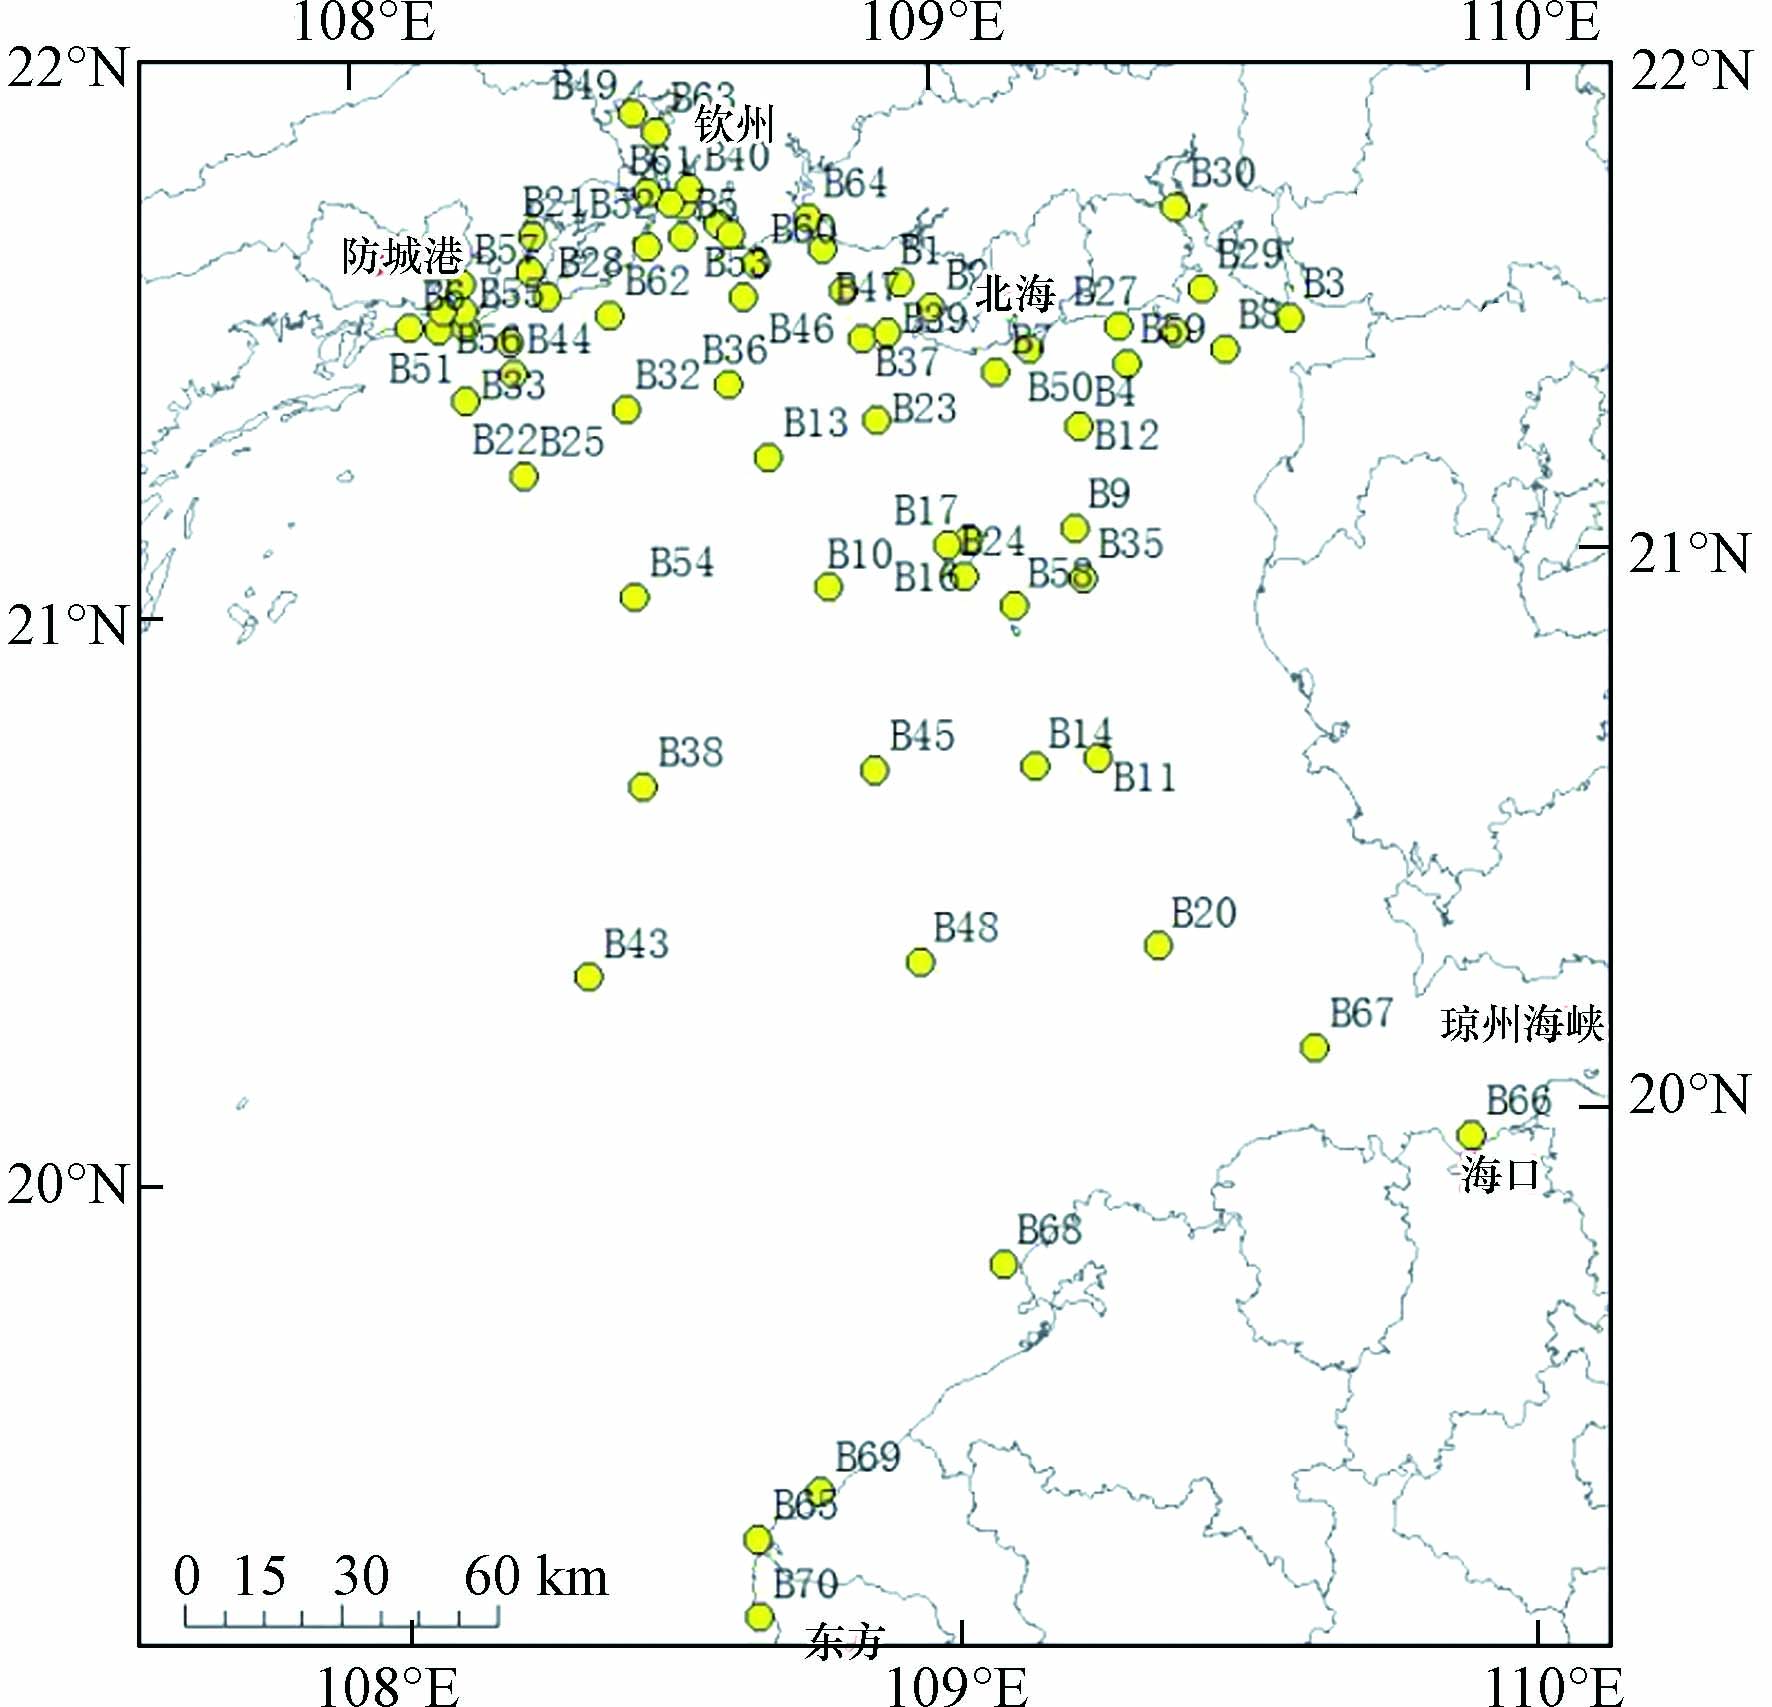
图 1 采样点位分布
Figure 1. Sampling points distribution
-
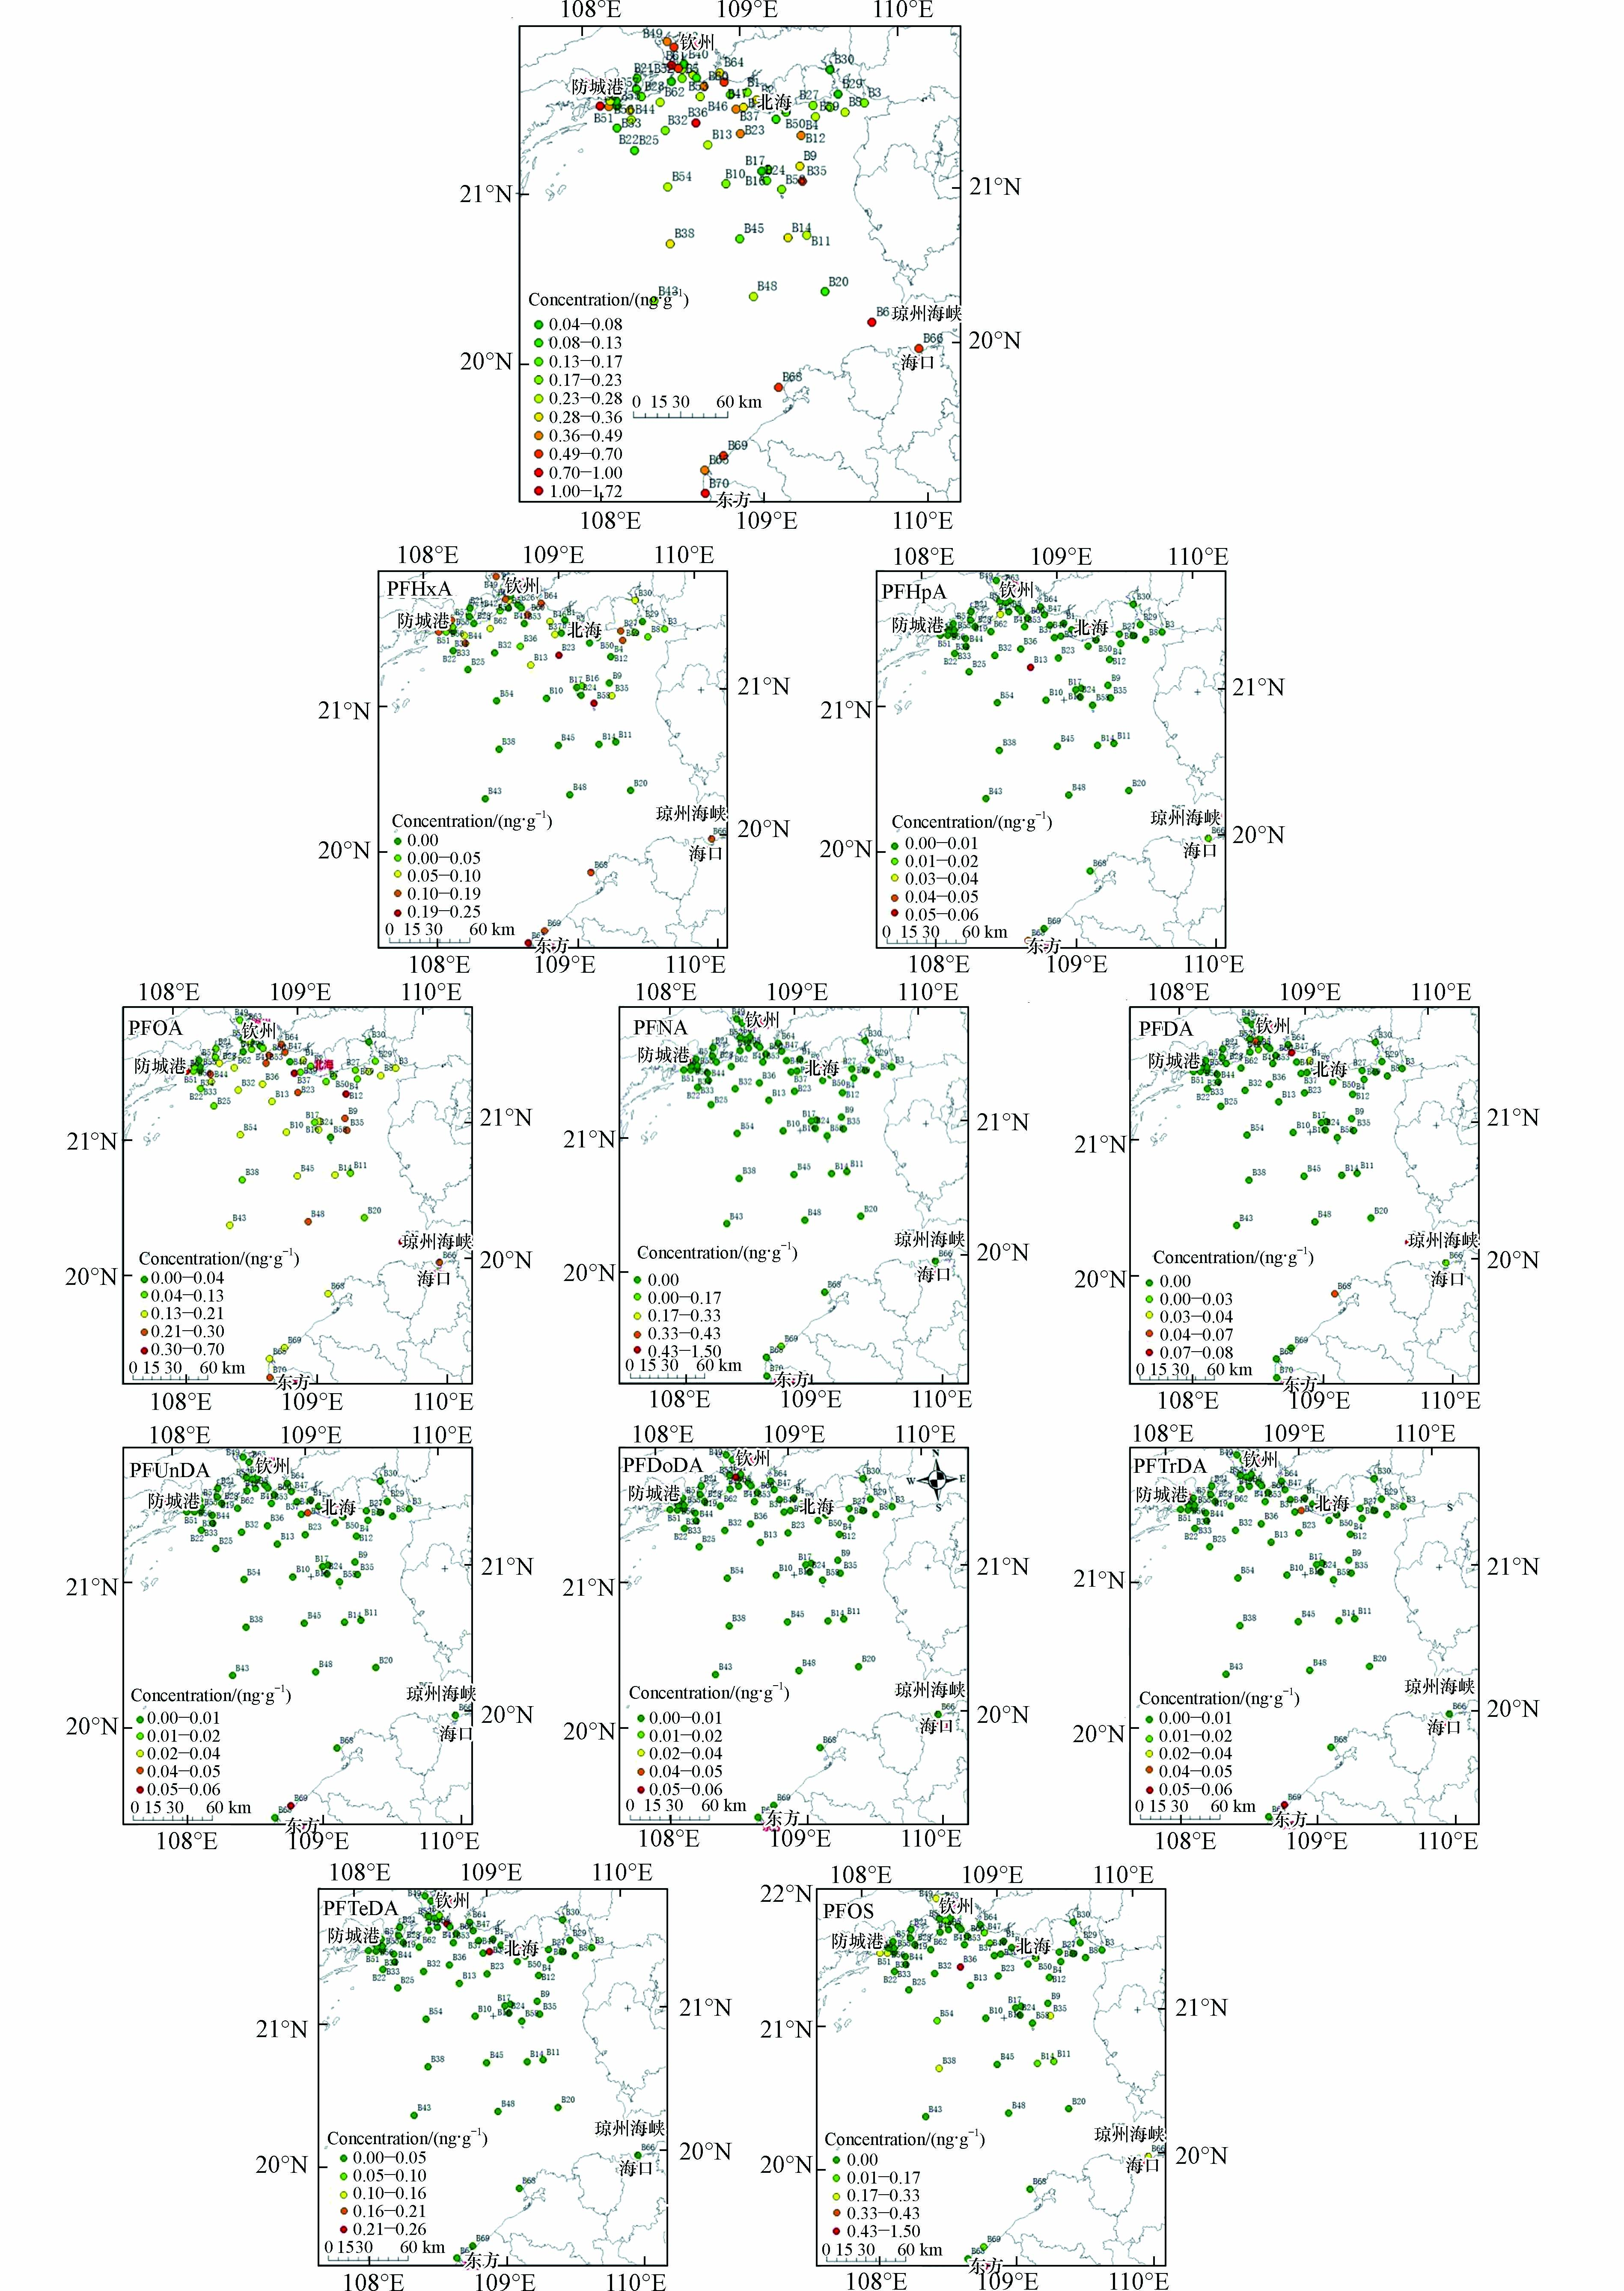
图 2 采样点位∑PFASs浓度分布
Figure 2. Concentration distribution of ∑PFASs of sampling points
-
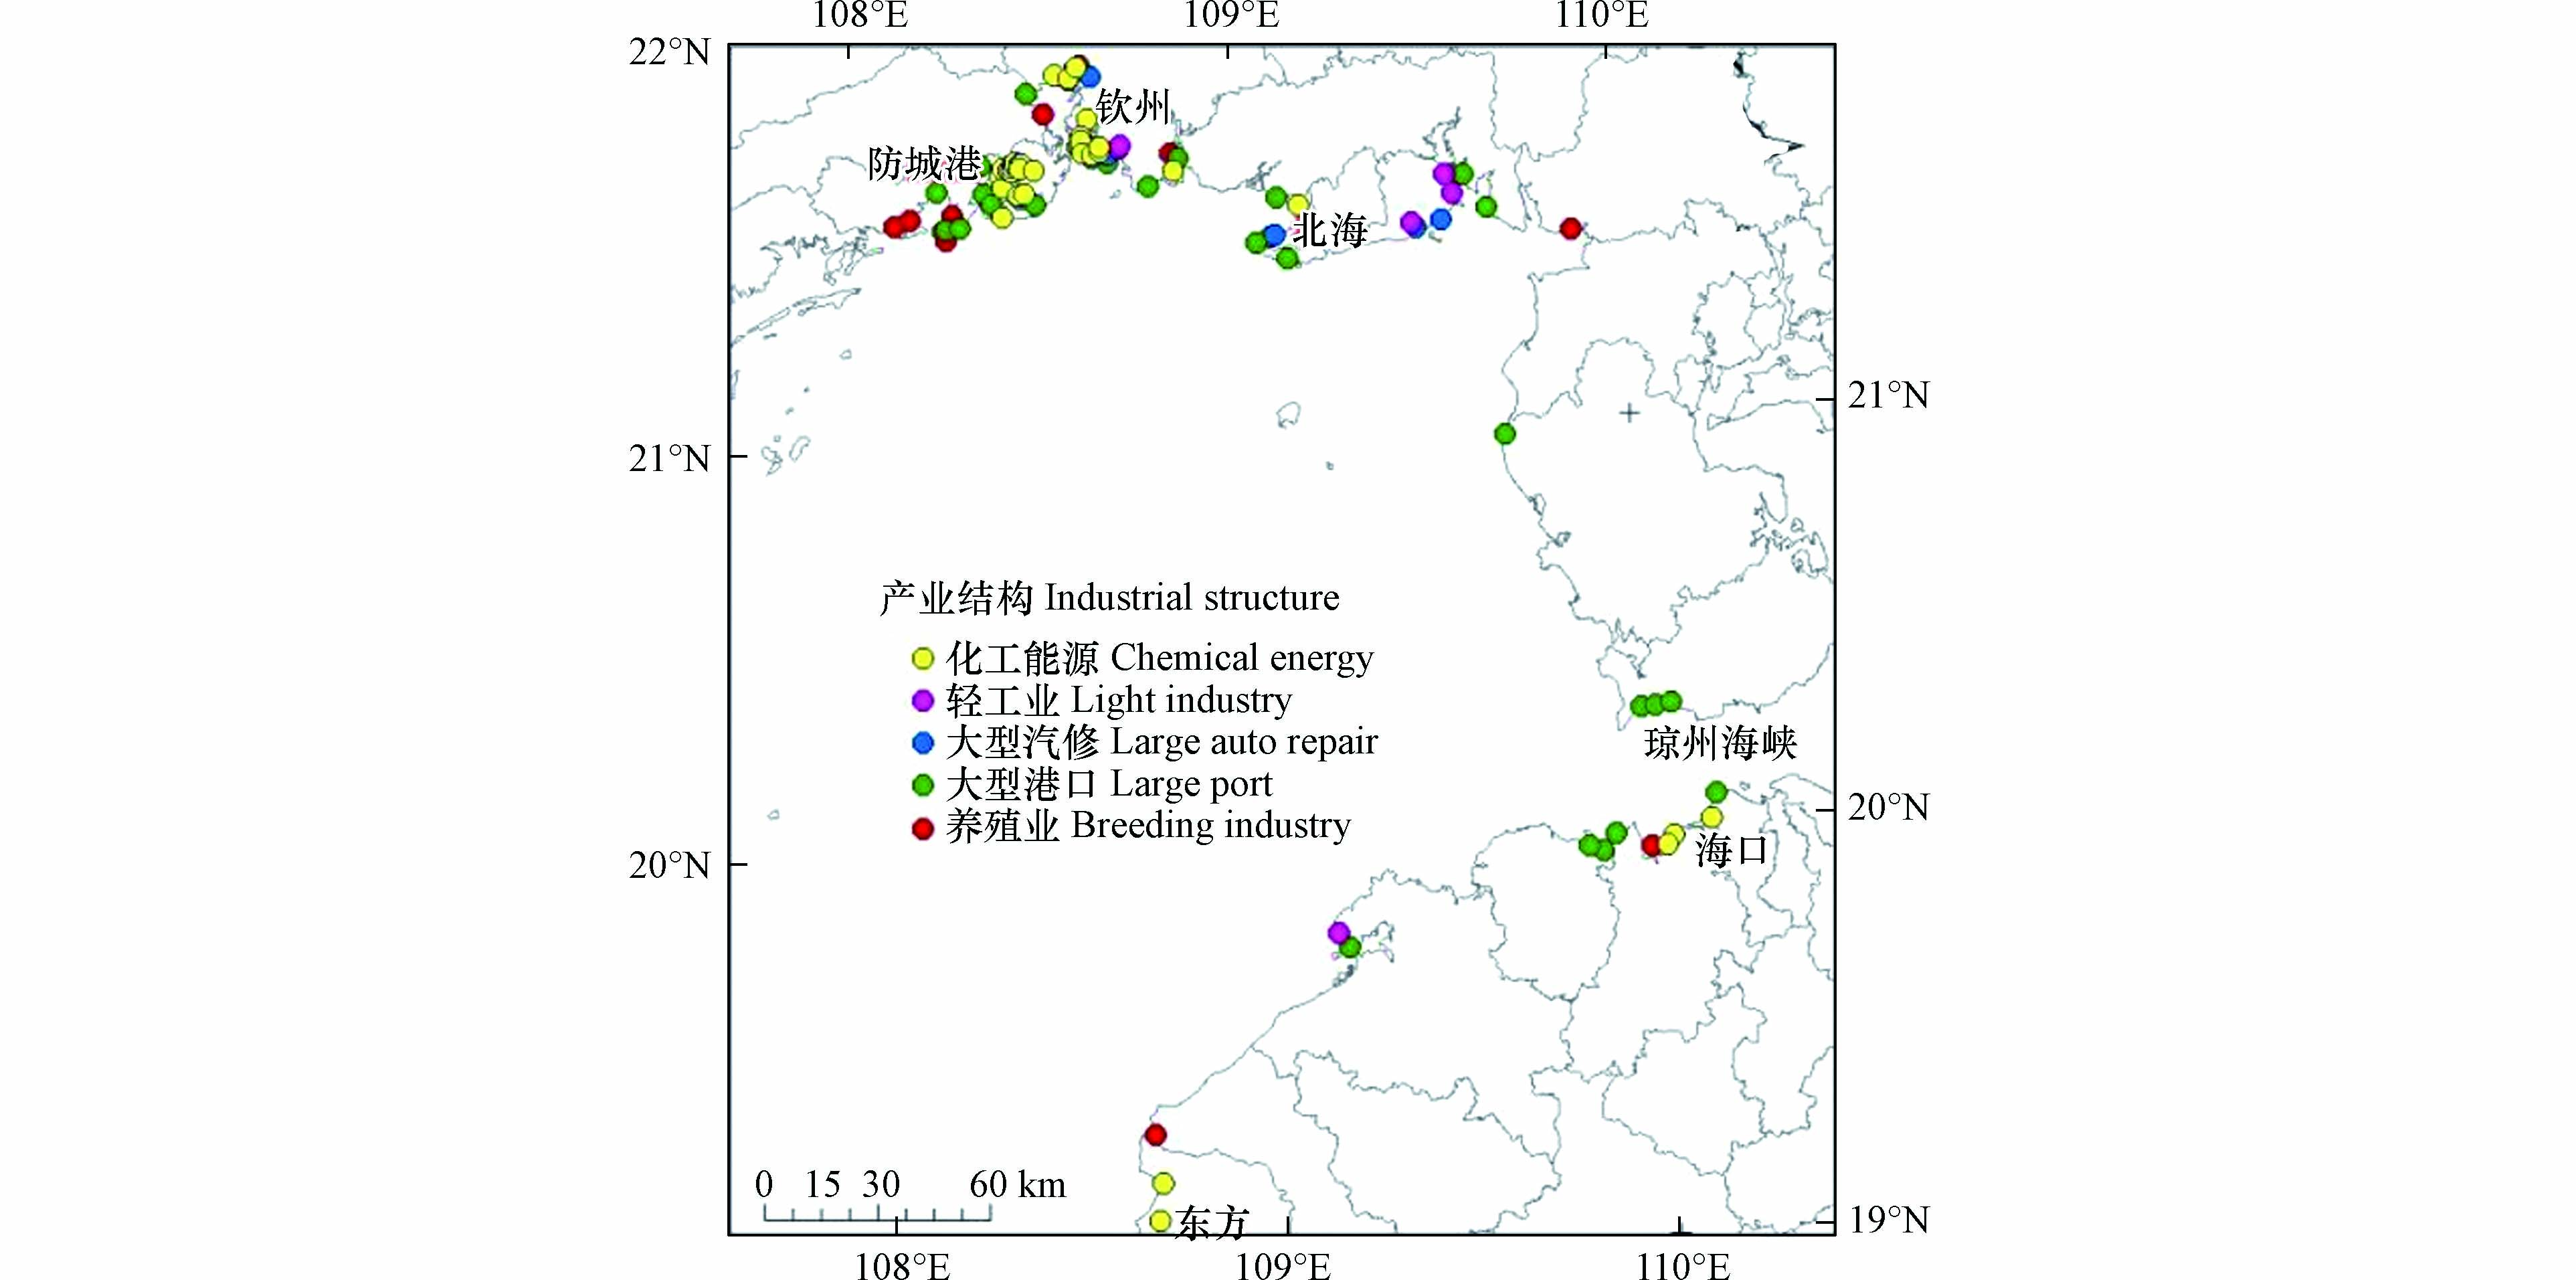
图 3 北部湾区域主要产业结构
Figure 3. Main industrial structure of Beibu Gulf
-
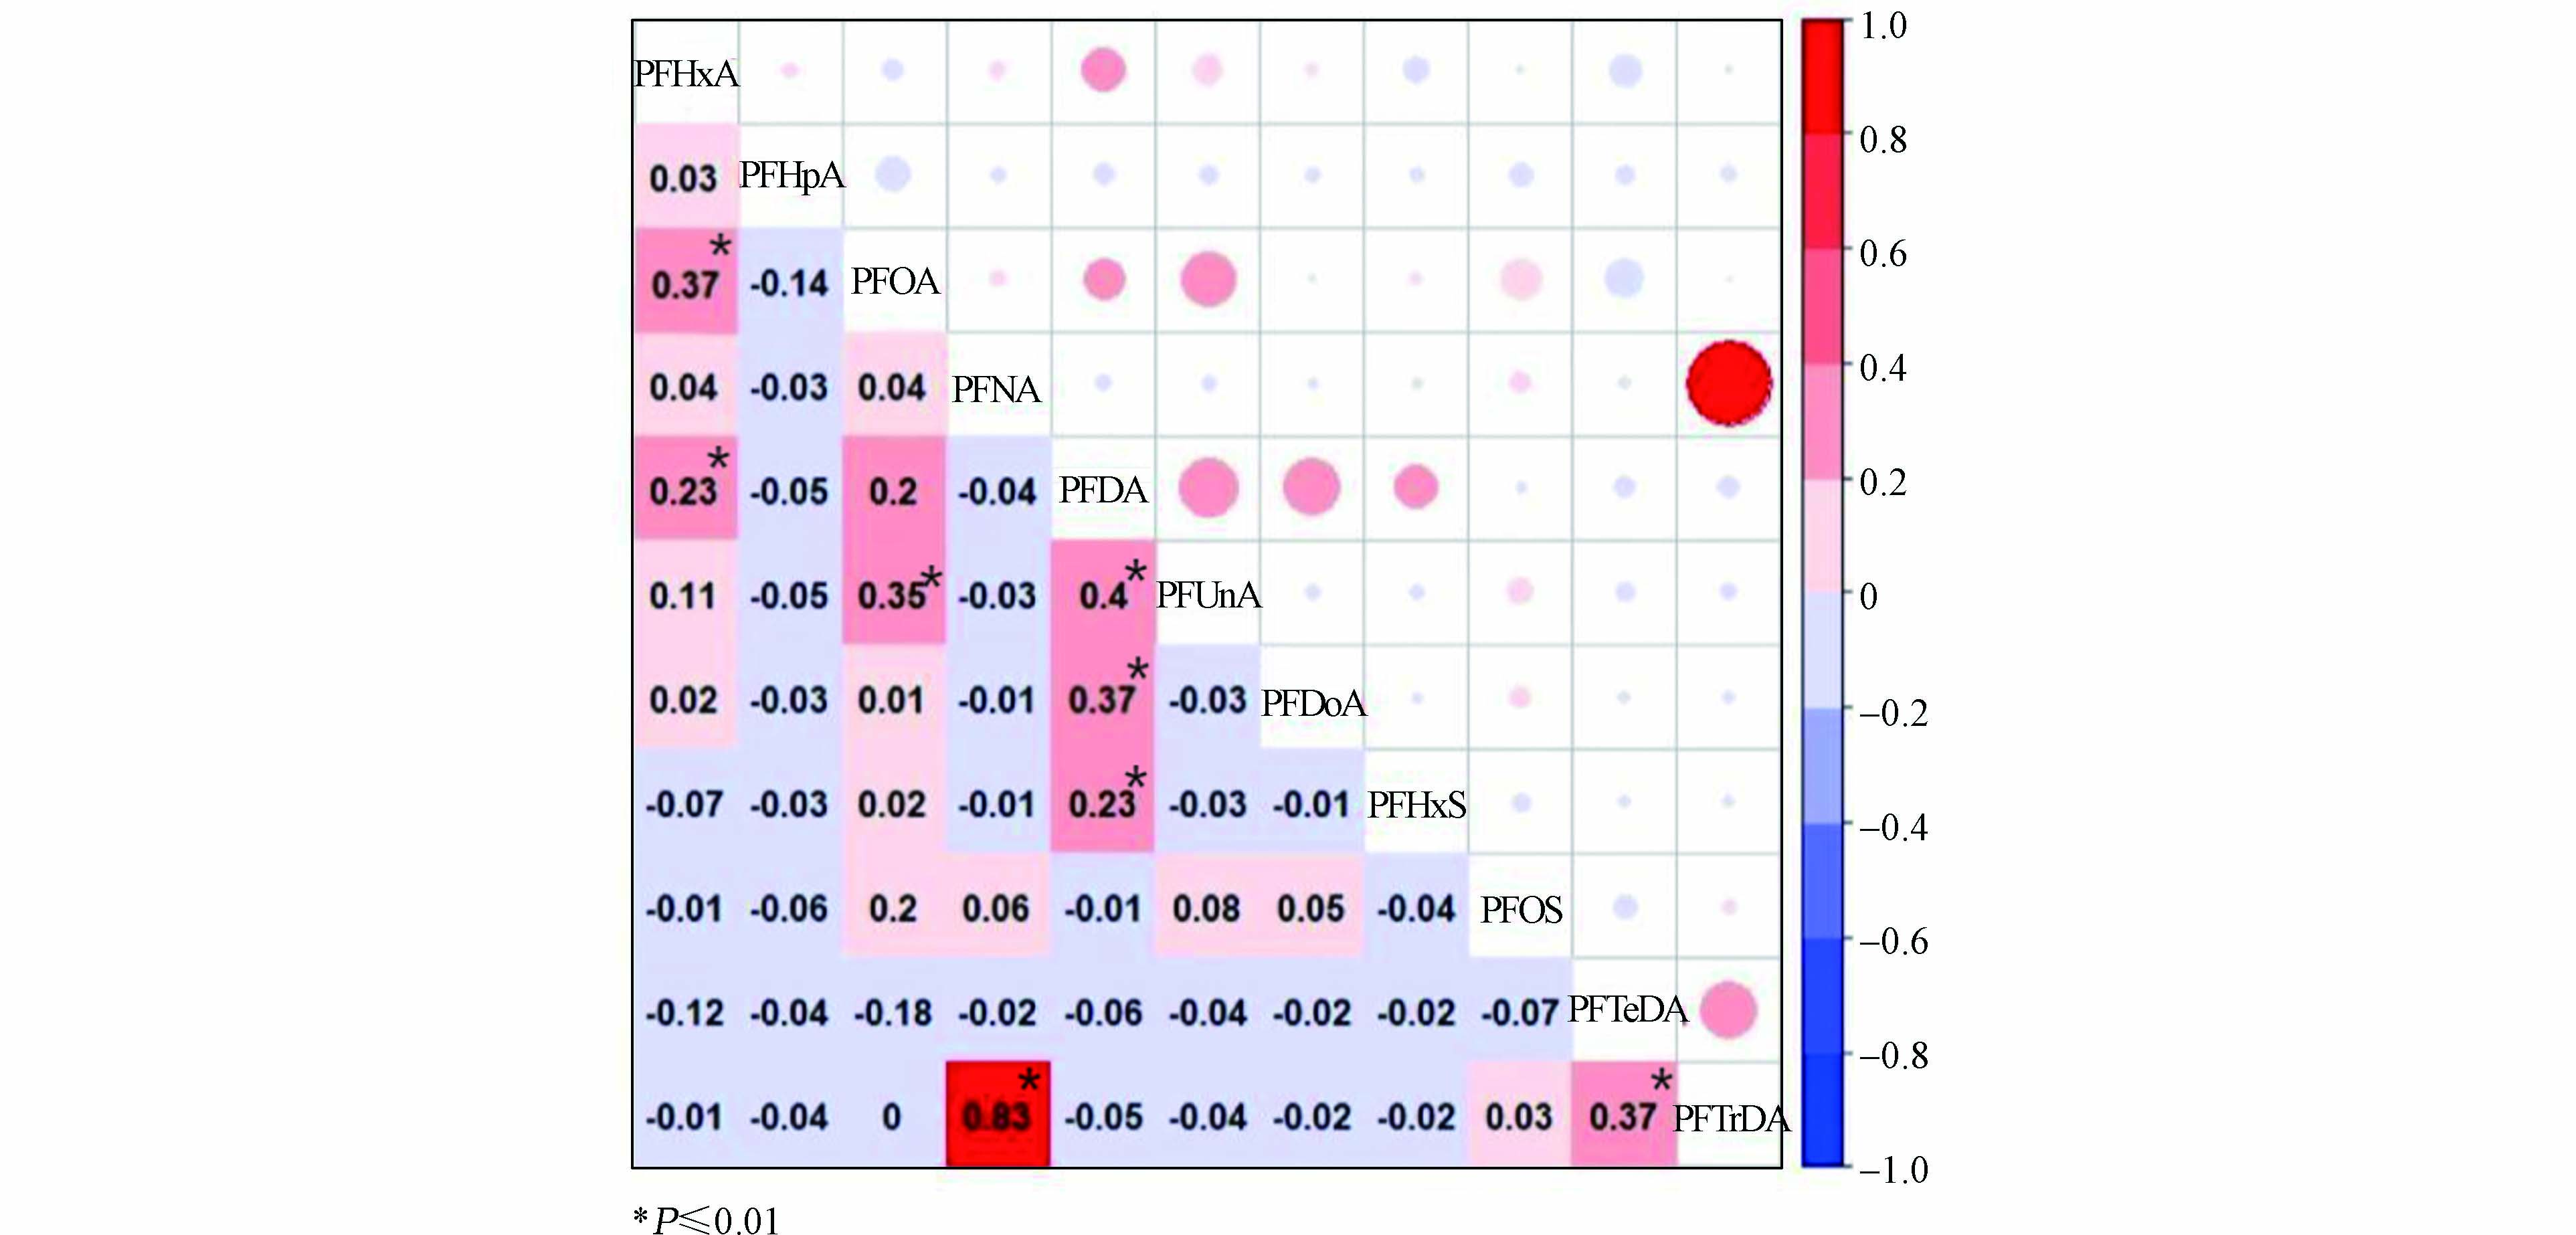
图 4 各PFASs单体之间相关性分析
Figure 4. Correlation analysis between PFASs monomers
-
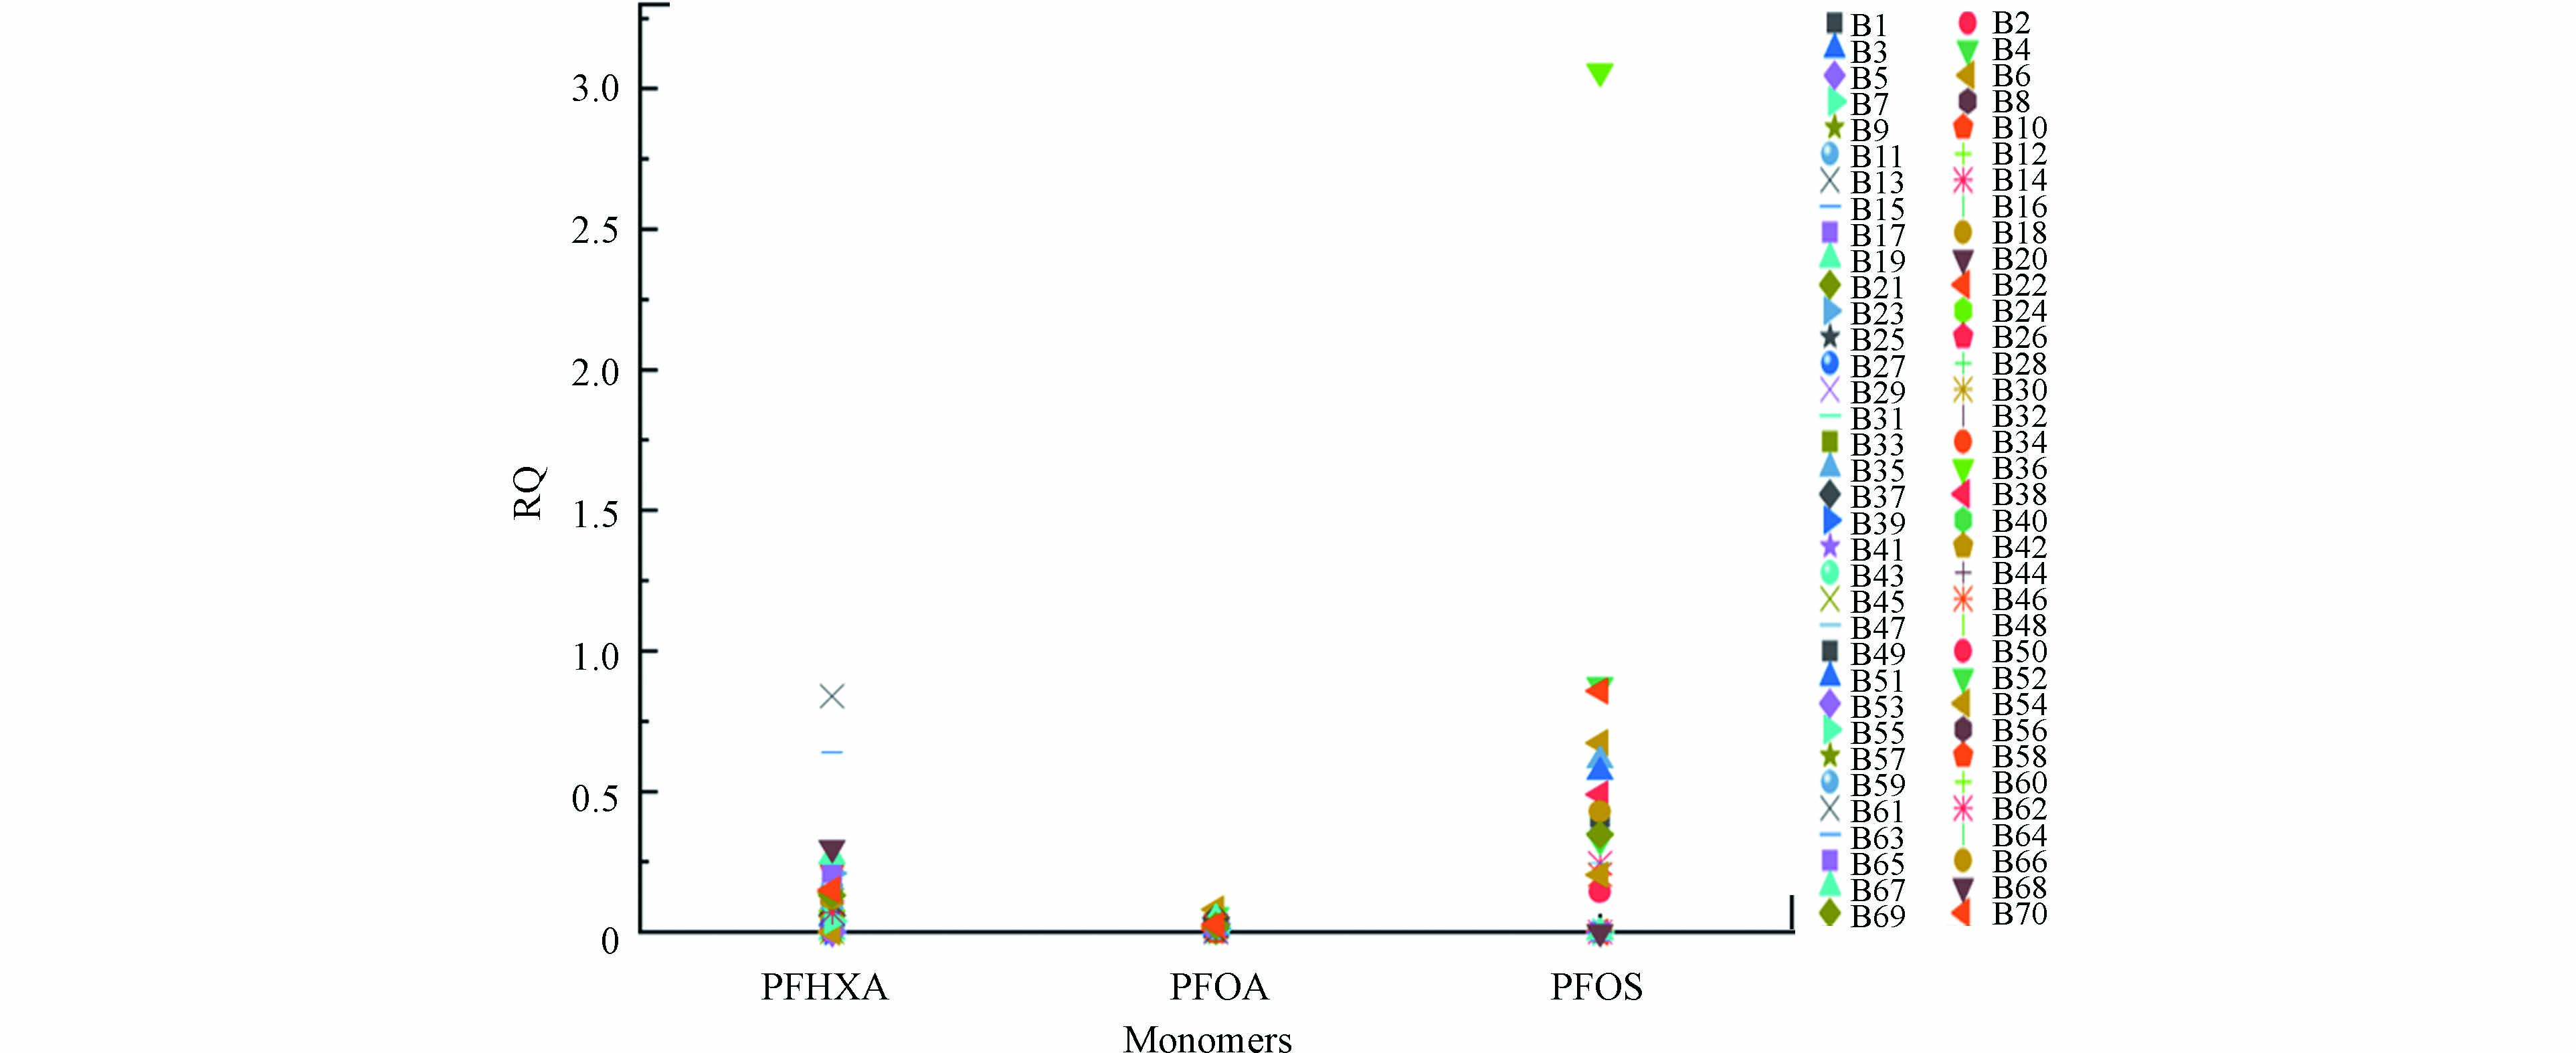
图 5 北部湾海域沉积物中PFOA、PFHxA及PFOS的风险熵(RQ)
Figure 5. Risk Entropy (RQ) of PFOA 、PFHxA and PFOS in coastal sediments of the Beibu Gulf
Figure
5 ,Table
4 个