-
随着极端降雨和人类活动的影响,流域水环境治理面临新的挑战[1]。近年来白龙江流域推进水资源管理和生态修复,不断强化水污染治理,白龙江水质有所改善。作为嘉陵江一级支流,长江二级支流的白龙江位于长江水系上游,地处生态脆弱带和敏感区,泥石流、滑坡等地质灾害频发,水土流失严重,水环境系统极易破坏[2-4]。在社会经济快速发展和水环境治理背景下,统筹考虑点源污染和非点源污染对河流水质的共同影响,确保流域水环境得到长期有效治理是白龙江流域生态文明建设的迫切需求。
近年来国内外许多学者在流域水质模拟和水环境治理方面做了大量研究[5-13],如利用WASP模型、QUAL2K模型、输出系数模型等分析流域主要污染源、估算污染负荷、模拟分析面源污染对河流水质的影响等。易绍荣等[14]通过SWAT模型估算污染物入河负荷,分析污染物负荷空间分布特征,识别了重污染区域和关键污染源,提出了水环境保护措施。黄宏等[15]基于Monte Carlo模拟河流水质,利用水质监测数据定量分析各个断面水质健康状况,评价各个水质指标对水体污染的影响程度,得出影响因子主要为TN、NH4+-N和DO。戴君等[16]以松花江哈尔滨段为研究对象,构建EFDC水动力-水质模型,以COD、NH4+-N为主要污染物,结合情景分析方法对松花江哈尔滨段支流污染负荷多情景变化下对干流水质及下游出口断面水质进行量化评估,确定了不同水文情景下污染物最大浓度。
在流域水环境模拟中,应准确分析流域内点源污染和面源污染的时空分布特征和负荷大小,保证模拟结果可靠性[17-20]。但目前大多数研究只考虑非点源污染入河负荷,忽视了农村生活垃圾、城镇生活污水等点源污染入河负荷,导致模型参数率定困难、模拟精度低,且河流水质模拟过程中未能考虑水体中硝化、反硝化、污染物吸附沉积等因素,难以准确模拟河流水质沿程变化情况和污染物时空迁移特征。为此,本次研究通过耦合模型分别计算面源污染和点源污染负荷,在污染源分类调查的基础上,模拟计算各污染物入河负荷,并分析各污染负荷时空分布特征,模拟各污染物在随水体迁移转化过程,探讨白龙江流域甘肃段水污染风险,为流域水环境治理规划提供借鉴。
-
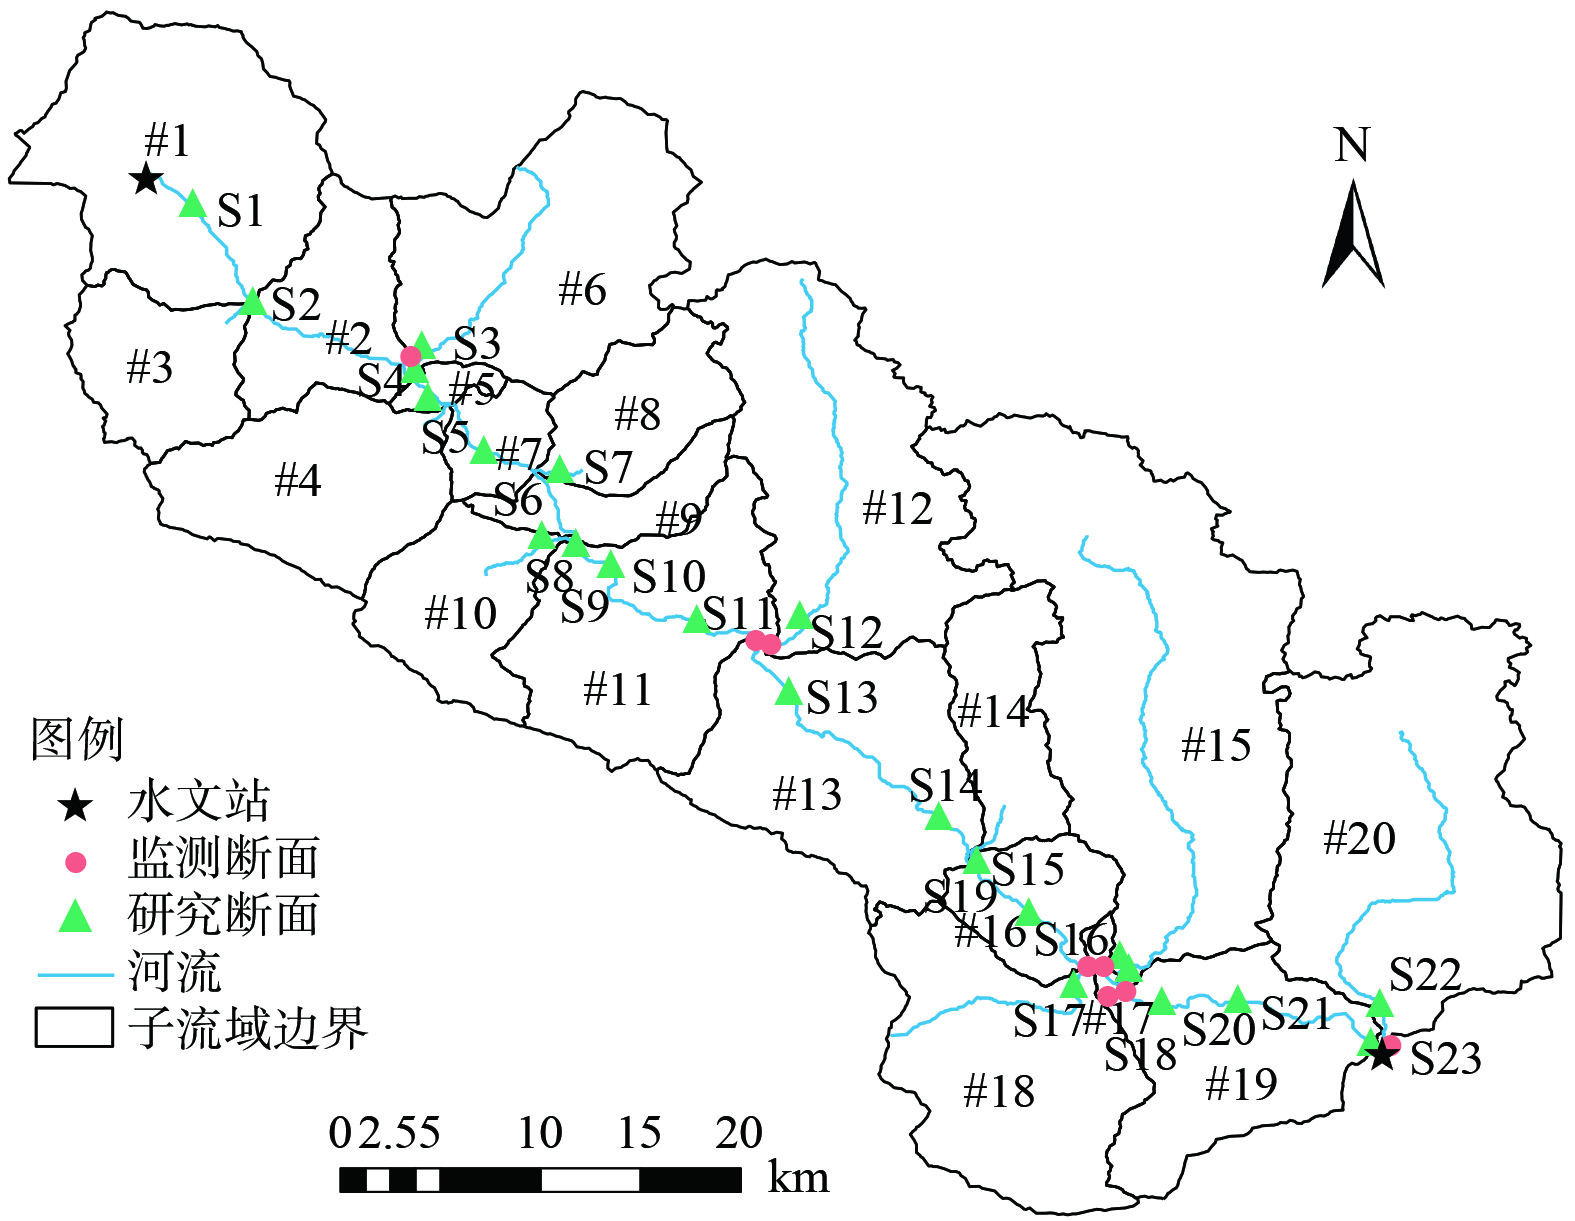
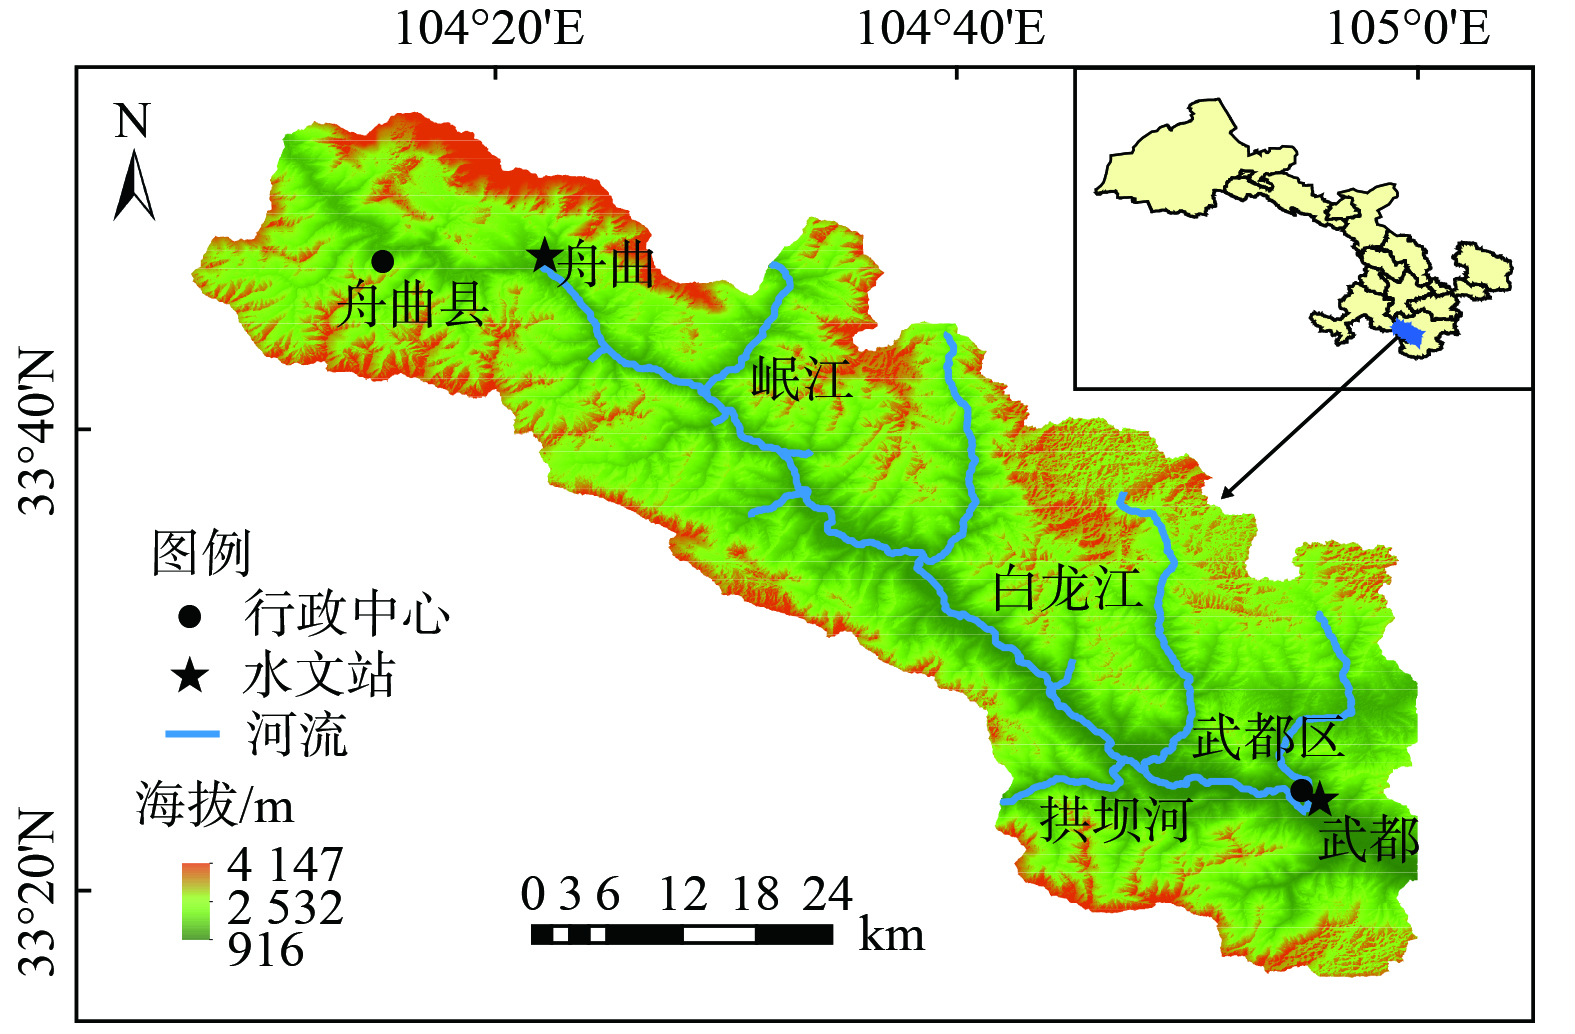
白龙江是嘉陵江支流,发源于甘肃省和四川省交界,流经甘肃南部迭部、舟曲、宕昌等县,最后在四川省广元市注入嘉陵江。本次研究流域处于甘肃省南部,地处东经102°30'~105°40',北纬32°20'~34°10'间,年平均气温2~14 ℃,降雨量500~800 mm之间,汛期为5月份至10月份,非汛期为11月份至次年4月份。本次研究选取白龙江甘肃段舟曲水文站到武都水文站整个流域作为研究区域,研究区总面积20.27×10⁴ hm2,白龙江在区域内总长91.47 km,研究区内有岷江和拱坝河2条支流汇入白龙江,具体地理位置如图1所示。根据《甘肃省第七次全国人口普查公报》显示,研究区域常住总人口12.54×10⁴人。流域内地形复杂,山地丘陵纵横,地势西北高、东南地低,水流自西向东流动。白龙江先后经过舟曲县城和陇南市武都区,另有岷江和拱坝河水流汇入白龙江。流域内主要土地利用类型为林地、耕地、种植园用地和居住用地。
-
针对改进输出系数模型收集建模所需数据,包括污染源调查数据、人口数据、DEM数字高程数据、土地利用数据和降雨数据。InfoWorks ICM河流水动力水质模型搭建需要水质数据、河道断面数据和水文情景数据。
1) 污染源调查:研究区内工厂企业共4家,其中制药企业1家、土特产加工厂2家、水泥厂1家;制药废水和土特产加工厂废水经简单处理达标后汇入污水管网由污水处理厂集中处理,水泥厂废水经简单处理后直接排放。污染源调查结果表明,研究区2021年工业废水排放总量为COD排放16.72 t,NH4+-N排放1.75 t,TN排放2.87 t,TP排放0.97 t,其中土特产加工厂废水排放量最大。研究区内城镇生活污水均经排水管网至污水厂处理达标排放,出水水质达到《城镇污水处理厂污染物排放标准(GB18918-2002)》一级A污水排放标准。农村生活污水均为直接排放或简单处理后排放。研究区内城镇生活垃圾已基本实现统一收集、转运和处理,而农村生活垃圾尚未实现统一处理,存在污染物扩散至周围水体的情况。研究区内畜禽养殖均为分散养殖,畜禽粪污多用于农田施肥,经降雨冲刷后能够进入河道水体。
2) 人口和土地利用数据:采用中国科学院资源环境科学与数据中心网站提供的中国人口空间分布公里网格数据集和中国土地利用遥感监测数据集 (CNLUCC) ,分辨率均为1 km。
3) DEM数字高程数据:采用地理空间数据云30 m分辨率的GDEMV3数据,由ArcGIS10.8软件做空间分析处理后使用。
4) 水质数据:为提供模型率定验证的必要参数,在水文站现有数据基础上,项目组与2022年6月至2023年6月通过监测设备监测9个重点断面水质参数,监测断面见图2,监测频次为每日1次,主要监测指标为水温、流量、泥沙粒径和比重、DO、COD、NH4+-N、TN和TP,监测分析方法按照《废水监测分析方法》进行。
5) 水文情景选取:由于降雨分布多服从P-Ⅲ型概率分布,利用长时间降雨序列,采用频率分析法是划分丰、平、枯水年的常用方法[14]。本次研究以舟曲水文站近50年日降雨数据为基础,分析并确定了典型水平年,流域丰水年 (P=25%) 、平水年 (P=50%) 与枯水年 (P=75%) 对应的典型年份分别为2011、2000与2015年。将丰、平、枯水年作为本次研究3种水文情景,利用耦合模型计算不同水文情景下流域内污染物入河负荷,分析不同水文情景下流域内白龙江水质情况。
-
本次研究耦合改进输出系数模型和InfoWorks ICM河流水动力水质模型,利用DEM数字高程数据结合GIS平台,将整个流域划分为20个子流域并选择典型断面作为研究断面 (见图2) ,计算每个子流域污染物入河负荷并模拟白龙江水质情况,在水质变化模拟过程中,综合考虑泥沙吸附、硝化、反硝化等因素对流域水质的影响。
-
该研究区内同时存在点源污染和面源污染,如工业污染源、畜禽养殖、农田径流、城镇生活污水和农村生活污水等,考虑降雨和地形条件对污染物入河的影响,采用改进的输出系数模型计算流域内入河污染负荷。输出系数模型最早由Johnes和O’Sulivan提出,但忽视了降雨产汇流过程差异,忽略了土地利用类型不同对计算结果的影响[21]。降雨对入河污染负荷有显著影响,并具有显著时空效应,降雨强度、地形因素都是影响径流和冲刷的关键因素,对面源污染物迁移有重要影响。李华林等[22]用改进输出系数模型评估北运河上游流域污染物迁移对河流水质的影响,认为模型适应性强,可以满足水环境模拟要求。王艳等[23]将该模型应用于河套灌区农田氮磷污染负荷评估,模拟结果有效反映了流域内氮磷污染情况。改进输出系数模型污染物输出量计算公式如式(1)所示。
式中:
$ \alpha $ 为降雨影响因子;$ \beta $ 为地形影响因子;$ i $ 为土地利用类型;$ j $ 为污染物类型;$ {L}_{j} $ 为入河污染负荷,t·a−1;$ {E}_{ij} $ 为$ i $ 土地利用类型中$ j $ 类污染物输出系数,$ \mathrm{t}\cdot{\left({\mathrm{k}\mathrm{m}}^{2}\cdot{\mathrm{a}}^{-1}\right)}^{-1} $ ;$ {A}_{i} $ 为$ i $ 类土地利用类型中所占面积,$ {\mathrm{k}\mathrm{m}}^{2} $ 。降雨影响因子和地形影响因子参数分别由历史降雨数据和地形数据代入模型初步得出取值范围[24-25],然后经模型率定得到准确值,研究区内降雨影响因子和地形影响因子取值范围分别为0.367~0.625、0.785~2.146,经率定后降雨影响因子和地形影响因子准确值分别为0.478、1.269。改进输出系数模型的主要参数及率定结果见表1。
为确保改进输出系数模型在该研究区域的适用性,采用相对误差进行验证,计算公式见式(2)。
式中:
$ {Re} $ 为相对误差;$ m $ 为模型模拟值;$ {m_0} $ 为模型实测值。相对误差为正数时代表模拟结果偏大,为负数时代表模拟结果偏小。相对误差越趋近于0,模拟效果越好。本次研究选取#12子流域作为验证区,根据流域内河道实测流量和各污染物浓度计算入河污染物负荷作为实测值验证改进输出系数模型。验证区COD、TN、NH4+-N和TP污染物入河负荷实测值分别为146.2、23.1、9.2和1.3 t·a−1,模拟值分别为136.7、25.4、9.85和1.42 t·a−1,相对误差分别为-6.50%、9.96%、7.07%和9.23%,模拟值和实测值比较相近,可见改进输出系数模型在该研究区内有很好适用性。
-
InfoWorks ICM河流水质模型实在水动力模型的基础上做并行计算,采用圣维南方程组作为河道非恒定流控制方程,圣维南方程组由连续性方程和动量方程组成,具体形式见式(3)、式(4)、。
连续性方程。
动量方程。
式中:
$ Q $ 为流量,$ {\mathrm{m}}^{3}\cdot{\mathrm{s}}^{-1} $ ;$ A $ 为横截面积,$ {\mathrm{m}}^{2} $ ;g为重力加速度,$ {\mathrm{m}}^{2}\cdot{\mathrm{s}}^{-1} $ ;$ \theta $ 为水平夹角,度数;$ {S}_{0} $ 为床层坡度,$ K $ 为输送量,可由曼宁公式进行计算。InfoWorks ICM河流水动力水质模型对污染物扩散过程依托水流运动情况,计算公式见式(5)。
式中:
$ D $ 为扩散系数,m2·s−1;$ {D_0} $ 为修正系数,m2·s−1;$ {D_1} $ 为剪切速度系数,m2·s−1;$ \bar u $ 为剪切速率,m·s−1;$ f $ 为摩阻系数,$ b $ 为河道宽度,m。InfoWorks ICM河流水动力水质模型采用纳什系数法评价模拟结果准确性,计算公式见式 (6) 。
式中:
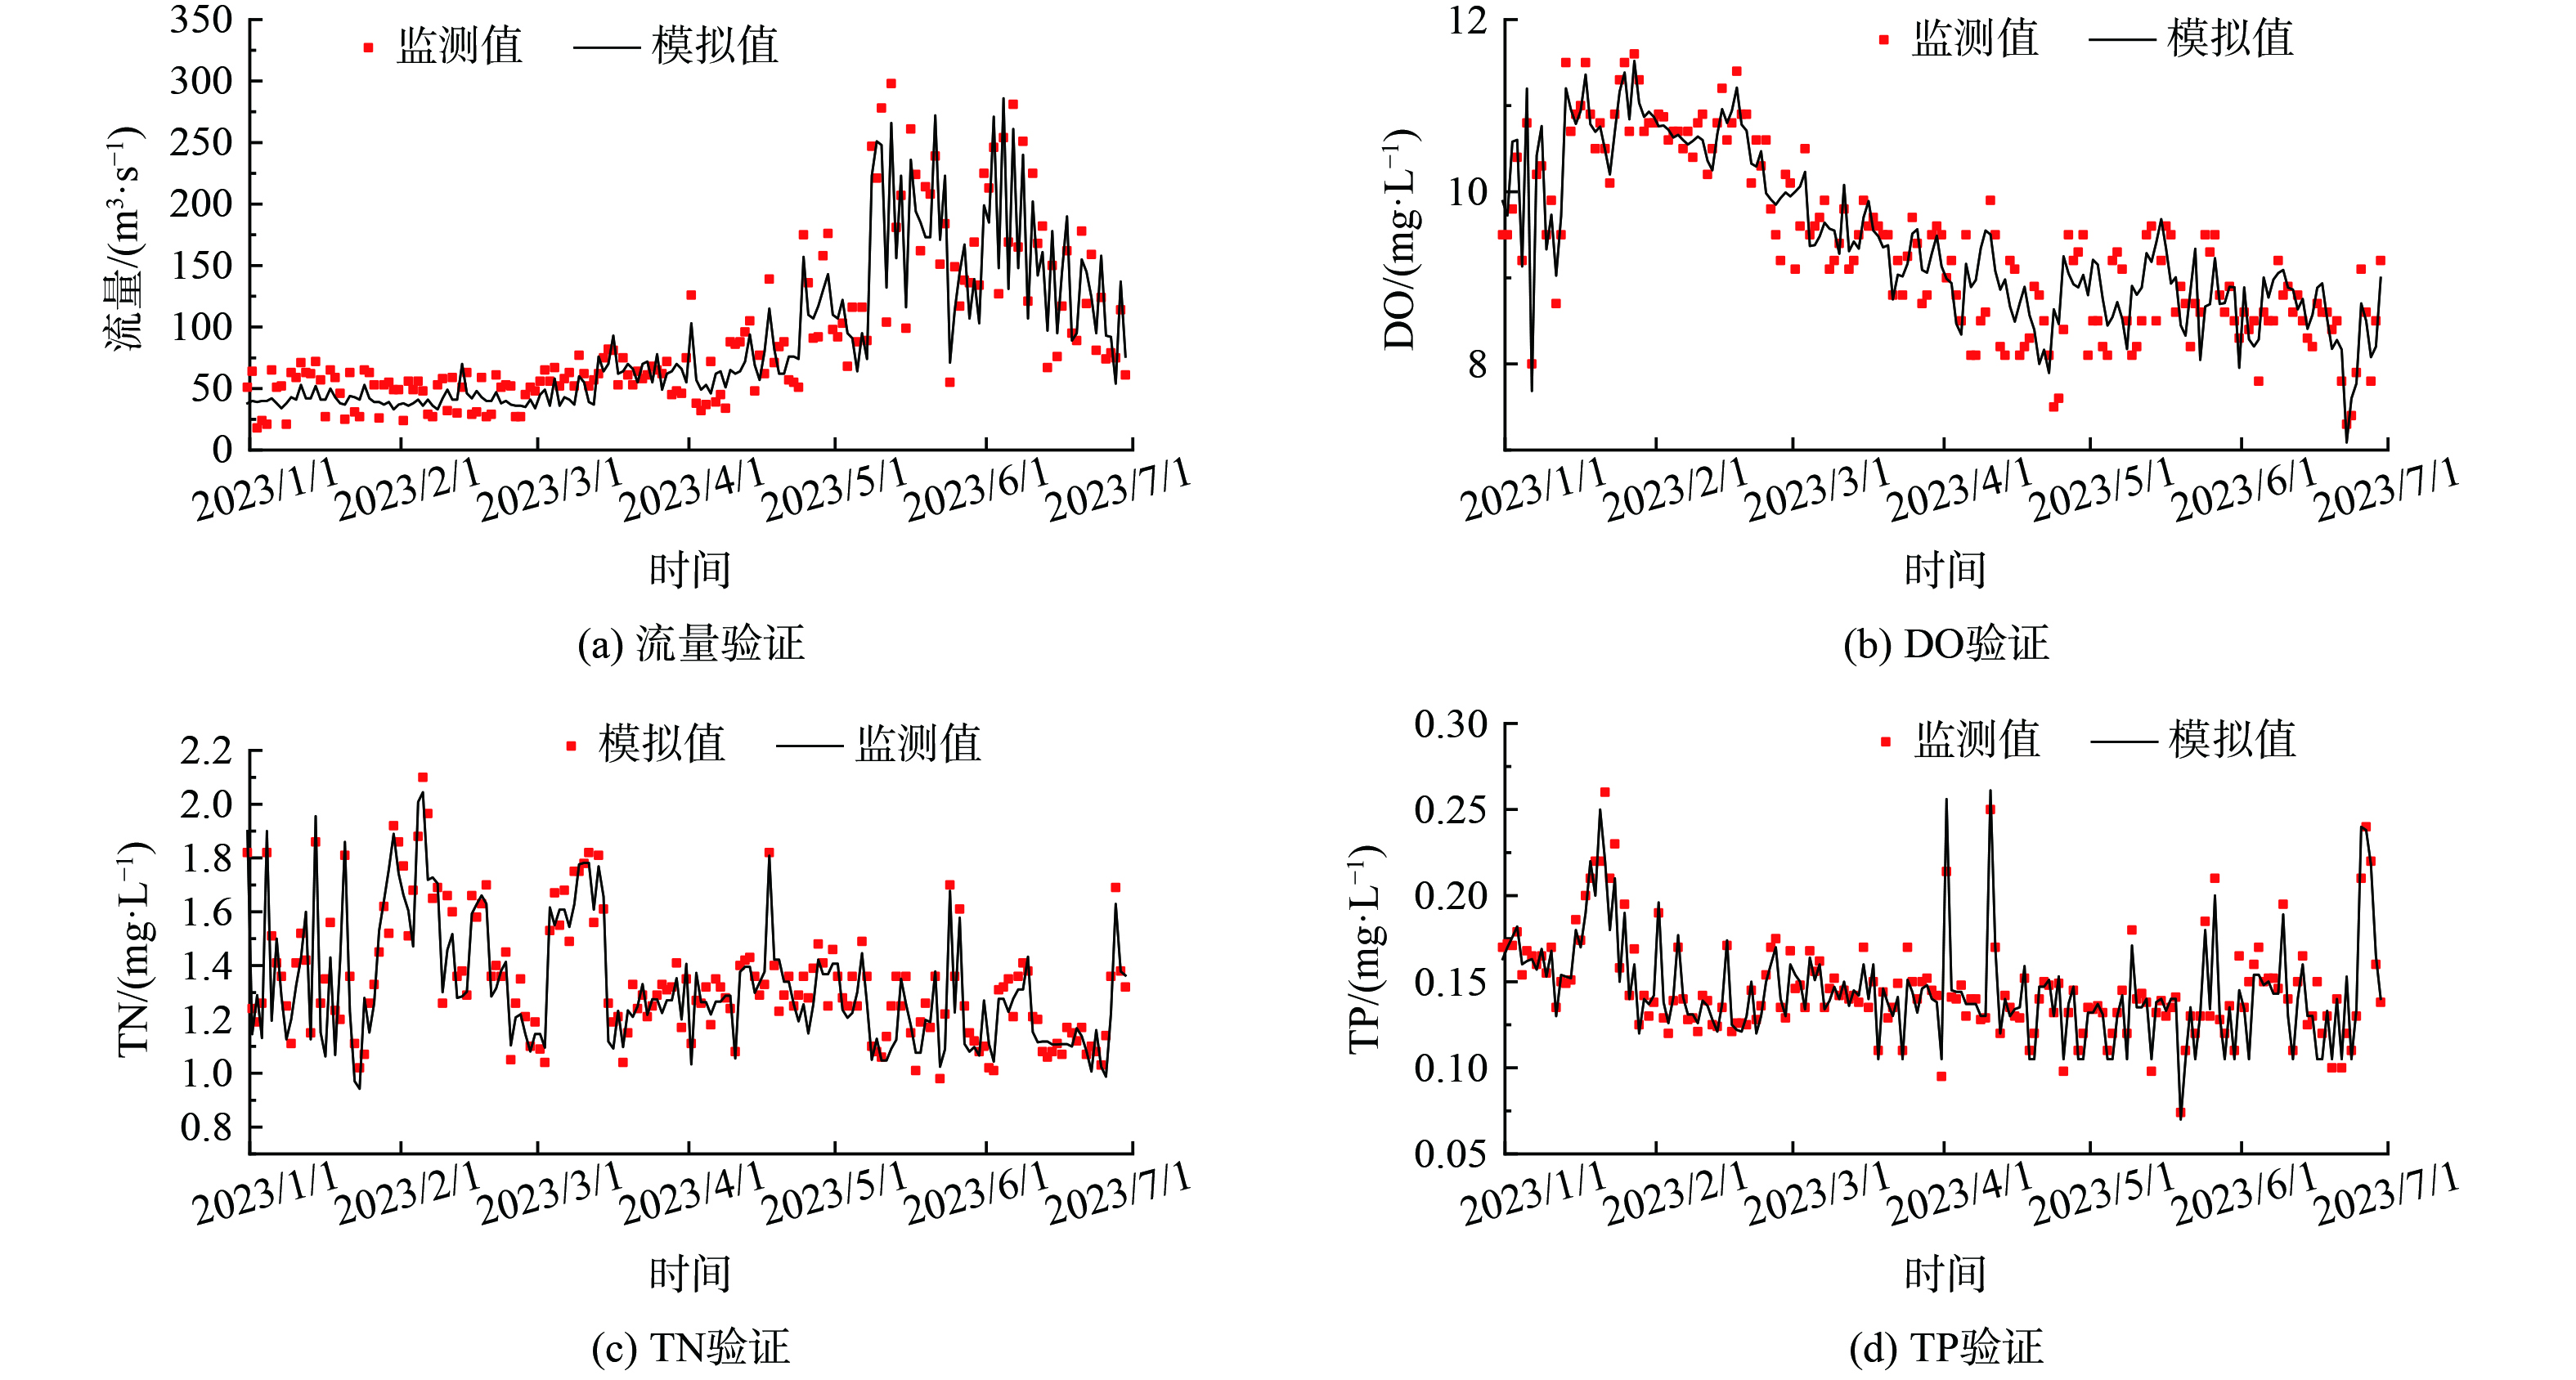
$ NSE $ 为纳什系数;$ {x}_{i} $ 为监测值;$ {x}_{i0} $ 为模拟值;$ {x}_{j} $ 为监测值均值。$ NSE $ 值越趋近于1,证明模拟准确性越高,水动力模型$ NSE $ 值不小于0.6,水质模型$ NSE $ 值不小于0.5[26]。InfoWorks ICM河流水动力水质模型率定验证采用同时段水动力水质监测数据,采用2022年6—12月监测数据率定模型,首先率定水动力模型,然后率定水质模型,率定结果见表2。采用2023年1—6月监测数据验证模型适用性,部分断面验证结果见图3,经验证计算,
$ NSE $ 值分别为0.89、0.84、0.83和0.78,表明模型模拟准确性较好,可用于本次研究。 -
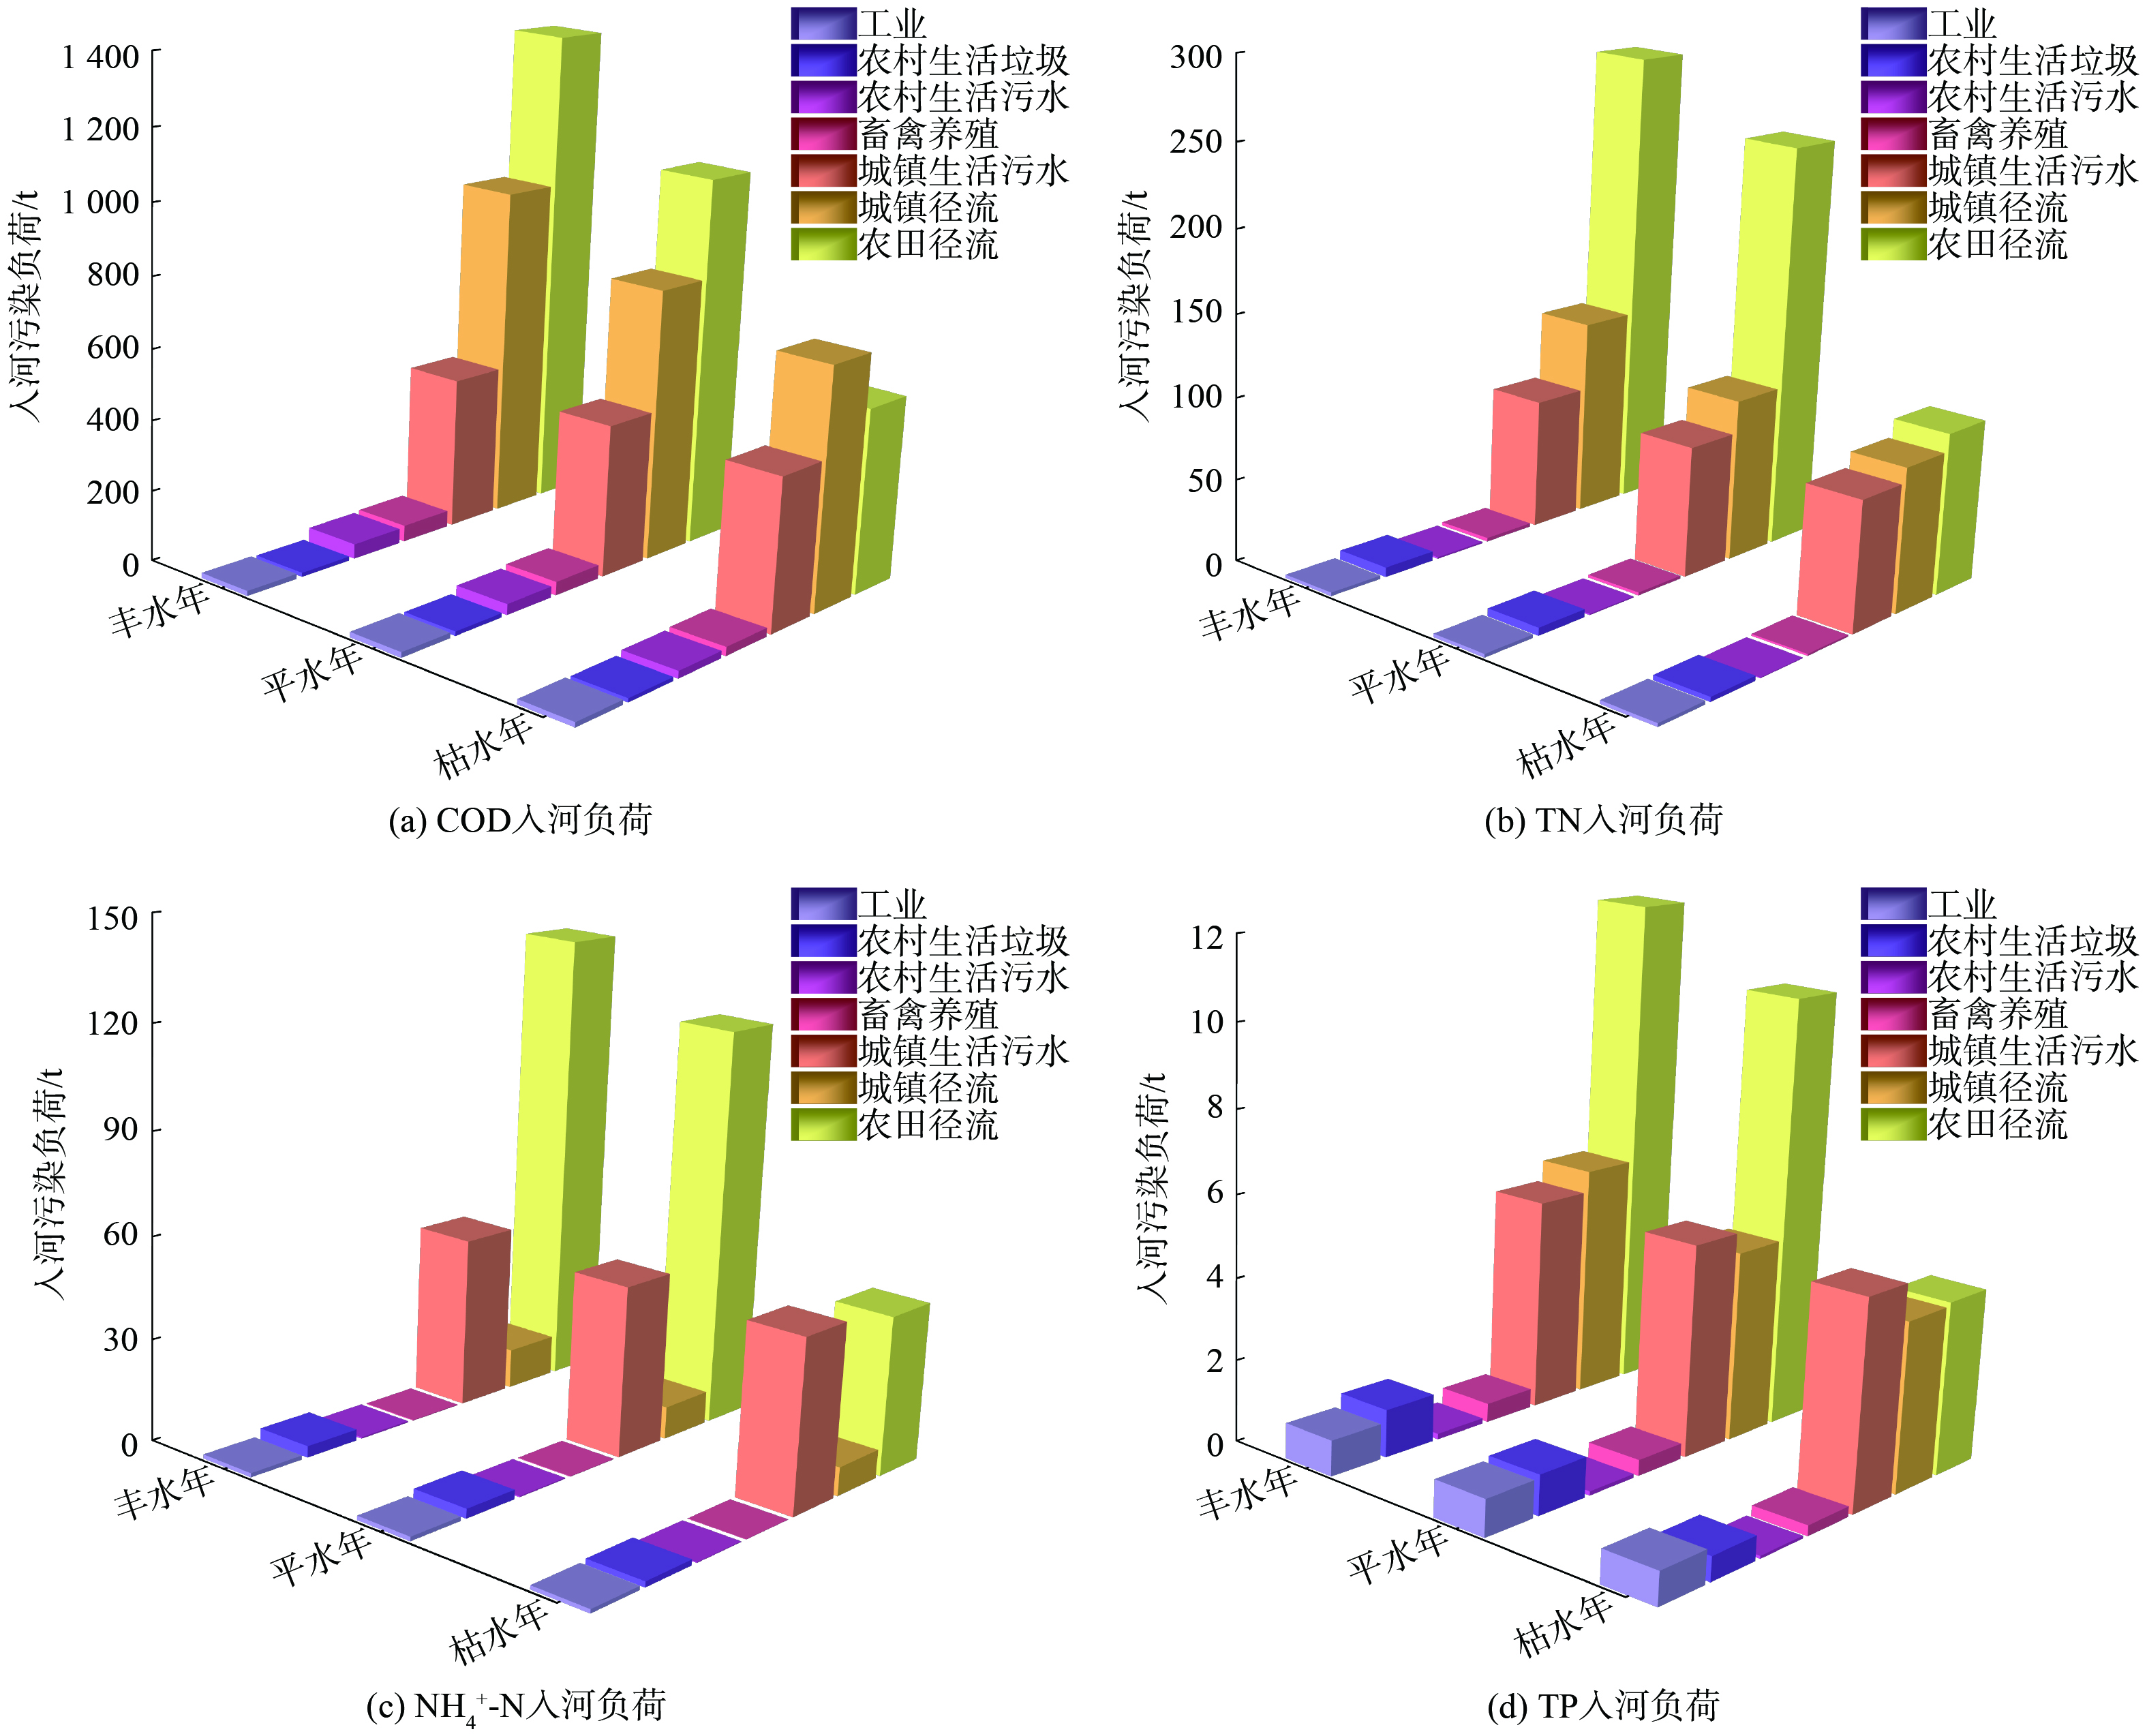
研究区不同水文情景下入河污染负荷见表3,各类污染物入河负荷在丰、平、枯水年存在显著差异,入河污染负荷整体呈现出丰水年>平水年>枯水年,丰水年COD、NH4+-N、TN和TP入河负荷分别为2 891.44、202.99、496.55和25.76 t,各类污染物入河负荷均为3种水文情景下最大。本次研究综合考虑点源污染和面源污染对白龙江水质的影响,分析在丰、平、枯水年3种水文情景下不同污染源COD、NH4+-N、TN和TP入河负荷,结果见图4。由此可知,农田径流、城镇径流和城镇生活污水是COD、NH4+-N、TN和TP入河负荷的主要来源,而工业、农村生活垃圾、农村生活污水、畜禽养殖污染源对3种水文情景下COD、NH4+-N、TN和TP入河负荷贡献量较小。此外,各类污染源对不同水文情景下COD、NH4+-N、TN和TP入河负荷贡献量均有差异。根据对COD入河负荷模拟结果统计,丰水年和平水年农田径流对COD入河负荷贡献最大,分别达到1 382.56、1 058.98 t。农田径流和城镇径流成为COD入河负荷的主要贡献源,而对枯水年模拟研究发现,COD入河负荷主要来源于城镇径流。根据TN入河负荷统计可知,不同水文情景下TN入河负荷主要来源于农田径流、城镇径流和城镇生活污水,呈现出农田径流>城镇径流>城镇生活污水>农村生活垃圾>农村生活污水>工业。NH4+-N入河负荷在3种水文情景下呈现出相似趋势,其主要污染源为农田径流和城镇生活污水,如在平水年分别达到117.66、50.54 t。还有,TP入河负荷在不同水文情景下主要污染源也不相同。丰水年TP入河负荷主要来源于农田径流和城镇径流,平水年和枯水年TP入河负荷主要来源于农田径流和城镇生活污水。
-
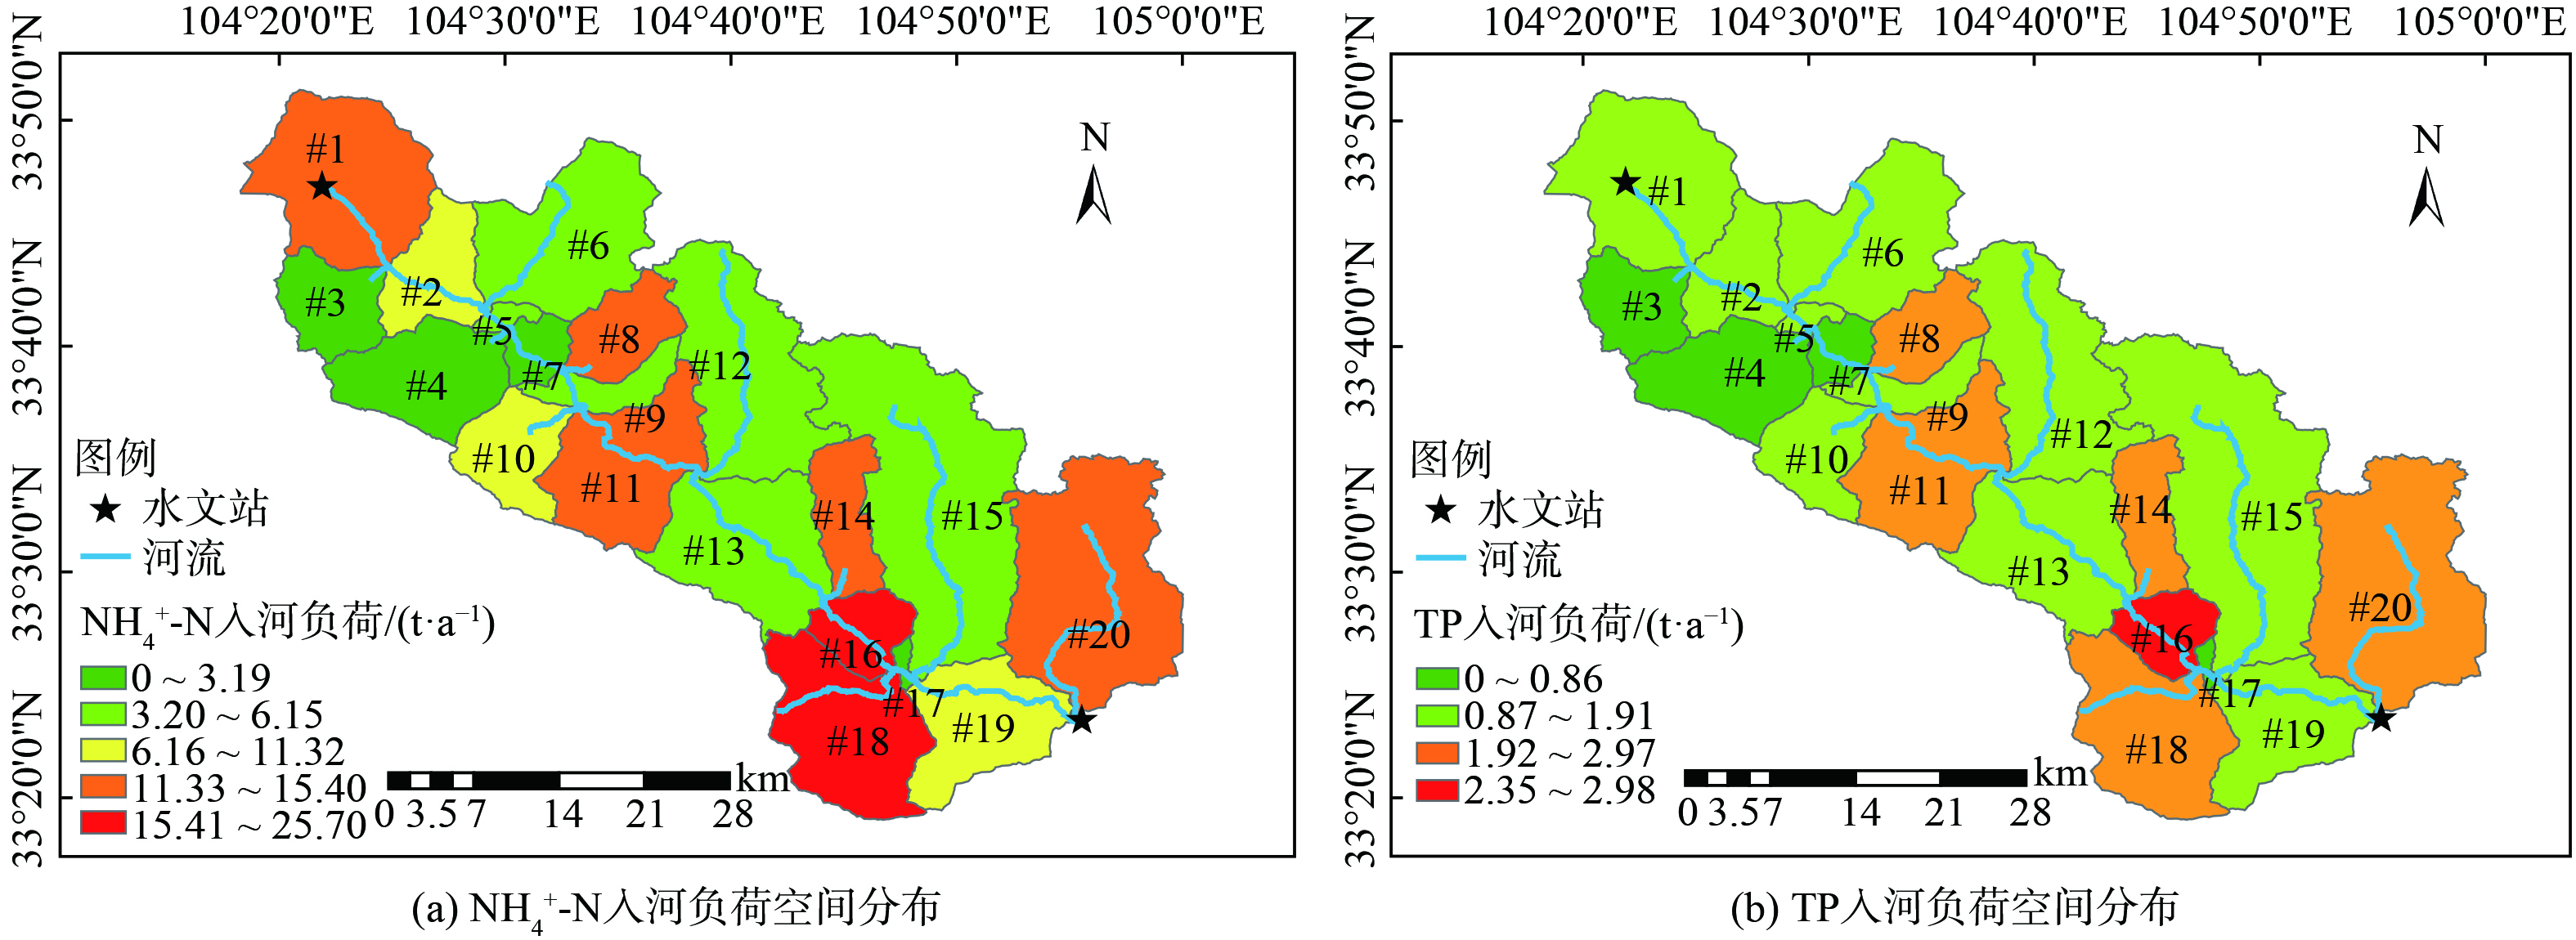
为研究流域内入河污染负荷空间分布特征,选取平水年NH4+-N、TP作为研究对象,模拟结果见图5。NH4+-N、TP入河负荷在流域内空间分布基本一致,各个子流域NH4+-N、TP入河负荷存在显著空间差异性,高污染负荷子流域区域相对集中,#16、#18子流域NH4+-N入河负荷最高,分别达到25.7、20.1 t,TP入河负荷最高位置为#16子流域,达到2.97 t,入河负荷较高区域均出现在白龙江南岸区域,呈现出南岸子流域入河负荷高于北岸子流域入河负荷的情况。为了去除子流域面积对入河污染负荷的影响,进一步采用污染负荷强度法分析每个子流域NH4+-N、TP入河负荷强度,见图6。流域内NH4+-N污染负荷强度处在0~25.7 kg·ha−1之间,TP污染负荷强度处在0~0.825 kg·ha−1,且两者空间分布基本一致。#8、#11、#16和#18子流域污染物负荷强度较高,#11子流域NH4+-N和TP污染负荷强度最高,分别为10.08和0.825 kg·ha−1,表明其氮磷污染相比其他子流域更加严重。污染物负荷强度较低子流域为#3、#4、#10,因其3个子流域内土地利用类型多为林地和种植园用地,农田面积相对较少,故面源污染较轻。
-
模拟结果显示,研究区白龙江水质具有明显时间特征,汛期 (5—10月份) 和非汛期 (11—次年4月份) 流量差别较大,且各污染物浓度存在明显差异。以平水年为例,基于InfoWorks ICM水动力水质模型,模拟白龙江水质在汛期和非汛期内的水质变化情况,各个研究断面污染物浓度平均值见图7。汛期和非汛期支流断面COD、TN、NH4+-N和TP浓度均明显小于干流断面浓度。各断面上COD、TN、NH4+-N和TP浓度均呈现出沿程增大的趋势,且相较于NH4+-N和TP浓度,COD、TN浓度沿程波动幅度更大。各个断面非汛期COD、TN和NH4+-N浓度明显大于汛期,非汛期各研究断面COD、TN和NH4+-N最大浓度分别为27.68、1.48和0.59
$ \mathrm{m}\mathrm{g}\cdot{\mathrm{L}}^{-1} $ ,汛期各研究断面COD、TN、NH4+-N最大浓度分别为18.64、0.98和0.38$ \mathrm{m}\mathrm{g}\cdot{\mathrm{L}}^{-1} $ 。汛期和非汛期各断面TP浓度差异较小,非汛期各断面TP浓度为0.07~0.19$ \mathrm{m}\mathrm{g}\cdot{\mathrm{L}}^{-1} $ ,汛期各断面TP浓度处在0.05~0.15$ \mathrm{m}\mathrm{g}\cdot{\mathrm{L}}^{-1} $ 之间,非汛期各断面TP浓度稍高于非汛期。分析原因,可能是由于汛期径流冲刷较强,且汛期正处在研究区内农田施肥阶段,含磷肥料的过度使用导致大量磷元素随着地表径流进入白龙江,使得TP浓度迅速上升,水质变差。经以上研究可知,在非汛期阶段白龙江水质较差,为进一步探究研究区内白龙江水质最差情况,选择最不利水文条件即枯水年非汛期,以NH4+-N和TP作为水质指标模拟分析白龙江水质情况,结果见图8。NH4+-N最大浓度位置出现在中下游,最高浓度可达1.43 mg·L−1,且下游处NH4+-N浓度又稍有下降。分析原因,NH4+-N在随水流迁移过程中,伴随着硝化、反硝化过程的发生,硝化、反硝化速率大于周围子流域NH4+-N汇入白龙江的速率,所以下游段NH4+-N浓度稍有降低。在考虑泥沙吸附情况下,研究流域内TP浓度沿水流方向逐渐增大,下游位置TP浓度最大,最高可达0.35 mg·L−1,TP沿程衰减速率远小于输入速率,导致TP浓度沿水流方向逐渐增大。
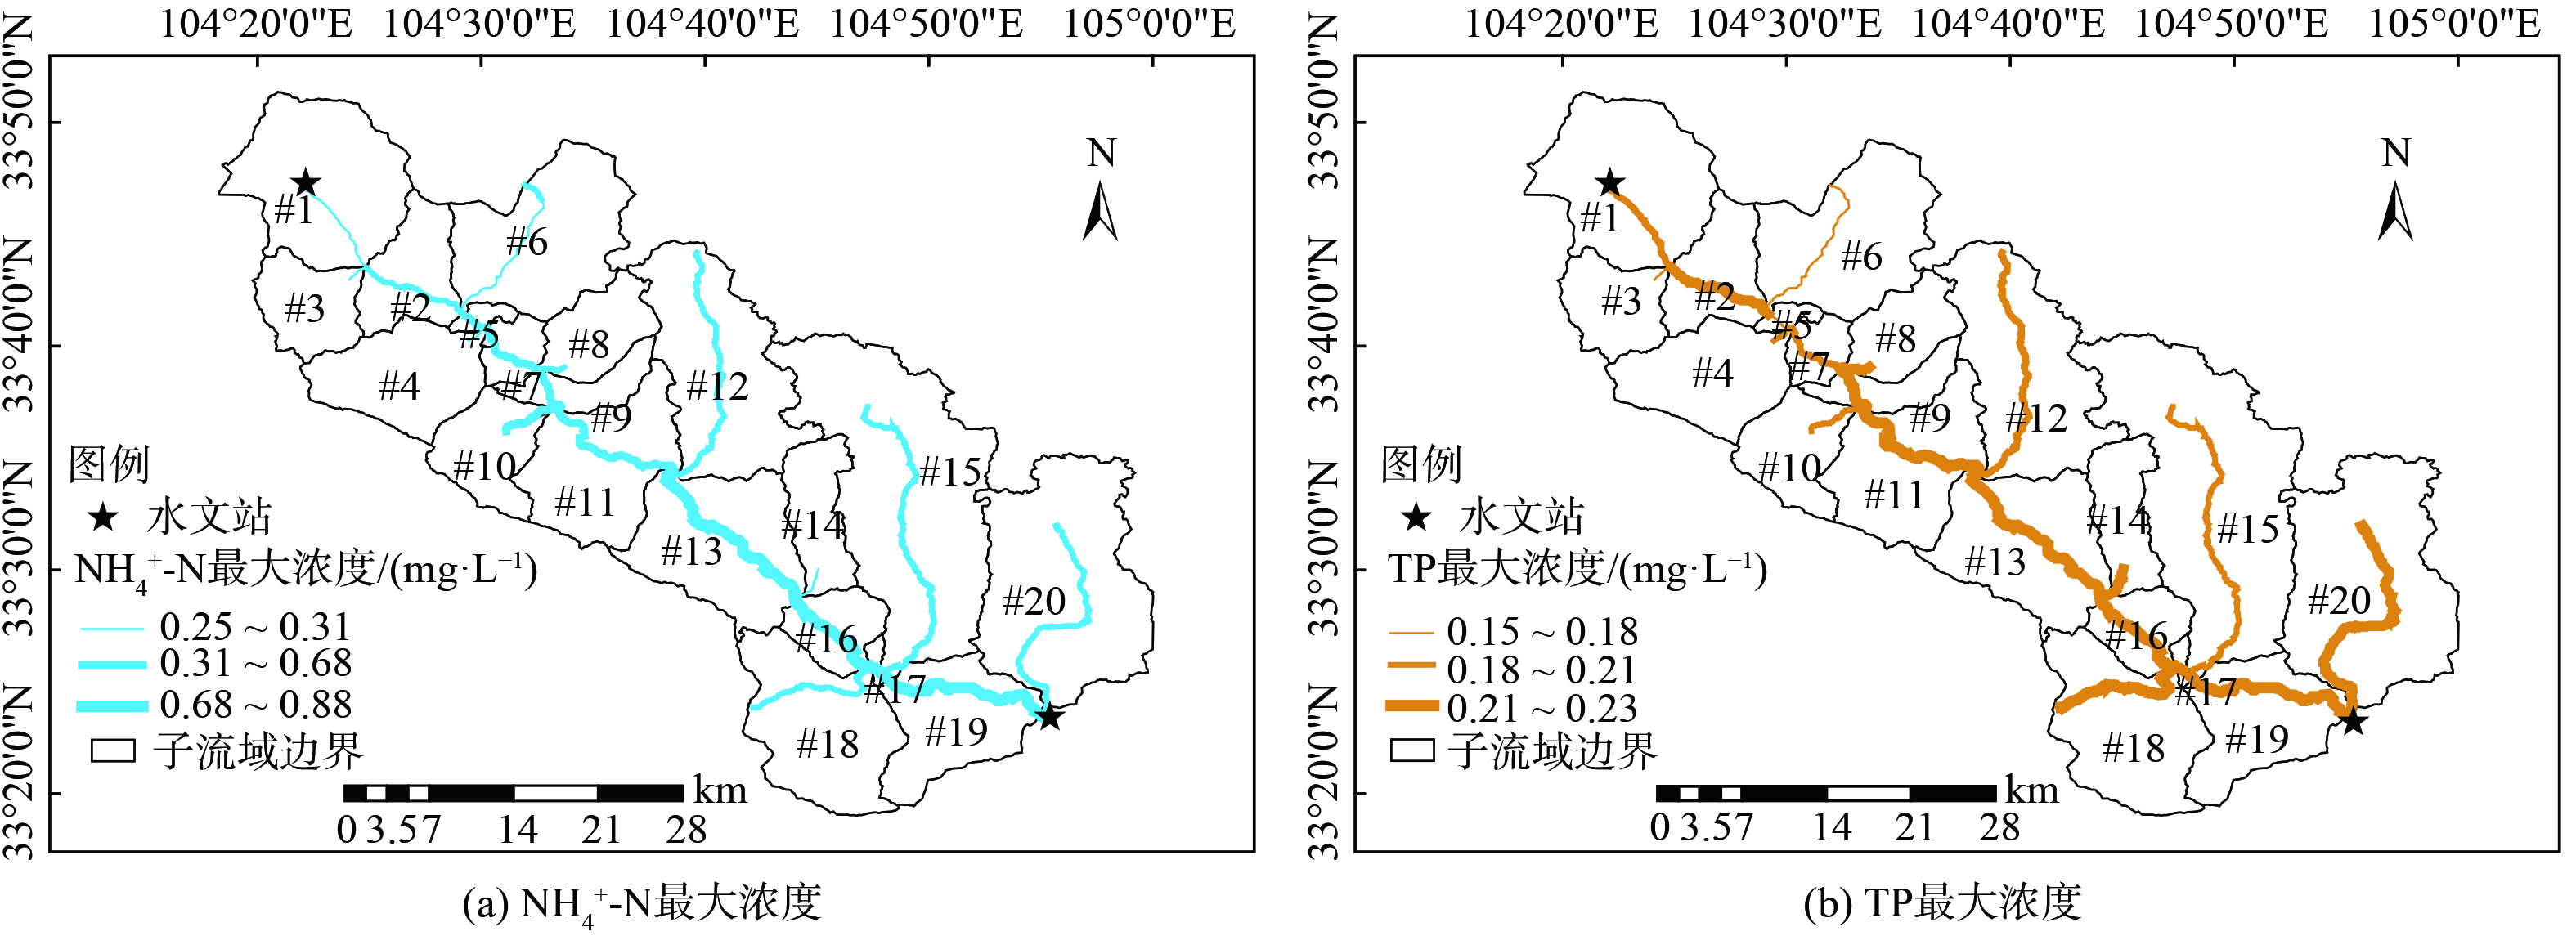
为有效提升研究区白龙江水质,加强白龙江流域水环境保护,探究在水环境重污染区域建设生态缓冲区对白龙江水质的影响。生态缓冲区是重点区域水污染防治和生态修复的有效手段,常见的生态缓冲区如植被缓冲带、生态植草沟等,可有效抵御降雨径流冲刷和人为因素对水环境的影响[27-28]。本次研究将污染物入河负荷较高的#11子流域作为重污染区域,根据沿岸地形确定生态缓冲区,利用InfoWorks ICM水动力水质模型中的LID模块设置宽度20 m,长度19.5 km,坡度为2°的植被缓冲带作为改造措施,在其他参数不变条件下模拟计算NH4+-N和TP变化情况,模拟结果见图9。对比图8、图9可知,设置生态缓冲区后,白龙江水质有明显改善,NH4+-N和TP浓度明显降低。在最不利水文条件下,研究区内白龙江NH4+-N和TP最高浓度分别为0.88和0.23 mg·L−1。因此,设置生态缓冲区可以作为防治流域水环境污染、改善白龙江水质的有效手段。
-
1) 不同水文情景下,污染物入河负荷不同,呈现出丰水年>平水年>枯水年的特征。综合3种水文情景下污染物入河负荷可知,农田径流和城镇径流是COD和TN入河负荷主要来源,NH4+-N和TP入河负荷主要来源于农田径流和城镇生活污水。
2) 污染物入河负荷在各个子流域内呈现出空间不均匀性。由于土地利用类型不同,中下游子流域农田面积较大,导致NH4+-N和TP入河负荷最高。
3) 白龙江水质变化具有明显时间特征,汛期水质明显优于非汛期。在最不利水文条件下,白龙江NH4+-N浓度最大位置在中下游,最大浓度为1.43 mg·L−1,而下游处TP浓度最大,最大值为0.35 mg·L−1,整个研究区内白龙江水质呈现出由Ⅲ类水体向Ⅳ类水体过渡的趋势,有水质恶化的可能性。
4) 研究区域内白龙江流域水环境治理,应该注重减少农田径流、城镇径流等面源污染对白龙江水质的影响,且NH4+-N、TP最大浓度分别出现在中下游和下游位置处,应作为水污染防治重点区域。
基于InfoWorks ICM模型的白龙江流域甘肃段水质模拟及分析
Water quality simulation and analysis in Gansu section of Bailong River Basin based on InfoWorks ICM model
-
摘要: 针对白龙江沿岸农业种植、畜禽养殖等产业发展影响河流水质的问题,以甘肃省南部白龙江流域为研究对象,采用改进输出系数模型计算丰、平、枯水年等典型水文情景下流域内工业、农村生活垃圾、农村生活污水、畜禽养殖、城镇生活污水、城镇径流和农田径流等污染源污染负荷,基于InfoWorks ICM构建了白龙江水动力水质模型,模拟分析COD、TN、NH4+-N和TP等污染负荷分布特征,评估了最不利水文条件下白龙江水质污染风险,验证了该模型在流域水质污染模拟评估的适用性。研究结果表明,不同水文情景下污染物入河负荷主要来源存在显著差异,如丰水年和平水年农田径流是COD污染的主要来源,污染负荷分别达到1 382.56、1 058.98 t,而枯水年污染源主要是城镇径流。污染物负荷存在明显空间差异,研究区内子流域污染负荷空间分布不均匀,高污染负荷主要出现在中下游子流域。白龙江水质在汛期和非汛期差异较大,非汛期水质更差。通过模拟最不利水文情景 (枯水年非汛期) 发现,研究区内白龙江NH4+-N浓度最大位置出现在中下游,最高可达1.43 mg·L−1,且中下游TP浓度较高,最高值为0.35 mg·L−1,难以满足Ⅲ类水体水质要求,存在水污染风险。利用改进输出系数模型评估污染物负荷具有较好的可靠性,基于InfoWorks ICM构建的河流水动力水质模型在污染物时空分布评估适用性较强,为我国河流水质模拟和流域水环境治理提供示范参考和决策依据。Abstract: Aiming at the problems of river water quality affected by the development of agricultural planting, livestock and poultry breeding and other industries along Bailong River, the Bailong River basin in southern Gansu Province was taken as the research object. The improved output coefficient model was used to calculate the pollution load of industrial, rural domestic waste, rural domestic sewage, livestock and poultry breeding, urban domestic sewage, urban runoff and farmland runoff in the basin under typical hydrological scenarios such as abundant, flat and dry years. Based on InfoWorks ICM, the dynamic water quality model of the Bailong River was constructed. The distribution characteristics of COD, TN, NH4+-N, TP and other pollution loads were simulated and analyzed, and the risk of water pollution in the Bailong River under the most unfavorable hydrological conditions was assessed, and the applicability of the model in the simulation and assessment of water pollution in the basin was verified. The results showed that the main sources of pollutant load into the river were different under different hydrological scenarios. For example, farmland runoff was the main source of COD pollution in wet and normal years, and the pollution load reached 1 382.56 t and 1 058.98 t respectively, while the pollution source in dry years was mainly urban runoff. There were obvious spatial differences in pollutant loads, and the spatial distribution of pollution loads in sub-basins in the study area was not uniform, and high pollution loads mainly appeared in the middle and lower sub-basins. The water quality of Bailong River was different in flood season and non-flood season, and the water quality in non-flood season was worse. Through the simulation of the most unfavorable hydrological scenario (non-flood season in dry year), it was found that the maximum concentration of NH4+-N in the Bailong River in the study area appeared in the middle reaches, reaching up to 1.43 mg/L, while the TP concentration was higher in the middle and lower reaches, reaching the highest value of 0.35 mg/L, which was difficult to meet the water quality requirements of Class III water bodies, and there was a risk of water pollution. The improved output coefficient model had good reliability in the assessment of pollutant load, and the hydrodynamic water quality model based on InfoWorks ICM had strong applicability in the assessment of spatial and temporal distribution of pollutants, which provided demonstration reference and decision-making basis for river water quality simulation and watershed water environment management in China.
-

-
表 1 改进输出系数模型主要参数率定结果
Table 1. The main parameter calibration results of the improved output coefficient model
率定参数 具体项目 率定结果 农村生活污水产生系数/
(g·人−1·d−1)COD 16.86 TN 5.32 NH4+-N 4.31 TP 0.47 农村生活垃圾负荷/
(g·kg−1)COD 57 TN 14.3 NH4+-N 8.6 TP 3.1 畜禽养殖产生系数/
(g·头−1·d−1)COD 16.8 TN 6.2 NH4+-N 3.4 TP 0.82 农田径流源强系数/
(kg·亩−1·a−1)COD 10.2 TN 3.5 NH4+-N 2.8 TP 0.53 表 2 InfoWorks ICM河流水动力水质模型主要参数率定结果
Table 2. The main parameters calibration results of InfoWorks ICM river hydrodynamic water quality model
率定参数 具体项目 率定结果 水文参数 河床糙率 0.038 排放系数 0.86 模式上限 0.94 扩散系数/(m2·s−1) COD 12.6 NH4+-N 14.6 TN 16.2 TP 8.3 DO 9.7 衰减系数/d−1 COD 0.13 NH4+-N 0.08 TN 0.15 TP 0.15 复氧系数/(m·hr−1) DO 0.04 表 3 不同水文情景下入河污染负荷
Table 3. Instream pollution load under different hydrological scenarios
t·a−1 水质项目 枯水年 平水年 丰水年 COD 1 724.93 2 372.56 2 891.44 NH4+-N 109.53 182.46 202.99 TN 273.73 435.75 496.55 TP 15.42 22.82 25.76 -
[1] 杜海峰, 李文敏, 王洋, 等. 白龙江流域生态环境问题与对策研究[J]. 农业灾害研究, 2022, 12(11): 120-122. doi: 10.3969/j.issn.2095-3305.2022.11.039 [2] 陈林生, 张岚琦, 宋占邦, 等. 白龙江干旱河谷灌丛群落类型与土壤持水特性[J]. 安徽农业科学, 2022, 50(22): 111-113+163. [3] SU Y, HE S, WANG K, et al. Quantifying the sustainability of three types of agricultural production in China: An emergy analysis with the integration of environmental pollution[J]. Journal of Cleaner Production, 2019, 252: 119650. [4] 张春悦, 白永平, 杨雪荻, 等. 典型高山峡谷区生态脆弱性评价及响应策略——以甘肃省舟曲县为例[J]. 兰州大学学报(自然科学版), 2022, 58(5): 623-630. [5] UDDIN M G, NASH S, OLBERT A I. A review of water quality index models and their use for assessing surface water quality[J]. Ecological Indicators, 2021, 122: 1470-1160. [6] 程军蕊, 王侃, 冯秀丽, 等. 基于GIS的流域水质模拟及可视化应用研究[J]. 水利学报, 2014, 45(11): 1352-1360. [7] 曹慧群, 赵鑫. 流域水环境数值模拟技术应用及研究展望[J]. 长江科学院院报, 2015, 32(6): 20-24+31. [8] ZHU L, SONG J X, LIU W Q, et al. Pollution load estimation based on characteristic section load method[C]. 1st International Global on Renewable Energy and Development (IGRED), 2017. [9] 翟敏婷, 辛卓航, 韩建旭, 等. 河流水质模拟及污染源归因分析[J]. 中国环境科学, 2019, 39(8): 3457-3464. [10] 陈文君, 段伟利, 贺斌, 等. 基于WASP模型的太湖流域上游茅山地区典型乡村流域水质模拟[J]. 湖泊科学, 2017, 29(4): 836-847. [11] ZHENG Y, LEI G, YU P. Eco-compensation schemes for controlling agricultural non-point source pollution in Maoli Lake watershed[J]. Water, 2021, 13(11): 1536. doi: 10.3390/w13111536 [12] 洪夕媛, 雷坤, 孙明东, 等. 永定河流域张家口段水质模拟及水环境容量研究[J]. 环境污染与防治, 2021, 43(10): 1249-1254+1262. [13] 薛树红, 李明, 吴巍, 等. 基于多耦合模型的盛桥河流域水环境模拟研究[J]. 西北农林科技大学学报(自然科学版), 2021, 49(7): 83-94. [14] 易绍荣, 冯雪娇, 王宗伟, 等. 基于SWAT的河套灌区氮磷面源污染时空变化研究[J]. 农业环境科学学报, 2023, 42(11): 2550-2559. [15] 黄宏, 商栩, 梅琨, 等. 基于Monte Carlo模拟的河流水质评价——以温瑞塘河为例[J]. 中国环境科学, 2019, 39(5): 2210-2218. [16] 戴君, 刘硕, 韩金凤, 等. 污染负荷多情景变化下河流水质响应关系研究[J]. 中国环境科学, 2018, 38(2): 776-783. [17] 顾晶晶, 冶运涛, 董甲平, 等. 高分辨率数据驱动的流域非点源污染输出风险评估方法[J]. 环境科学, 2022, 43(6): 3140-3148. [18] 匡舒雅, 李天宏, 赵志杰. 基于L-THIA模型的四川省濑溪河流域非点源污染负荷分析[J]. 2018, 31(4): 688-696. [19] 马红玉, 王亚楠, 杨蔚, 等. 我国中东部城镇水源高氯酸盐的点源分布及潜在来源[J]. 环境科学学报, 2023, 43(11): 105-114. [20] 马晓婧, 刘强, 潘继花, 等. 基于数字滤波法的拒马河基流分割及演变规律研究[J]. 北京师范大学学报(自然科学版), 2020, 56(5): 659-663. [21] 苟婷, 裴德富, 梁荣昌, 等. 基于输出系数模型的东江源头区农业面源氮磷排放特征分析[J/OL]. 中国环境科学: 1-13. [2024-03-06]. https://doi.org/10.19674/j.cnki.issn1000-6923.20230802.012. [22] 李华林, 张守红, 于佩丹, 等. 基于改进输出系数模型的非点源污染评估及关键源区识别: 以北运河上游流域为例[J]. 环境科学, 2023, 44(11): 6194-6204. [23] 王艳, 焦燕, 杨文柱, 等. 基于改进输出系数模型的河套灌区农田非点源氮磷污染估算[J/OL]. 中国环境科学: 1-11. [2024-03-06]. https://doi.org/10.19674/j.cnki.issn1000-6923.20230625.008. [24] DING X, SHEN Z, HONG Q, et al. Development and test of the export coefficient Model in the upper reach of the Yangtze River[J]. Journal of Hydrology, 2010, 383(3/4): 233-244. [25] XUEKAI C, XIAOBO L, WENQI P, et al. Non-point source nitrogen and phosphorus assessment and management plan with an improved method in data-poor regions[J]. Water, 2017, 10(1): 17. doi: 10.3390/w10010017 [26] MINGHAO W, LIJIE D, YANG B, et al. Improved export coefficient model for identification of watershed environmental risk areas[J]. Environmental science and pollution research international, 2022, 30(12): 34649-34668. doi: 10.1007/s11356-022-24499-z [27] 后雪峰, 屈清, 江英志. 基于GIS的揭阳市城市生态安全格局构建[J]. 华南师范大学学报(自然科学版), 2021, 53(3): 83-92. [28] 王鑫鑫, 杜辉, 陈璇, 等. 大黄堡湿地缓冲区池塘浮游植物多样性及水质生态评价[J]. 水利水电技术(中英文), 2023, 54(12): 1-11. -


 下载:
下载:
