-
南水北调中线工程是我国水资源配置的战略工程,水质保护十分重要。掌握输水渠道的水质时空变化趋势,对与中线工程的水质管理工作具有重要意义。由于南水北调中线工程为长距离跨流域明渠输水,输水干渠具有硬化程度高、生物群落结构单一的基本特点,渠道水质变化可能与普通河流系统存在较大的差异。针对中线工程的水质变化和影响因素,已有一些学者进行了研究和探讨,如水源区的水质安全与生态影响[1-2],部分渠段的浮游植物、真核生物、浮游细菌分布特征[3-6],输水渠道水质指标的沿程变化等,但对渠道水质的时空变化趋势还缺少整体认识。
层次聚类 (hierarchical clustering) 是使用欧式距离通过计算不同类别数据点间的相似度将研究对象进行分类,并进行系统研究的一种方法[7],可有效降低原始监测数据集的维度,简化数据的复杂程度。以监测点位、时间、指标和评价结果等为对象进行聚类分析,便于分析各指标时空分布特征及指标间的相关性。近年来,层次聚类分析作为传统多元统计方法,被广泛应用于地表水环境监测数据分析。传统的水质类别评价采用单因子评价方法,虽然简单易行,但反映的水质信息有限[8]。水质指数法 (water quality index, WQI) 是基于物理、生物和化学水质参数提出的一种实用、高效的地表水质量评价方法。它可以充分利用水质参数信息,通过标准化的计算方法,有效呈现水质整体状况。自20世纪60年代以来,水质指数法在水质评价研究中被广泛应用[9],特别是在河流、湖泊和水库的水质评价中取得了良好效果[10-12]。本研究基于聚类分析与WQI对南水北调中线干渠进行水质分区与评价,为中线工程水质管理提供参考。
-
南水北调中线工程从丹江口水库陶岔取水口取水,输水总干渠全长1 432 km,跨越我国长江、黄河、淮河和海河四大流域。渠道平均宽度54 m,平均水深6.95 m,设计年引水量95×108 m3[13]。中线工程跨越亚热带湿润气候带和温带季风气候带,季节气温变化明显,年平均降水量在542.7~1 173.4 mm之间。中线工程2014年12月12日正式通水,截至2023年5月,中线工程已累计供水超560×108 m3,极大地缓解华北地区严重的水资源短缺问题。
-
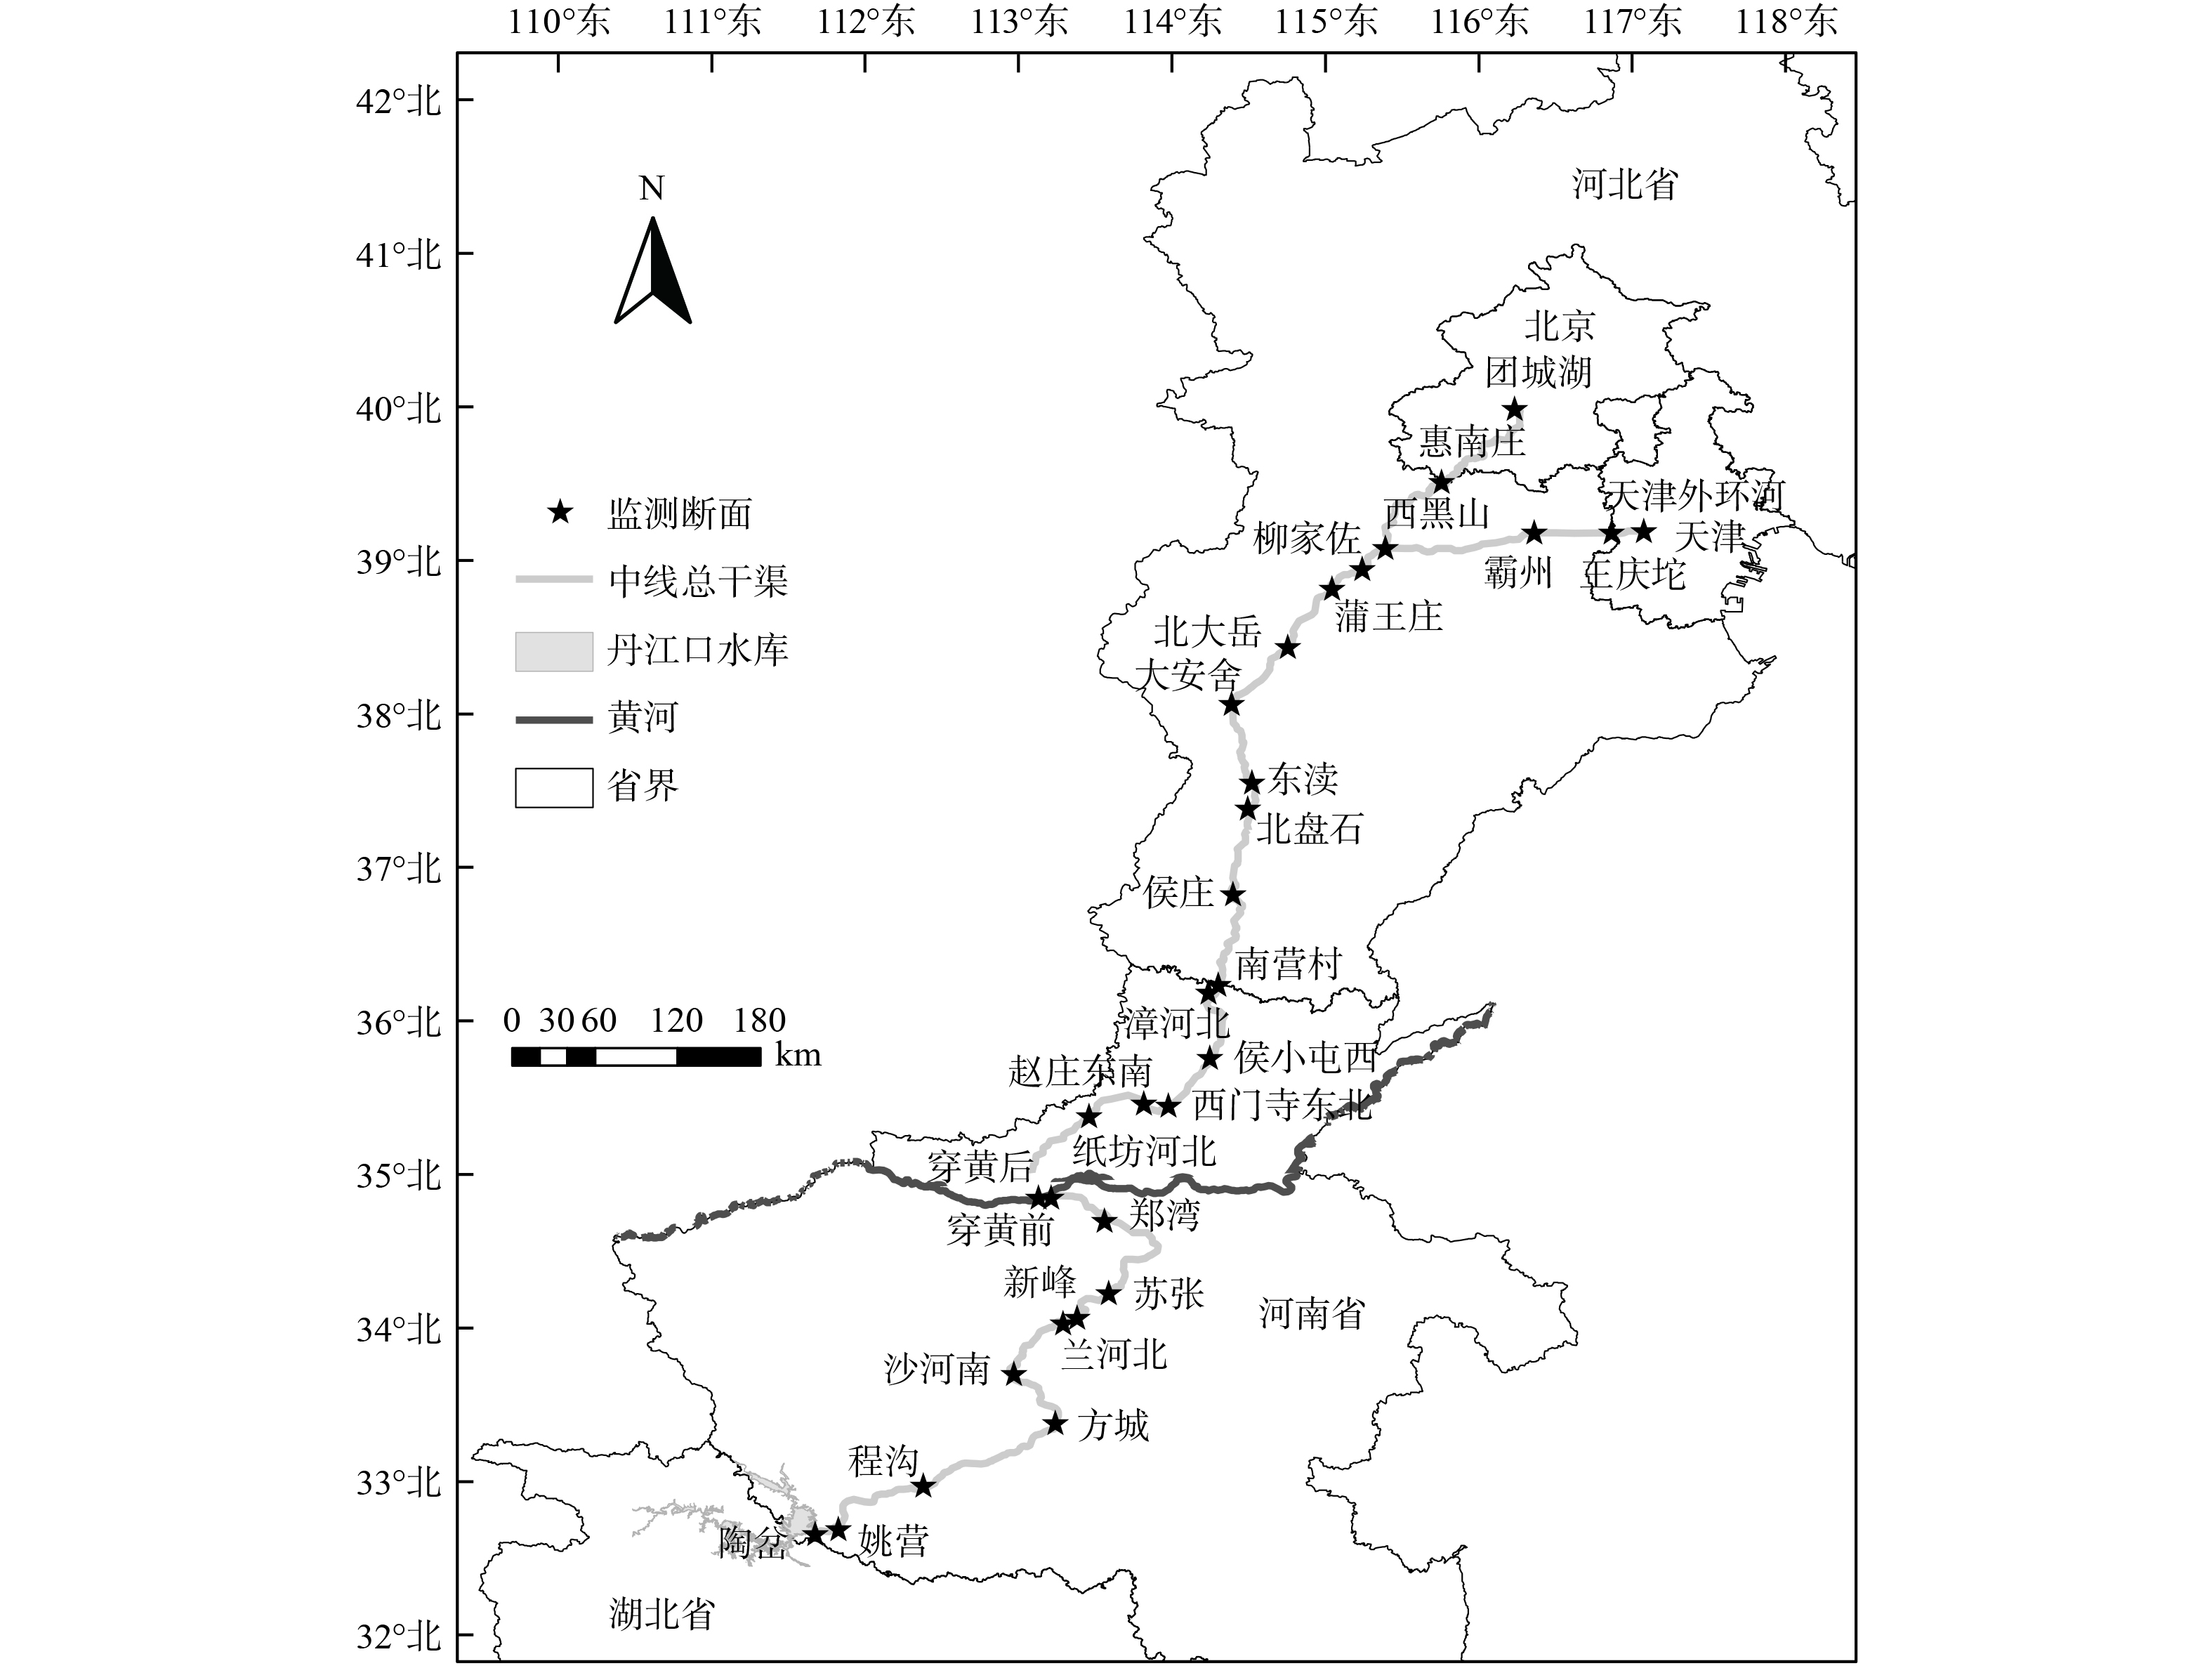
中线工程输水干渠沿线设置了30 个水质监测断面 (图1) ,每月进行采样分析。参照《中国地表水环境质量标准》 (GB3838-2002) 中的分析方法,测定了10 个水质参数,包括pH、水温 (WT,°C) 、溶解氧 (DO,mg·L−1) 、五日生化需氧量 (BOD5,mg·L−1) 、高锰酸盐指数 (CODMn,mg·L−1) 、粪大肠菌群 (F. coli,个·L−1) 、总磷 (TP,mg·L−1) 、总氮 (TN,mg·L−1) 、氨氮 (NH3-N,mg·L−1) 和硫酸盐 (SO42−,mg·L−1)。考虑到中线工程通水初期水质波动加大,因此以通水第四年 (2017年12月至2018年11月,以下称2018年) 作为典型年份进行分析,其中2017年12月—2018年2月为冬季,2018年3—5月为春季,6—8月为夏季,9—11月为秋季。
-
聚类分析是一种无监督学习,常用于对未知类别的样本进行划分,其原理是将这些未知样本按照一定的规则划分成若干个类簇,把相关的样本聚在同一个类簇中,把不相似的样本分为不同类簇,从而分析样本之间内在的性质以及相互之间的联系规律。层次聚类是聚类算法的一种,通过计算不同类别的相似度,在不同层次对数据集进行划分,从而形成树形的聚类结构。本研究使用层次聚类法对中线输水干渠所有监测断面的样本进行聚类分析,采用欧氏距离计算不同样本的个体距离,得到各断面间的相似度。其中欧氏距离由dist函数计算得到,聚类个数的划分由NbClust函数计算得到。层次聚类基于 R 4.3.0 (R Programming Language,University of Auckland,New Zealand) 软件的 NbClust 包完成。计算方法如式(1)所示。
式中:d为第i个断面和第j个断面欧氏距离;Xik为第i个断面的第k个水质参数值;Xjk为第j个断面的第k个水质参数值。
ArcGIS 10.7 (ESRI,Redlands,CA,USA) 作为空间分析工具,对中线干渠采样断面进行可视化处理。使用 Pesce 和 Wunderlin改进的 WQI 计算方法[14],具体公式如式(2)所示。
式中:n 为参与计算的水质指标的个数,Ci 和 Pi 分别为变量 i 的归一化值和权重[15-16]。根据之前的研究,Ci 值参考《地表水环境质量标准》 (GB 3838-2002) ,将其从 0~100 分为11个级别进行赋值[17-18],Pi的最小值和最大值分别为1和4 (表1) 。考虑到我国水质的评价标准以及本项目的水质管理情况,本研究将WQI值的分为0~100,5个等级[8, 19],分别对应水质等级从优到极差,优 (81~100) 、良 (61~80) 、中 (41~60) 、差 (21~40) 、极差 (0~20) 。
采用斯皮尔曼秩次相关法检验水质参数的变化趋势,检验结果p<0.01表示上升或者下降趋势极显著,p<0.05表示上升或下降趋势显著,否则上升或下降趋势不显著。采用皮尔逊相关分析表征不同水质参数的相关性,p<0.01表示相关性极显著,p<0.05表示相关性显著,否则相关性不显著。不同季节或渠段的浓度差异比较采用t检验,p<0.01表示差异极显著,p<0.05表示差异显著,否则差异不显著。所有统计分析均在SPSS 19.0中完成。
-
30个断面2018年水质指标的均值和标准差如表2所示,沿程变化趋势如图2所示。pH值夏秋季高于冬春季,所有断面pH值均稳定在8以上(图2(a)),总体处于弱碱性状态。NH3-N浓度春季和夏季高于秋季和冬季,所有断面NH3-N浓度均优于I类水标准(≤0.15 mg·L−1,图2(b))。F.coli自漳河北断面向北呈上升趋势(图2(c)),其数量随季节变化明显,在夏秋季节较高。CODMn夏秋季高于冬春季,沿程有上升趋势,西黑山、霸州、王庆坨、天津外环河和团城湖5个断面的CODMn浓度为Ⅱ类水标准 (2~4 mg·L−1) ,其余断面CODMn浓度均符合I类水标准(≤2 mg·L−1,图2(d)),但与2 mg·L−1比较接近。SO42−从南向北呈逐渐升高的趋势(图2(e)),其浓度随季节变化不明显。全年平均DO浓度均优于I类水标准 (7.5 mg·L−1) ,最大值出现在冬季,达到 (11.76±1.4) mg·L−1(图2(f))。BOD5浓度从南向北整体呈逐渐上升趋势(图2(g)),冬季BOD5浓度高于其他季节。WT的空间变化总体上呈自南向北递减的趋势(图2(h))。TN没有显著的空间变化和季节差异,所有断面的TN均大于1 mg·L−1,最大值出现在天津外环河,浓度值为1.32 mg·L−1(图2 (i))。TP浓度季节差异不显著,所有断面的均符合I类水标准 (≤0.02 mg·L−1) ,河北境内的TP浓度整体高于其他省份,自蒲王庄至团城湖整体呈下降趋势(图2 (j))。
-
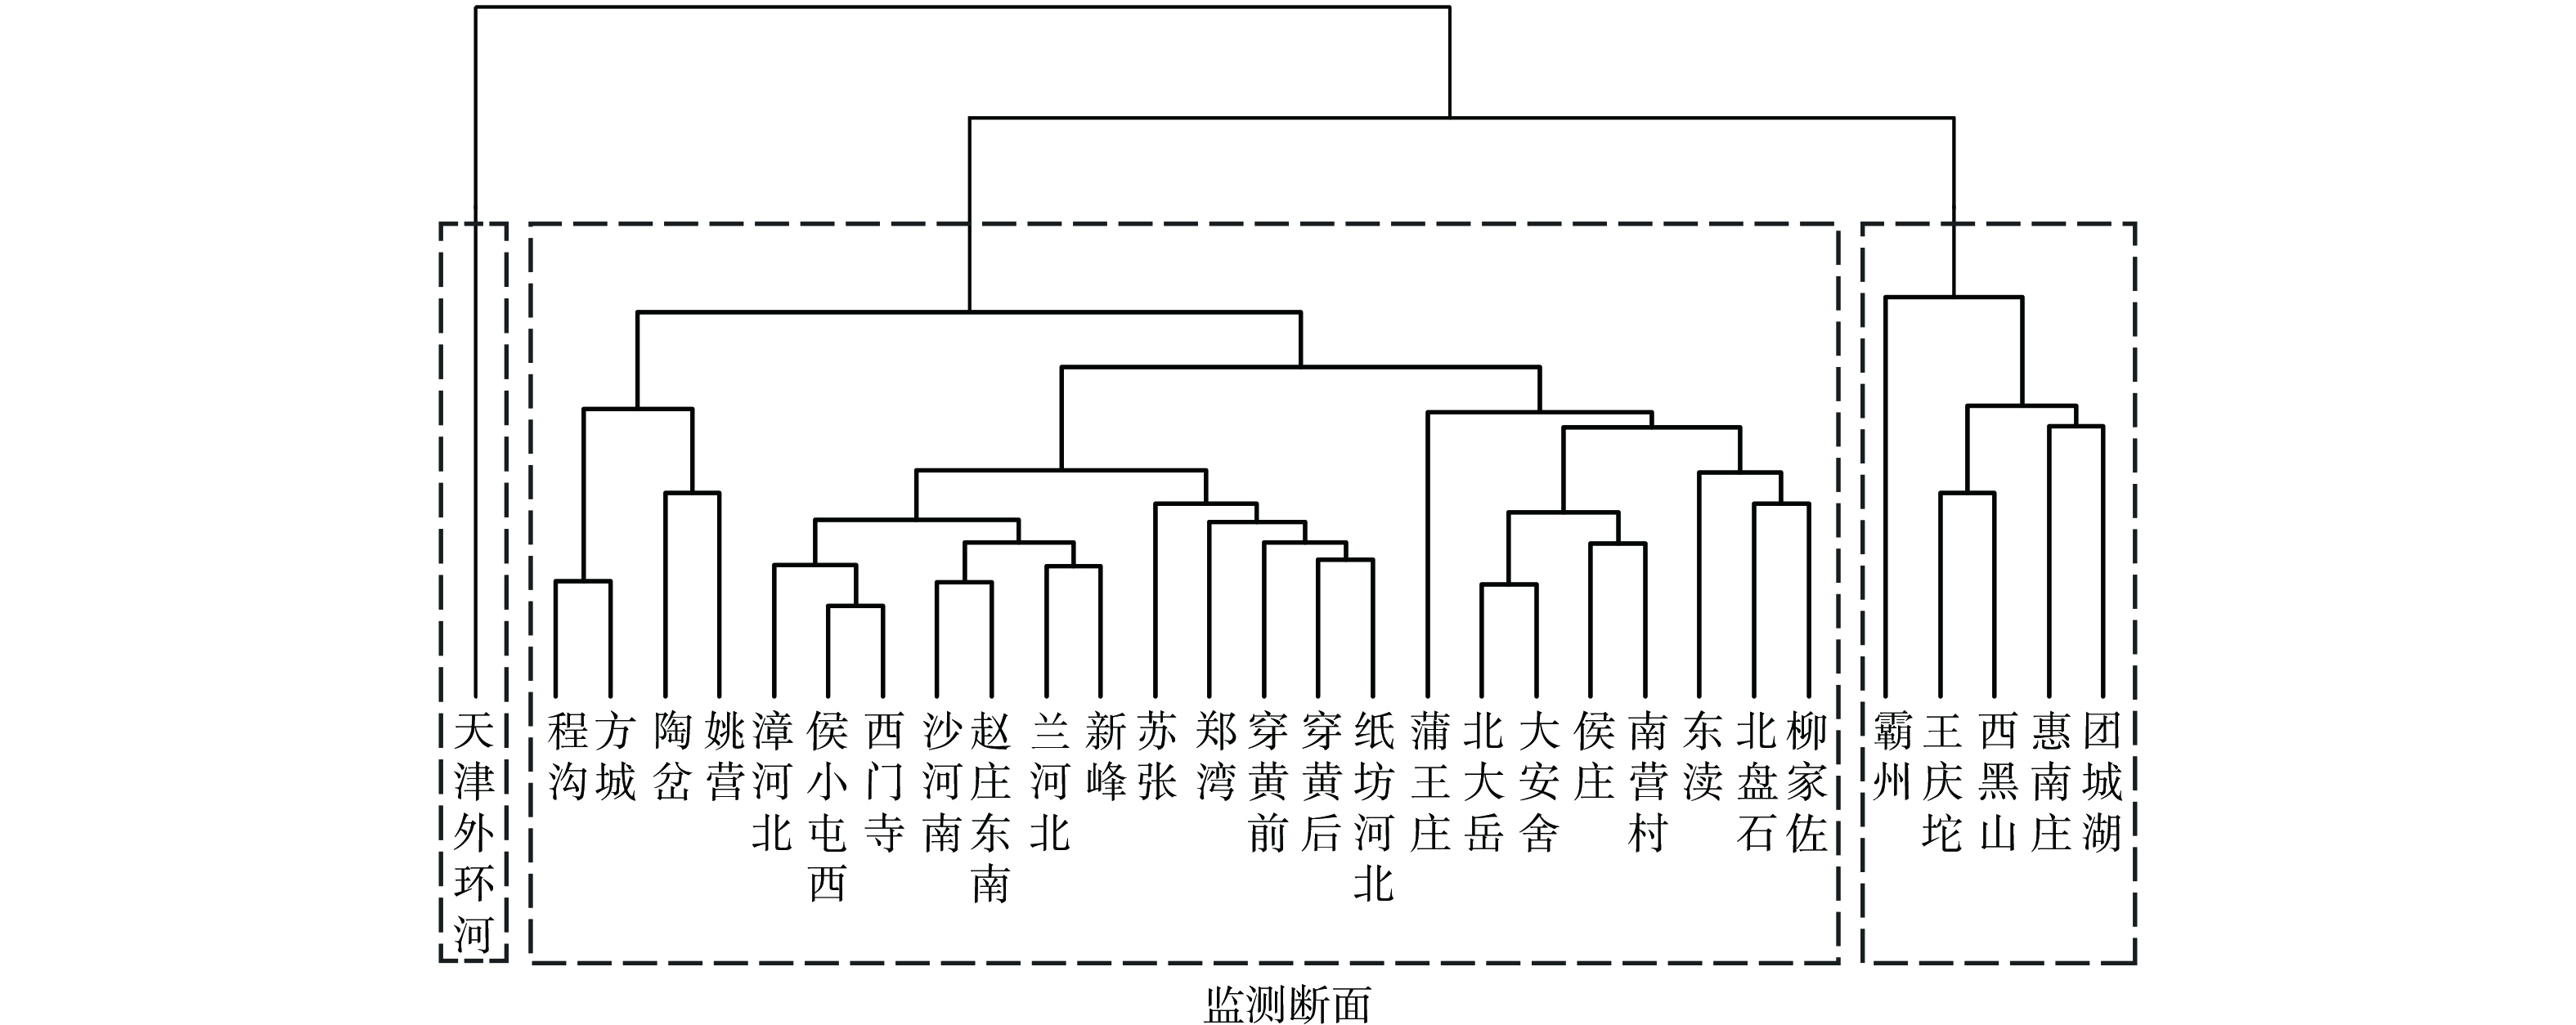
各监测断面聚类分析结果如图3所示。根据NbClust函数计算结果,最佳聚类个数为3个,因此总干渠30个监测断面共分为3个渠段。陶岔至柳家佐连续24个断面为第一渠段;霸州、王庆坨、西黑山、惠南庄和团城湖为第二渠段,天津外环河为第三渠段。第一渠段水质相对稳定,F.coli、CODMn、SO42−和DO等水质指标浓度较低;第二渠段F.coli、SO42−、CODMn和DO等指标有所升高;第三渠段TN、NH3-N和BOD5等指标浓度达到最大值,分别为(1.32±0.15)、(0.07±0.05)和(1.52±0.51) mg·L−1 (表3) 。
-
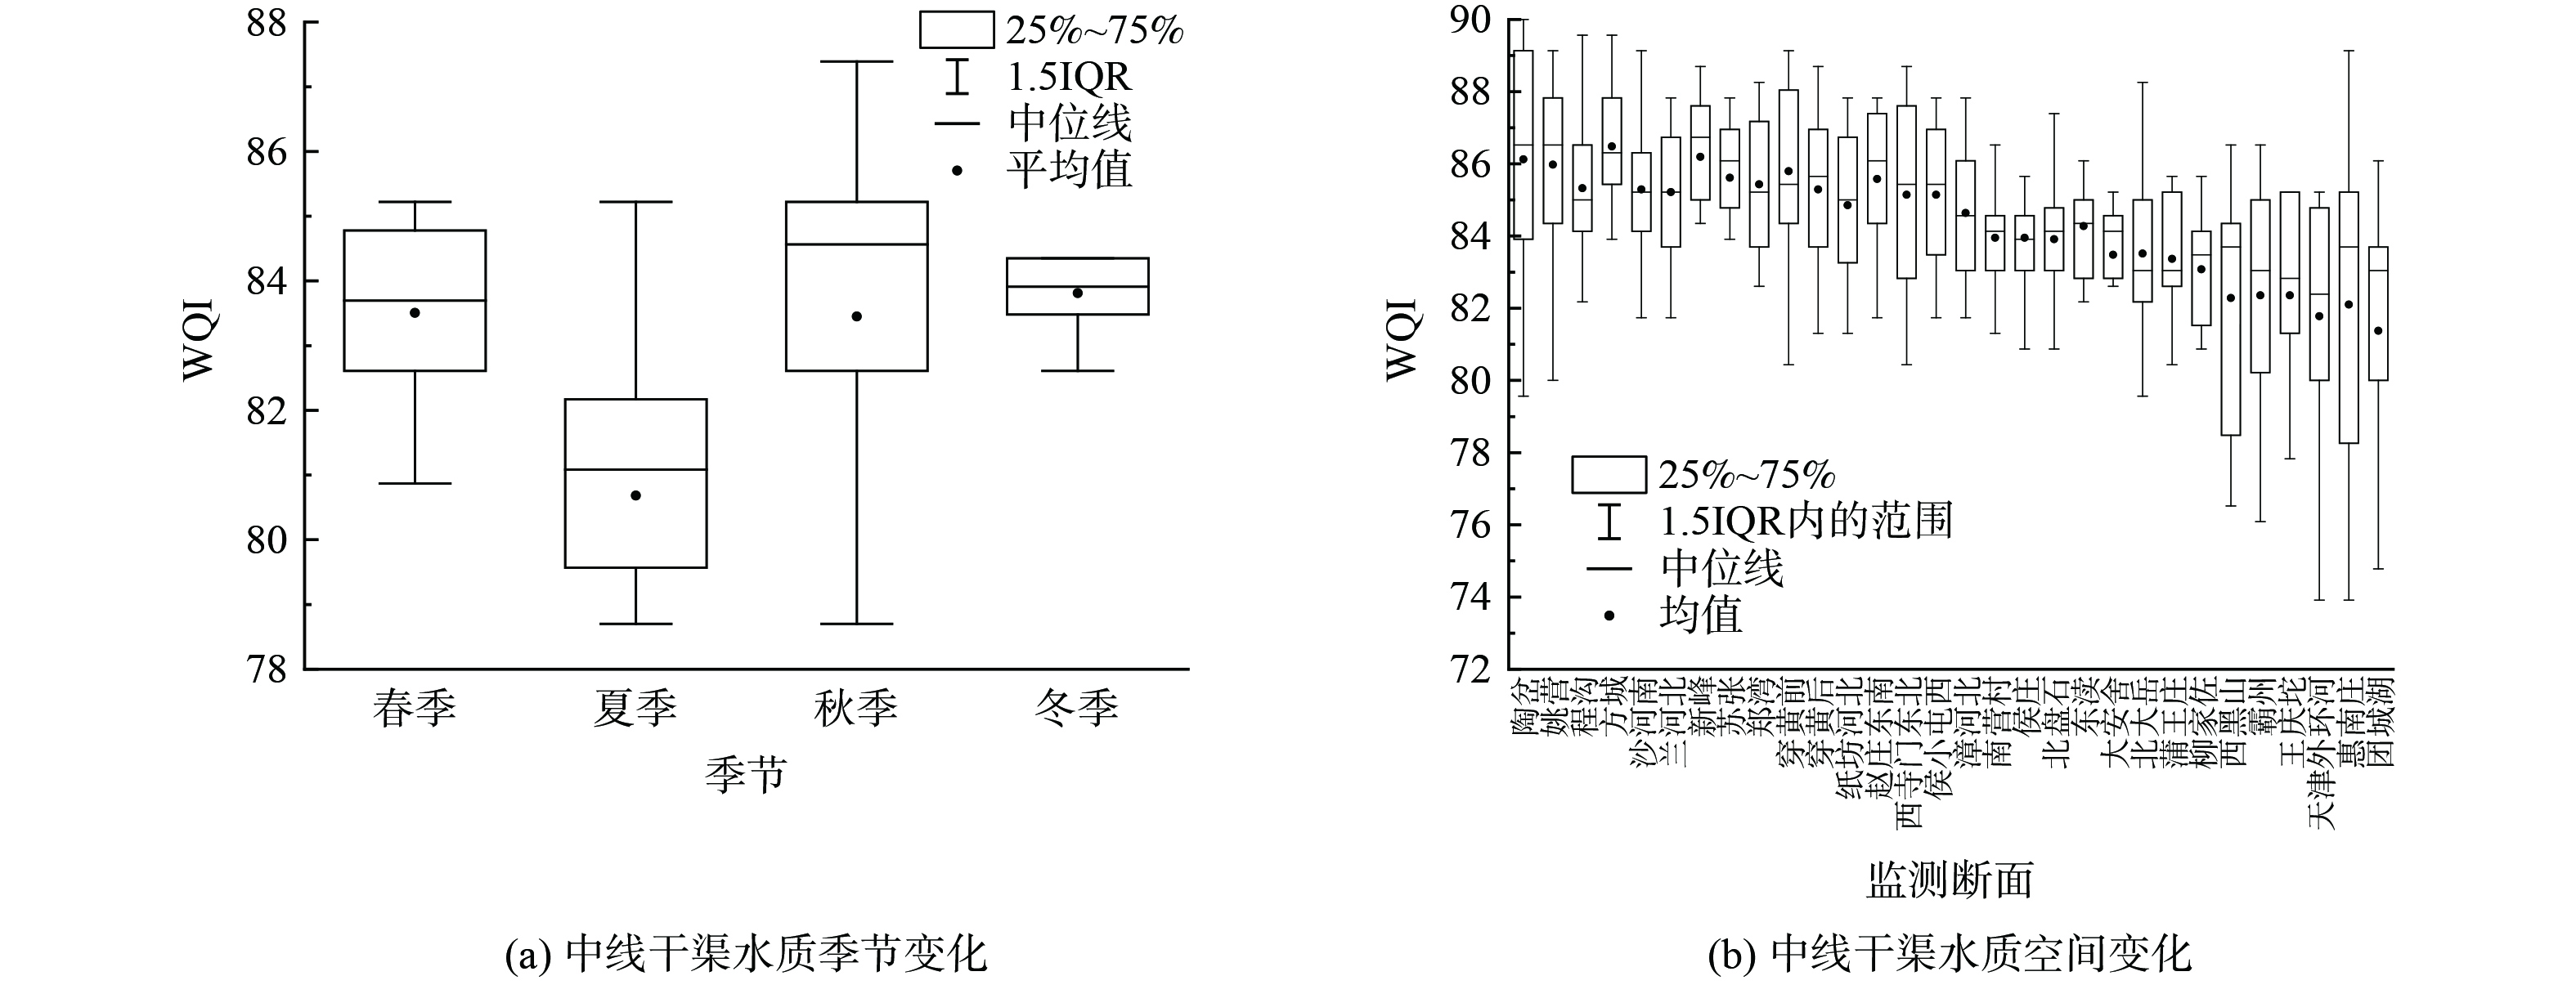
2018年南水北调中线干渠水质变化的空间分布和季节特征如图4所示。整体而言,所有监测断面WQI平均值均维持在81以上,说明中线干渠水质状况为“优”。就季节而言,夏季水质状况较差(图4(a)),此时WQI值整体低于其他季节,且有部分断面 (40%) 水质状况为“良”,其他季节水质无较大差异,均达到“优”。空间来看,渠道水质自南向北呈逐渐下降趋势(图4(b)),且第一渠段的WQI平均值整体高于第二渠段和第三渠段,第二和第三渠段所有监测断面水质状况均为“良”。
-
总干渠pH值呈弱碱性,夏季和秋季略高于冬季和春季,这主要是因为夏秋季节藻类生长相对旺盛,光合作用消耗水中二氧化碳,影响水中酸碱平衡,导致pH值升高。NH3-N在天津外环河断面明显升高,这可能是因为该断面作为天津渠段输水终点,大量藻类残体累积产生内源释放的原因。
有研究发现,F.coli数量与WT变化具有一致性,夏秋季节的高温环境会导致F.coli数量高于其他季节,而低温环境不利于F.coli的生长繁殖[8]。但总干渠F.coli沿程有升高趋势 (p<0.01) ,而WT沿程呈下降趋势 (p<0.01) ,这可能是因为人类活动是影响F.coli增殖的重要原因[20]。自漳河北依次经过河北省、天津市和北京市的人口密集地区,这些断面容易受到强烈的人类活动影响,导致其F.coli含量逐渐增加。SO42−是重要的可溶性无机盐,可以反映水体接纳污染物的情况,离子浓度越高,水体接纳的污染物越高[21]。输水渠道全线封闭,很少与外界发生物质交流,因此推测第二、三渠段SO42−浓度升高可能与渠道内的生物和物理化学过程有关[22]。夏秋季节TN浓度低于春冬季节,主要是因为在日照充足、温度较高的夏季和秋季,藻类更容易繁殖,并吸收水中的氮作为营养源,从而降低了TN浓度[3, 23]。TP浓度沿程有略微降低趋势 (p<0.05) ,可能是长距离输水过程中渠道自净的效果[24]。
渠道中DO浓度保持在较高水平,主要是因为水体复氧速度快,以及耗氧有机物含量较低[25]。Enrique Sánchez的研究结果表明,DO通常与WT呈负相关,即高温和充足的日照可能导致夏季DO浓度低于冬季[26],这与本研究的结果一致。CODMn是反映地表水有机污染程度的综合性指标[27],前16个断面的CODMn浓度呈逐渐上升趋势且夏季和秋季的CODMn浓度较高,可能是沿途藻类生长代谢产生的溶解性有机物增加导致的[28]。BOD5可以作为表征水体有机质含量的有效指标[29],渠道中前19个断面的BOD5浓度整体呈逐渐上升趋势,这与其CODMn的空间变化整体一致 (相关系数R=0.71,p<0.01) 。刘瑞祥和常惠丽研究了漳河水系浊漳河段水域WT、DO和BOD5 的相互关系,发现BOD5浓度随着WT的升高而降低。这是因为水温升高加快了生化反应,河流的自净能力增强,导致BOD5浓度降低,而在冬季温度较低时生化反应速度减慢,河流自净能力同时也在减弱,BOD5 浓度升高[30]。
聚类结果反映出输水渠道类型对水质的影响。第一渠段主要为明渠,水流速度快,溶氧充足,自净能力强,因此各项指标均处于较低水平。渠道光照充分,藻类生长可能对水质指标产生影响。以往的研究表明,CODMn和叶绿素与藻细密度为显著正相关关系,藻类生物量聚集也会明显增加颗粒态有机物,造成耗氧有机物指标CODMn增加[31-32]。长距离的输水过程不仅是藻类的输送,也是藻类更新与死亡的过程。藻类与其他微生物的死亡降解,造成了CODMn沿程增加。第二渠段主要为管道或者暗涵,光照减少,藻类的光合作用降低,藻类死亡代谢过程导致有机物含量增加以及微生物的生长,因此CODMn和F.coli相比于第一渠段有所升高 (p<0.01) 。但第二渠段溶解氧出现升高,这可能是水温降低导致饱和溶解氧含量增加的原因。第三渠段天津外环河断面作为天津段的终点,水体不再流动,水中携带的浮游生物残骸和悬浮物开始沉降分解产生较强的内源释放[33],因此TN、NH3-N和BOD5等指标浓度达到最大值。根据聚类分析结果,管道、暗涵和渠道末端可能更容易出现水质问题,水质管理过程中应予以重视。
中线干渠水质状况总体为“优”,与其他学者的研究结果一致[8]。就季节而言,夏季的水质风险高于其他季节。封闭的渠道结构虽然避免了其他径流和大部分人类活动的影响,但仍有降雨、降尘以及大风天气带来的其他物质进入渠道,同时到本身的藻类生长代谢、局部区域的淤积物释放等因素也会形成污染物的输入。这些外源污染和渠道内源污染的共同作用导致渠道水质随着输水距离逐渐降低。因此建议加强调查和监督,控制中线干渠沿线高密度人类活动区域内的城市和工业生产造成的风险源,并采取相应的治理措施,减少降雨径流、大气降尘,以及藻类和淤积物对水质的影响。
-
1) 总干渠所有指标均符合I~II类水质要求。季节变化方面,pH、F.coli、CODMn夏秋季高于冬季;沿程变化方面,TN和TP沿程浓度变化趋势不明显,SO42−、DO、和BOD5整体呈沿程逐渐升高的趋势,NH3-N浓度在天津外环河断面显著升高。
2) 层次聚类根据中线干渠各个断面不同的水质指标特征,将中线干渠分为3个渠段。陶岔至柳家佐连续24 个断面为第一渠段;霸州、王庆坨、西黑山、惠南庄和团城湖为第二渠段,天津外环河为第三渠段。F.coli、CODMn、SO42−和DO等水质指标浓度在第一渠段相对较低,在第二渠段有所升高,TN、NH3-N和BOD5浓度在第三渠段达到最大值。
3) WQI计算结果显示,南水北调中线干渠水质状况总体优良。夏季WQI平均值最小 (81) ,低于春季 (84) 、秋季 (83) 和冬季 (84) 。随着输水距离的增加,WQI平均值总体呈逐渐降低的趋势。
基于层次聚类和水质指数法的南水北调中线总干渠典型年份水质变化特征分析
Characteristics of water quality change in the canal of middle route project of South-to-North Water Diversion in typical years based on hierarchical clustering and water quality index method
-
摘要: 为探明南水北调中线总干渠水质变化特征和时空分异规律,选择总干渠典型年份30 个断面 10 个水质指标的逐月监测数据,利用层次聚类和WQI水质指数法对水质变化进行分析。层次聚类将总干渠划分为3个渠段,陶岔至柳家佐连续24个断面为第一渠段,该渠段各项水质指标浓度相对较低,其中F.coli ( (44.41±56.11) 个·L−1) 、CODMn ( (1.94±0.11) mg·L−1) 、SO42− ( (29.38±1.68) mg·L−1) 和DO ( (9.74±1.42) mg·L−1) 等指标明显低于其他渠段;霸州、王庆坨、西黑山、惠南庄和团城湖为第二渠段,F.coli ( (184.5±323.16) 个·L−1) 、CODMn ( (2.08±0.29) mg·L−1) 、SO42− ( (27.21±1.81) mg·L−1) 和DO ( (10.82±2.15) mg·L−1) 等水质指标浓度有所升高;天津外环河为第三渠段,该渠段TN、NH3-N和BOD5浓度达到最大值,分别为(1.32±0.15)、(0.07±0.05) 和(1.52±0.51) mg·L−1) 。WQI计算结果表明,中线干渠WQI平均值在81~86之间,水质优良;夏季WQI平均值最低 (81) ,低于春季 (84) 、秋季 (83) 和冬季 (84) ,且WQI平均值沿程逐渐降低。该研究结果可为中线工程水质保护和管理提供理论依据。Abstract: In order to investigate the characteristics and spatiotemporal differentiation of water quality in the middle route of the South-to-North Water Diversion project. The monthly monitoring data of 10 water quality indexes in 30 sections of the main canal in typical years were selected, and the variation of water quality was analyzed by hierarchical clustering and WQI water quality index method. The main canal was divided into 3 types of water quality canal segments by hierarchical clustering. The 24 sections from Taocha to Liujiazuo were the first section,and the concentration of water quality indexes in this section was relatively low, the indexes of F.coli ((44.41±56.11) colonies·L−1), CODMn ((1.94±0.11) mg·L−1), SO42− ((29.38±1.68) mg·L−1) and DO ((9.74±1.42) mg·L−1) were lower than those of other canals. Bazhou, Wangqingtuo, Xiheishan, Huinanzhuang and Tuancheng Lake were the second type of canals. Compared with the first type of canals, the concentrations of water quality indexes such as F.coli ((184.5±323.16) colonies·L−1), CODMn ((2.08±0.29) mg·L−1), SO42− ((27.21±1.81) mg·L−1) and DO ((10.82±2.15) mg·L−1) increased. Tianjin Waihuan River is the third type of canal section, and the concentrations of TN, NH3-N and BOD5 in this section reached the maximum values, which were ((1.32±0.15) mg·L−1), ((0.07±0.05) mg·L−1) and ((1.52±0.51) mg·L−1), respectively. The results of WQI calculation showed that, the average value of WQI was between 81 and 86, and the water quality was good. The mean value of WQI in summer was the lowest (81), lower than that in spring (84), autumn (83) and winter (84), and the mean value of WQI gradually decreased along the way. The research results can provide theoretical basis for water quality protection and management of the Middle Route Project.
-

-
表 1 水质指标的权重值 (Pi) 和归一化值 (Ci)
Table 1. Weight Value (Pi) and Normalized Value (Ci) of Water Quality Index
水质指标 权重Pi 归一化值Ci 100 90 80 70 60 50 40 30 20 10 0 水温(WT)/ ℃ 1 21/16 22/15 24/14 26/12 28/10 30/5 32/0 36/-2 40/-4 45/-6 45/<-6 pH 1 7 7-8 7-8.5 7-9 6.5-7 6-9.5 5-10 4-11 3-12 2-13 1-14 溶解氧(DO)/ (mg·L−1) 4 ≥7.5 >7 >6.5 >6 >5 >4 >3.5 >3 >2 ≤1 <1 硫酸盐(SO42−)/ (mg·L−1) 2 <25 <50 <75 <100 <150 <250 <400 <600 <1 000 ≤1 500 >1 500 总磷(TP)/(mg·L−1) 1 <0.2 <1.6 <3.2 <6.4 <9.6 <16 <32 <64 <96 ≤160 >160 氨氮(NH3-N)/(mg·L−1) 3 <0.01 <0.05 <0.1 <0.2 <0.3 <0.4 <0.5 <0.75 <1 ≤1.25 >1.25 高锰酸盐指数(CODMn)/(mg·L−1) 3 <1 <2 <3 <4 <6 <8 <10 <12 <149 ≤15 >15 总氮(TN)/ (mg·L−1) 2 <0.8 <3.8 <7.5 <13 <18 <27 <48 <85 <149 ≤265 >265 五日生化需氧量(BOD5)/(mg·L−1) 3 <0.5 <2 <3 <4 <5 <6 <8 <10 <12 ≤15 >15 粪大肠菌群(F.coli)/(个·L−1) 3 <5 <50 <100 <200 <300 <400 <500 <700 <1 000 ≤1 400 >1 400 表 2 2018年中线干渠水质参数季节变化
Table 2. Seasonal changes of middle route canal water quality parameters in 2018
水质指标 春季 夏季 秋季 冬季 pH 8.19±0.16 8.29±0.24 8.39±0.15 8.14±0.18 NH3-N/(mg·L−1) 0.05±0.02 0.05±0.02 0.03±0.02 0.03±0.01 F.coli/(个·L−1) 19.11±18.21 115.44±175.04 127.06±234.34 18.06±19.31 CODMn/(mg·L−1) 1.94±0.11 2.03±0.16 2.02±0.2 1.88±0.16 SO42−/(mg·L−1) 28.81±1.4 28.22±1.39 25.52±1.39 28.09±1.79 DO/(mg·L−1) 9.93±1.34 8.67±0.73 9.44±1.32 11.76±1.4 BOD5/(mg·L−1) 0.9±0.49 0.81±0.4 0.92±0.45 1.21±0.49 WT/(℃) 14.57±5.12 27.29±3.13 21.61±4.73 6.79±3.89 TN/(mg·L−1) 1.27±0.14 1.22±0.15 1.12±0.13 1.26±0.16 TP/(mg·L−1) 0.01±0.004 0.01±0.010 0.01±0.004 0.01±0.004 表 3 中线干渠不同渠段水质参数变化
Table 3. Changes of water quality parameters in different sections of the middle route canal
水质指标 第一类渠段 第二类渠段 第三类渠段 pH 8.25±0.23 8.25±0.05 8.23±0.08 NH3-N/ (mg·L−1) 0.04±0.01 0.04±0.02 0.07±0.05 F.coli/ (个·L−1) 44.41±56.11 184.50±323.16 109.17±197.02 CODMn/ (mg·L−1) 1.94±0.11 2.08±0.29 2.09±0.32 SO42−/ (mg·L−1) 27.21±1.68 29.38±1.81 29.91±2.46 DO/ (mg·L−1) 9.74±1.42 10.82±2.15 10.76±2.57 BOD5/ (mg·L−1) 0.91±0.45 1.11±0.48 1.52±0.51 WT/ ℃ 17.69±8.42 17.06±10.13 16.95±10.01 TN/ (mg·L−1) 1.22±0.16 1.18±0.11 1.32±0.15 TP/ (mg·L−1) 0.01±0.005 0.01±0.003 0.01±0.004 -
[1] HE C S, HE X S, FU L. China's South‐to‐North Water Transfer Project: Is it Needed?[J]. Geography Compass, 2010, 4(9): 1312-1323. doi: 10.1111/j.1749-8198.2010.00375.x [2] BARNETT J, ROGERS S, WEBBER M, et al. Sustainability: Transfer project cannot meet China’s water needs[J]. Nature, 2015, 527(7578): 295-297. doi: 10.1038/527295a [3] LI Y Y, KHAN F H, WU J M, et al. Drivers of Spatiotemporal Eukaryote Plankton Distribution in a Trans-Basin Water Transfer Canal in China[J]. Frontiers in Ecology and Evolution, 2022, 10: 899993. doi: 10.3389/fevo.2022.899993 [4] CHEN Z J, YUAN J, SUN F, et al. Planktonic fungal community structures and their relationship to water quality in the Danjiangkou Reservoir, China[J]. Scientific Reports, 2018, 8(1): 10596. doi: 10.1038/s41598-018-28903-y [5] 闫雪燕, 张鋆, 李玉英, 等. 动态调水过程水文和理化因子共同驱动丹江口水库库湾浮游植物季节变化[J]. 湖泊科学, 2021, 33(5): 1350-1363. [6] 郭勇勇, 华江环, 朱宇轩, 等. 南水北调中线总干渠水中重金属含量及风险评价[J]. 水生生物学报, 2022, 46(7): 995-1006. [7] 韩晓刚, 黄廷林, 陈秀珍. 改进的模糊综合评价法及在给水厂原水水质评价中的应用[J]. 环境科学学报, 2013, 33(5): 1513-1518. [8] PESCE S F, WUNDERLIN D A. Use of water quality indices to verify the impact of Córdoba City (Argentina) on Suqua River[J]. Water Research, 2000, 34(11): 2915-2926. doi: 10.1016/S0043-1354(00)00036-1 [9] NONG X Z, SHAO D G, XIAO Y, et al. Spatio-temporal characterization analysis and water quality assessment of the South-to-North Water Diversion Project of China[J]. International Journal of Environmental Research and Public Health, 2019, 16(12): 2227. doi: 10.3390/ijerph16122227 [10] 朱长军, 赵方星, 李步东, 等. 基于主成分分析及WQI_(min)的大黑汀水库水质评价[J]. 河南师范大学学报(自然科学版), 2021, 49(3): 52-58. [11] 耿姣, 王洋, 胡术刚, 等. 基于WQI的平原河网地区河流水质评价与时空变化分析[J]. 环境工程, 2023, 41(6): 187-193. [12] 杨列, 闫霄珂, 刘艳丽, 等. 基于WQI_(min)模型的武汉市金银湖水质时空特性[J]. 长江科学院院报, 2022, 39(4): 49-55. [13] 张春梅, 朱宇轩, 宋高飞, 等. 南水北调中线干渠浮游植物群落时空格局及其决定因子[J]. 湖泊科学, 2021, 33(3): 675-686. [14] NONG X Z, SHAO DG, ZHONG H, et al. Evaluation of water quality in the South-to-North Water Diversion Project of China using the water quality index (WQI) method[J]. Water Research, 2020, 178: 115871. [15] KOCER T A M, SEVGILI H. Parameters selection for water quality index in the assessment of the environmental impacts of land-based trout farms[J]. Ecological Indicators, 2014, 36: 672-681. doi: 10.1016/j.ecolind.2013.09.034 [16] 万军芳, 郭新超, 胡恩, 等. 基于WQI和TLI的渭河关中流域城市典型坝控景观河道水质评价[J]. 环境工程, 2022, 40(2): 66-70. [17] SHAH J, IHSAN U, SARDAR K, et al. Evaluation of the Swat River, Northern Pakistan, water quality using multivariate statistical techniques and water quality index (WQI) model[J]. Environmental Science and Pollution Research International, 2020, 27(31): 38545-38558. doi: 10.1007/s11356-020-09688-y [18] WU Z S, WANG X L, CHEN Y W, et al. Assessing river water quality using water quality index in Lake Taihu Basin, China[J]. Science of the Total Environment, 2018, 612: 914-922. doi: 10.1016/j.scitotenv.2017.08.293 [19] 赵爽, 倪兆奎, 黄冬凌, 等. 基于WQI法的鄱阳湖水质演变趋势及驱动因素研究[J]. 环境科学学报, 2020, 40(1): 179-187. [20] AVIGLIANO E S N F. Human health risk assessment and environmental distribution of trace elements, glyphosate, fecal coliform and total coliform in Atlantic Rainforest mountain rivers (South America)[J]. Microchemical Journal:Devoted to the Application of Microtechniques in all Branches of Science, 2015, 122: 149-158. [21] 徐华山, 赵磊, 孙昊苏, 等. 南水北调中线北京段水质状况分析[J]. 环境科学, 2017, 38(4): 1357-1365. [22] 罗莎莎, 万国江. 云贵高原湖泊沉积物一水界面铁、锰、硫体系的研究进展[J]. 地质地球化学, 1999(3): 47-52. [23] YANG Y, GAO B, HAO H, et al. Nitrogen and phosphorus in sediments in China: A national-scale assessment and review[J]. Science of the Total Environment, 2017, 576(15): 840-849. [24] SHEN H, CAI Q, ZHANG M. Spatial gradient and seasonal variation of trophic status in a large water supply reservoir for the South-to-North Water Diversion Project, China[J]. Journal of Freshwater Ecology, 2015, 30(2): 249-261. doi: 10.1080/02705060.2014.935748 [25] RAJIV D K, MUNISAMY G. Anthropogenic activity-induced water quality degradation in the Loktak lake, a Ramsar site in the Indo-Burma biodiversity hotspot[J]. Environmental Technology, 2017, 40(17): 2232-2241. [26] SANCHEZ E, COLMENAREJO M F, VICENTE J, et al. Use of the water quality index and dissolved oxygen deficit as simple indicators of watersheds pollution[J]. Ecological Indicators, 2007, 7(2): 315-328. doi: 10.1016/j.ecolind.2006.02.005 [27] YANG D, ZHENG L, SONG W. Evaluation indexes and methods for water quality in ocean dumping areas: International Conference on Waste Management and Technology[C], 2013. [28] WANG C, ZHANG H, LEI P, et al. Evidence on the causes of the rising levels of CODMn along the middle route of the South-to-North Diversion Project in China: The role of algal dissolved organic matter[J]. Journal of Environmental Sciences, 2022, 113: 281-290. doi: 10.1016/j.jes.2021.06.003 [29] LEE J, LEE S, YU S, et al. Relationships between water quality parameters in rivers and lakes: BOD5, COD, NBOPs, and TOC[J]. Environmental Monitoring and Assessment, 2016, 188(4): 251-252. doi: 10.1007/s10661-016-5246-y [30] 刘瑞祥, 常惠丽. 漳河水系浊漳河段水域水温、DO、BOD5值特征分析[J]. 晋东南师范专科学校学报, 1999(3): 35-37. [31] 张运林, 张毅博, 李娜, 等. 利用陆基高光谱遥感捕捉太湖蓝藻水华日内快速变化过程[J]. 湖泊科学, 2021, 33(6): 1951-1960. [32] 黄向阳, 艾孙阳, 何鑫, 等. 河流型水库浮游植物群落特征及环境因子关系研究[J]. 水生态学杂志, 2023: 1-17. [33] 王志齐, 刘新星, 姚志宏, 等. 丹江口水库氮磷内源释放对比[J]. 环境科学, 2019, 40(11): 4953-4961. -


 下载:
下载:


