-
江南平原河网地区地势平坦、水资源丰富、人类开发活动高度密集[1],是我国经济核心区域之一,同时也是河网最密集的地区之一[2]。近年来,随着经济迅速发展与城市化水平的提高,大量生活、工农业污染物进入水体,平原河流区域生态水平普遍降低,亟待治理[3]。
水环境容量是指在给定水文条件,确定排污方式和功能目标的前提下,水域所能容纳污染物的最大负荷量[4],这与国外使用的“Total maximum daily loads (TMDL) ” “Environment capacity”有着相似的含义[5]。早在20世纪70年代水环境容量概念引入中国,随着研究的不断深入,如今逐渐形成了公式法[6]、不确定分析法[7]、非均匀系数法[8]等计算方法,但具有一定局限性。随着水环境数学模型及计算机技术的发展,国内外学者大多基于SWMM[9-10]、SWAT[11-12]、EFDC[13]、WASP[14-15]、GIS[16]、MIKE[17-18]等模型,综合考虑实际水力学、地形地貌等自然因素,以模拟水体污染物的时空演变规律。江南平原河网水系具有水流方向不定、产流汇流过程复杂[19]、污染负荷高且分布分散等特点使水环境容量呈现动态变化,然而当前对这变化过程及变化幅度研究较少,传统水环境容量计算方法忽略了水文条件动态变化对水环境容量的影响,水环境容量的准确性不足,亟待开展基于水动力水质模型的动态水环境容量研究。
本研究选取江南平原河网地区典型代表宜兴市官林镇为研究对象,选取化学需氧量 (COD) 、氨氮 (NH3-N) 、总磷 (TP) 3个水质指标作为研究目标,基于MIKE11模型,构建官林镇平原河网水质模型,计算满足水质目标的官林镇各控制单元逐月动态水环境容量,为流域水环境保护与管理提供依据,同时选取控制单元代表河道,通过探究影响动态水环境容量的关键要素,旨在为江南平原地区类似流域水体污染治理提供技术支持和创新思路。
-
官林镇 (北纬31°34’~31°24’,东经119°38’~119°47’) 位于宜兴西北部,是无锡地区首个千亿级涉农乡镇,工业发达、人口众多。其地处滆湖西畔,地势平坦,属于长江中下游水系的湖沼平原,区域内河流密布、湖荡相连,共有市级河道5条、镇级河道18条,村级河道241条,总长348.47 km,为典型的江南平原河网地区。
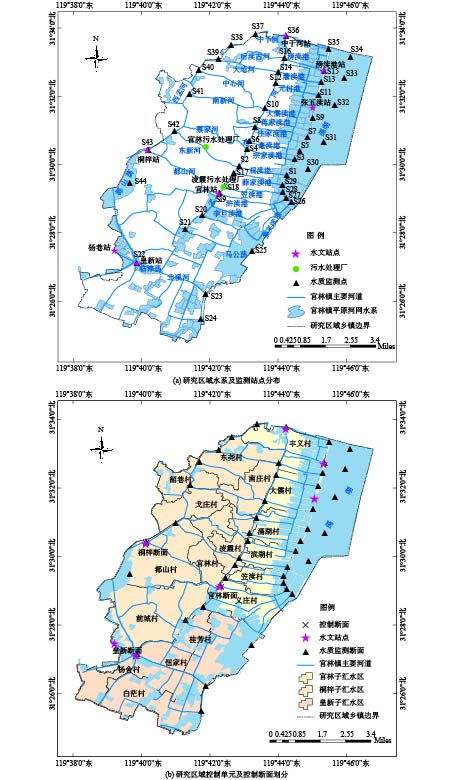
控制单元是我国流域空间管理的基础单位,本研究以水环境功能区划、行政区划及流域边界为基础,综合考虑水质监测断面设置、水文站点、点面源污染等因素,以村级行政区作为控制单元的基本组成,以官林、桐梓和皇新为控制断面,将官林镇河网分为官林、桐梓和皇新3个控制单元汇流区,其中桐梓控制单元水质要求达到地表水水质标准Ⅳ类,皇新和官林控制单元要求达到Ⅲ类水质标准。研究区域水系监测点及控制单元划分见图1、表1。
-
2022年官林镇水体水质监测显示,COD、NH3-N和TP平均浓度介于Ⅲ类水至劣Ⅴ类水之间,其中滆湖水质污染最严重,不满足Ⅲ类水质要求,TP最大超标倍数为12倍,断面超标率为93.75%,官林控制单元COD和TP断面超标率均超过40%。因此为更精确地对污染物总量排放进行控制,需对官林镇分区段计算水环境容量,研究区域水质现状见表2。
-
为更好的分析官林镇平原河网整体水环境现状,水质监测点设置在滆湖及官林镇河网主干河道河口处,共计44个,于2022年每月开展监测。采样时为消除河道边际效应的影响,用有机玻璃采水器 (WB-PM,北京普力特仪器有限公司) 于河道中部水面下0.5 m处采集水样,分装500 mL于聚乙烯储存瓶保存,于24 h内完成水质测定。水体COD、NH3-N和TP分析方法参考国标进行测定,其中COD采用快速消解分光光度法 (HJ/T 399-2007) ,NH3-N采用纳氏试剂分光光度法 (HJ 535-2009) ,TP采用钼酸铵分光光度法 (GB/T 11893-1989) 。
-
本研究水质目标来源于《江苏省水环境功能区划》,7个水文监测站点的逐时水位数据来源于宜兴市水利局和水文局,河道沿线排污口数据、点源与非点源污染的数据来源于宜兴市环境数据统计。
-
水动力模块是MIKE11模型的核心模块,该模块建立在基于垂直积分的物质和动量守恒方程,即一维非恒定流圣维南方程的基础上。圣维南方程可以从物理机制上描述河流或河口的水文运动规律,其方程主要包括连续性方程与动量方程[20]见式(1)、式(2)。
式中:x为空间变量;t为时间变量;Q为断面流量;h为水位;A为断面面积;R为水力半径;BS为水面宽度;q为旁侧入河流量;C为谢才系数;g为重力加速度;α为垂向速度分布系数。
MIKE11 AD模块是以水动力模块生成的水质流场条件为基础,通过求解水体中较大浓度梯度污染物的一维对流扩散方程模拟水质污染物迁移的模块。AD模块的一维对流扩散方程[21] 见式(3)。
式中:C为模拟的物质浓度;u为河段平均流速;Ex为扩散系数;K为模拟物质的衰减系数;x为空间变量;t为时间变量。
-
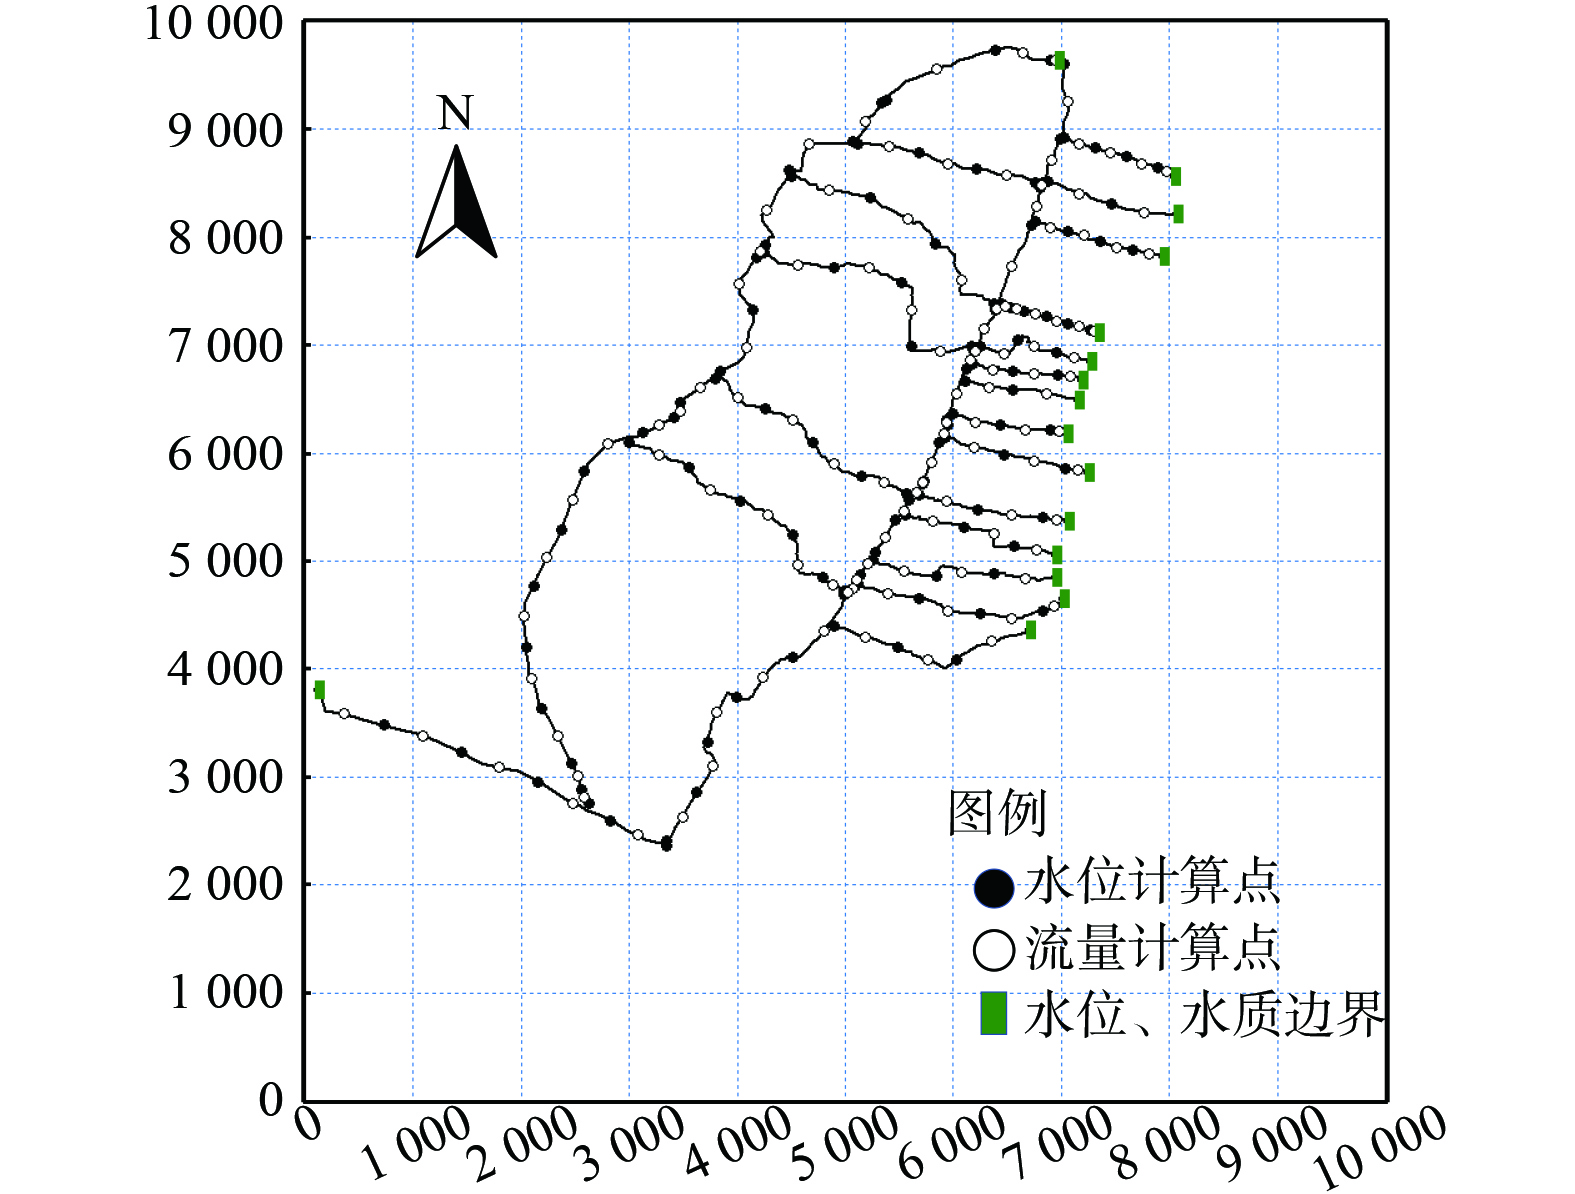
1) 河网概化。河网概化的核心原则在于经过概化处理后的河网必须准确地体现自然河网的基本水力特征,这意味着概化后的河网输水过流能力与调蓄能力方面应与实际天然河网相一致[22]。根据研究区域的实际情况,以官林镇河网主干河道为主,不考虑水流量小且对河网影响小的支流,计算模型中共概化河道23条,河道断面间距取500 m,计算节点 (水位、流量计算点) 共314个。河道概化见图2。
2) 模型边界条件。模型的边界条件采用2022年中干河站、杨巷站、滂渎港站、张五渎站逐时水位数据;采用2022年官林镇各监测断面的实测水质数据作为水质边界条件。
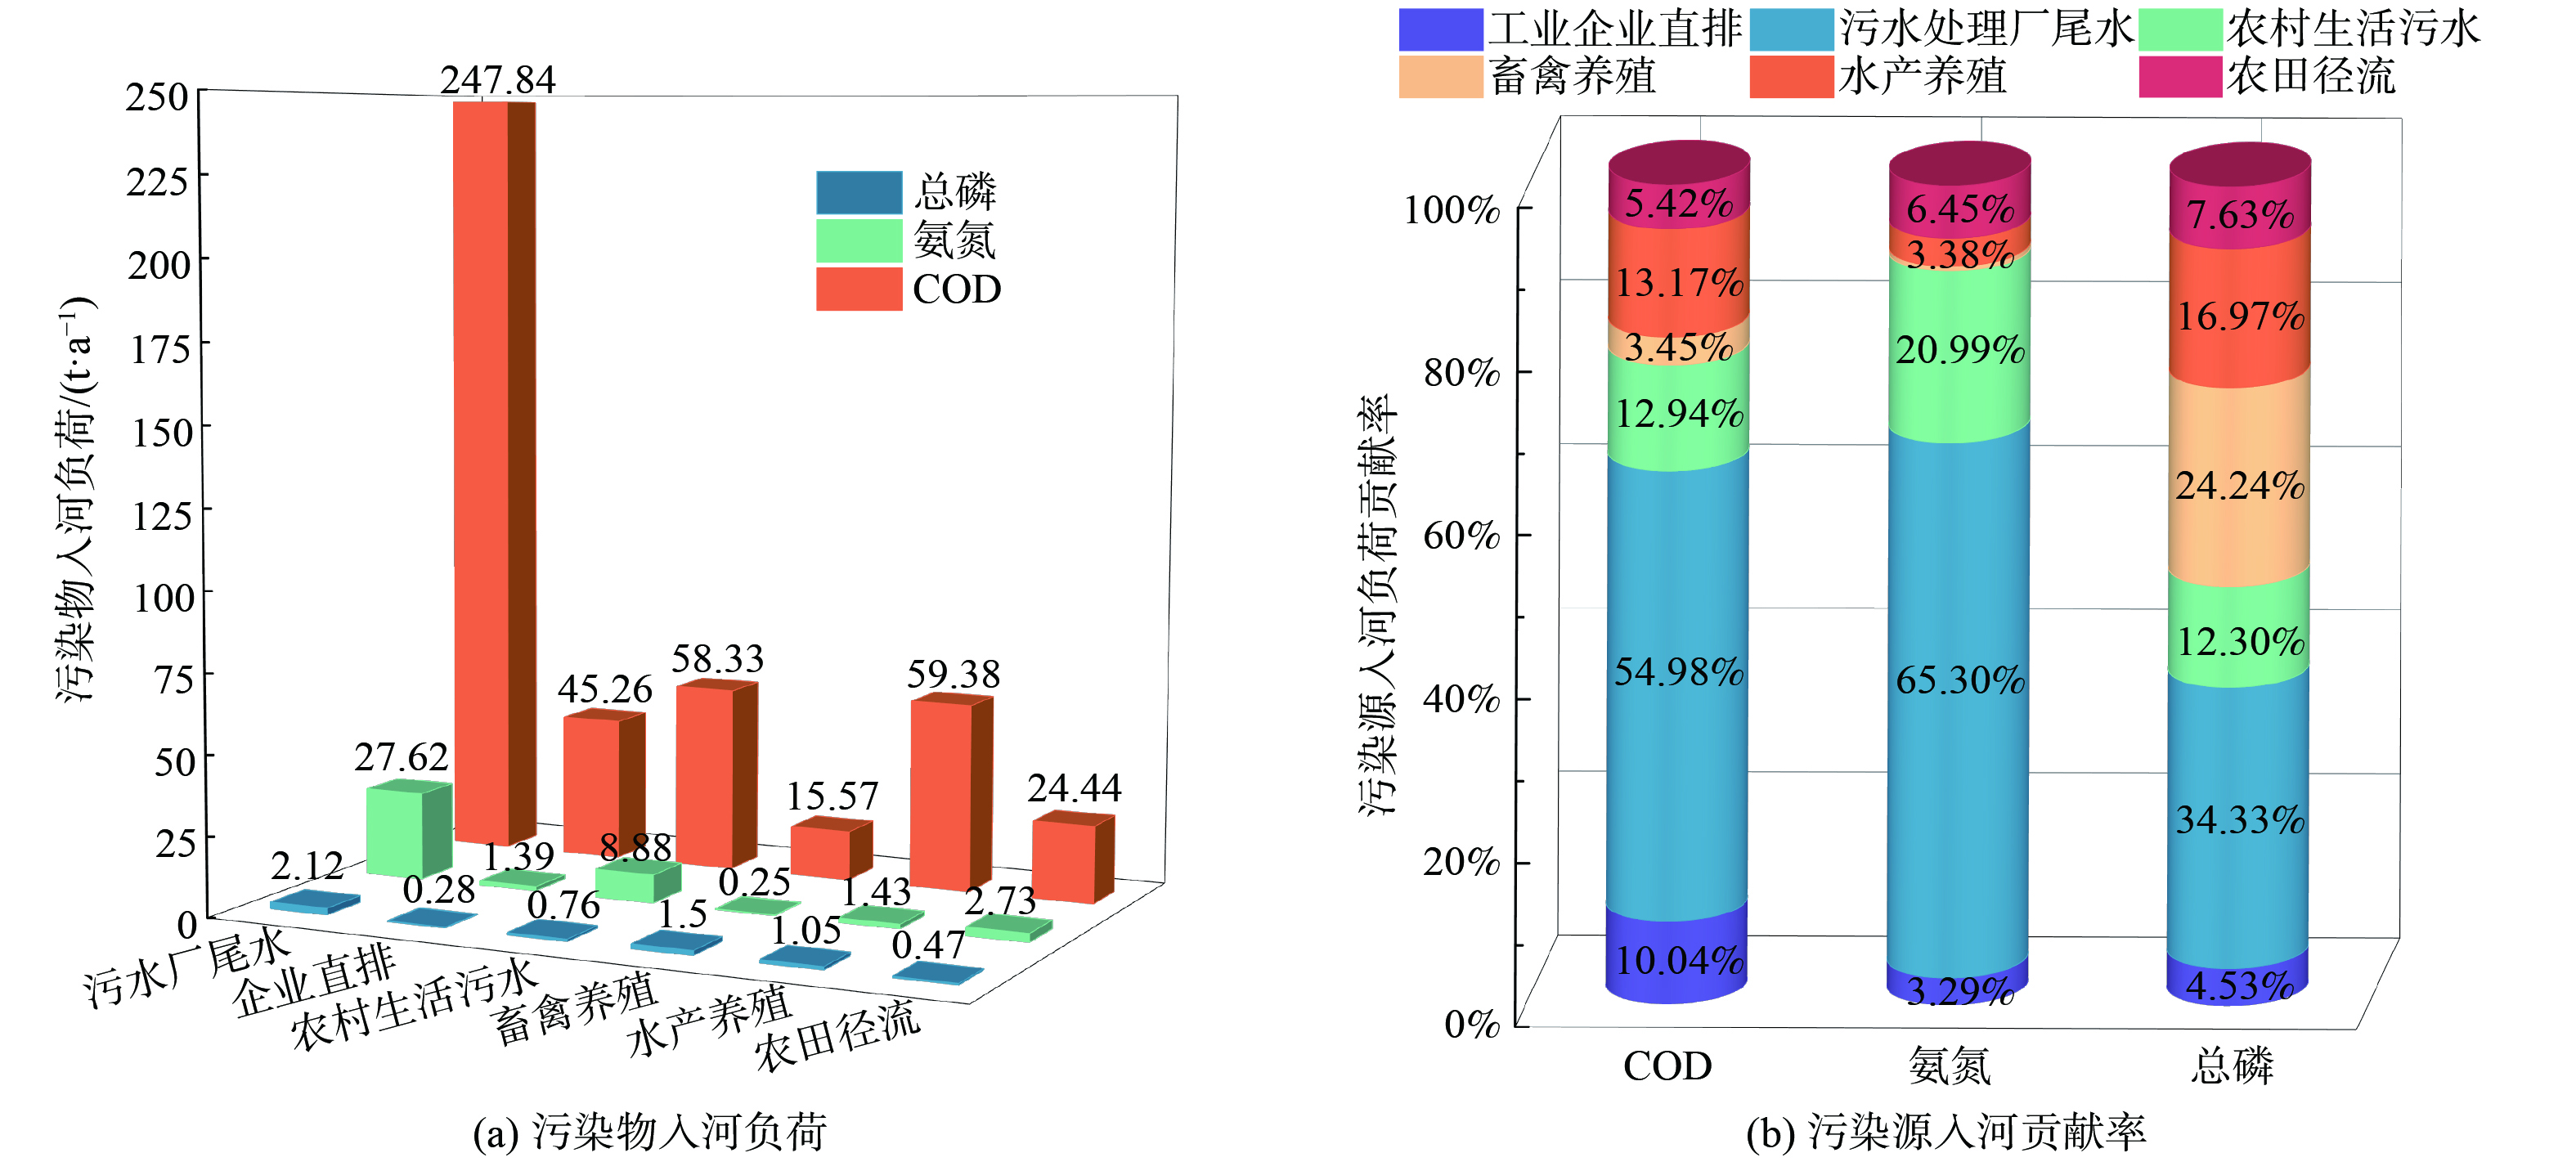
3) 研究区域污染负荷排放情况。根据宜兴市环境数据统计及Johns输出系数模型[23]估算官林镇污染负荷排放量。官林镇点源污染主要包括污水处理厂尾水及工业企业直排废水,其中COD入河量320.10 t∙a−1、NH3-N入河量29.01 t∙a−1、TP入河量2.40 t∙a−1。面源污染主要来源于农村生活污水、畜禽水产养殖污染以及农田径流带来的污染,其中COD入河量157.72 t∙a−1、NH3-N入河量13.29 t∙a−1、TP入河量3.78 t∙a−1,具体负荷分布占比见图3。
-
依据2022年实测水文水质数据,运用经验法及人工试错法对研究区域河网的HD模块及AD模块进行率定,考虑到官林镇河网主干河道水文特征,将官林镇河网分为4个区段分别率定参数,使得模拟结果更符合实际水文情况。
-
传统一维水环境容量计算模型公式见式(4)[5]。
式中:Cs为水质目标浓度,mg∙L−1;C0为断面初始浓度,mg∙L−1;x为沿河段纵向距离,m∙s−1;ux为河段平均流速,m∙s−1;K1为污染物衰减系数,s−1;Q为断面流量,m3∙s−1;q为污水排放量,m3∙s−1;W为河段水环境容量,g∙s−1。Q一般取90%保证率下的最枯月平均流量,该方法计算简便但不能反映水环境容量的时空变化,因此本研究在一维水环境容量计算模型的基础上,提出基于MIKE11模型的动态水环境容量计算方法,能够更真实的反映实际水体水质的迁移转化规律,充分考虑污染物衰减作用,得到计算单元水环境容量计算公式(5)、(6)[5, 24]。
式中:
ˉQ 为日均流量,m3∙s−1;ˉq 为计算单元内的日均污水排放量,m3∙s−1;Cs为计算单元水质目标浓度,mg∙L−1;ˉCm 为计算单元上游来水污染物日均浓度,mg∙L−1。T为计算时段,文中取T=365 d;Wi为第i天计算单元水环境容量,kg∙d−1;W为逐日水环境容量基础上计算得到的水环境容量值,kg。 -
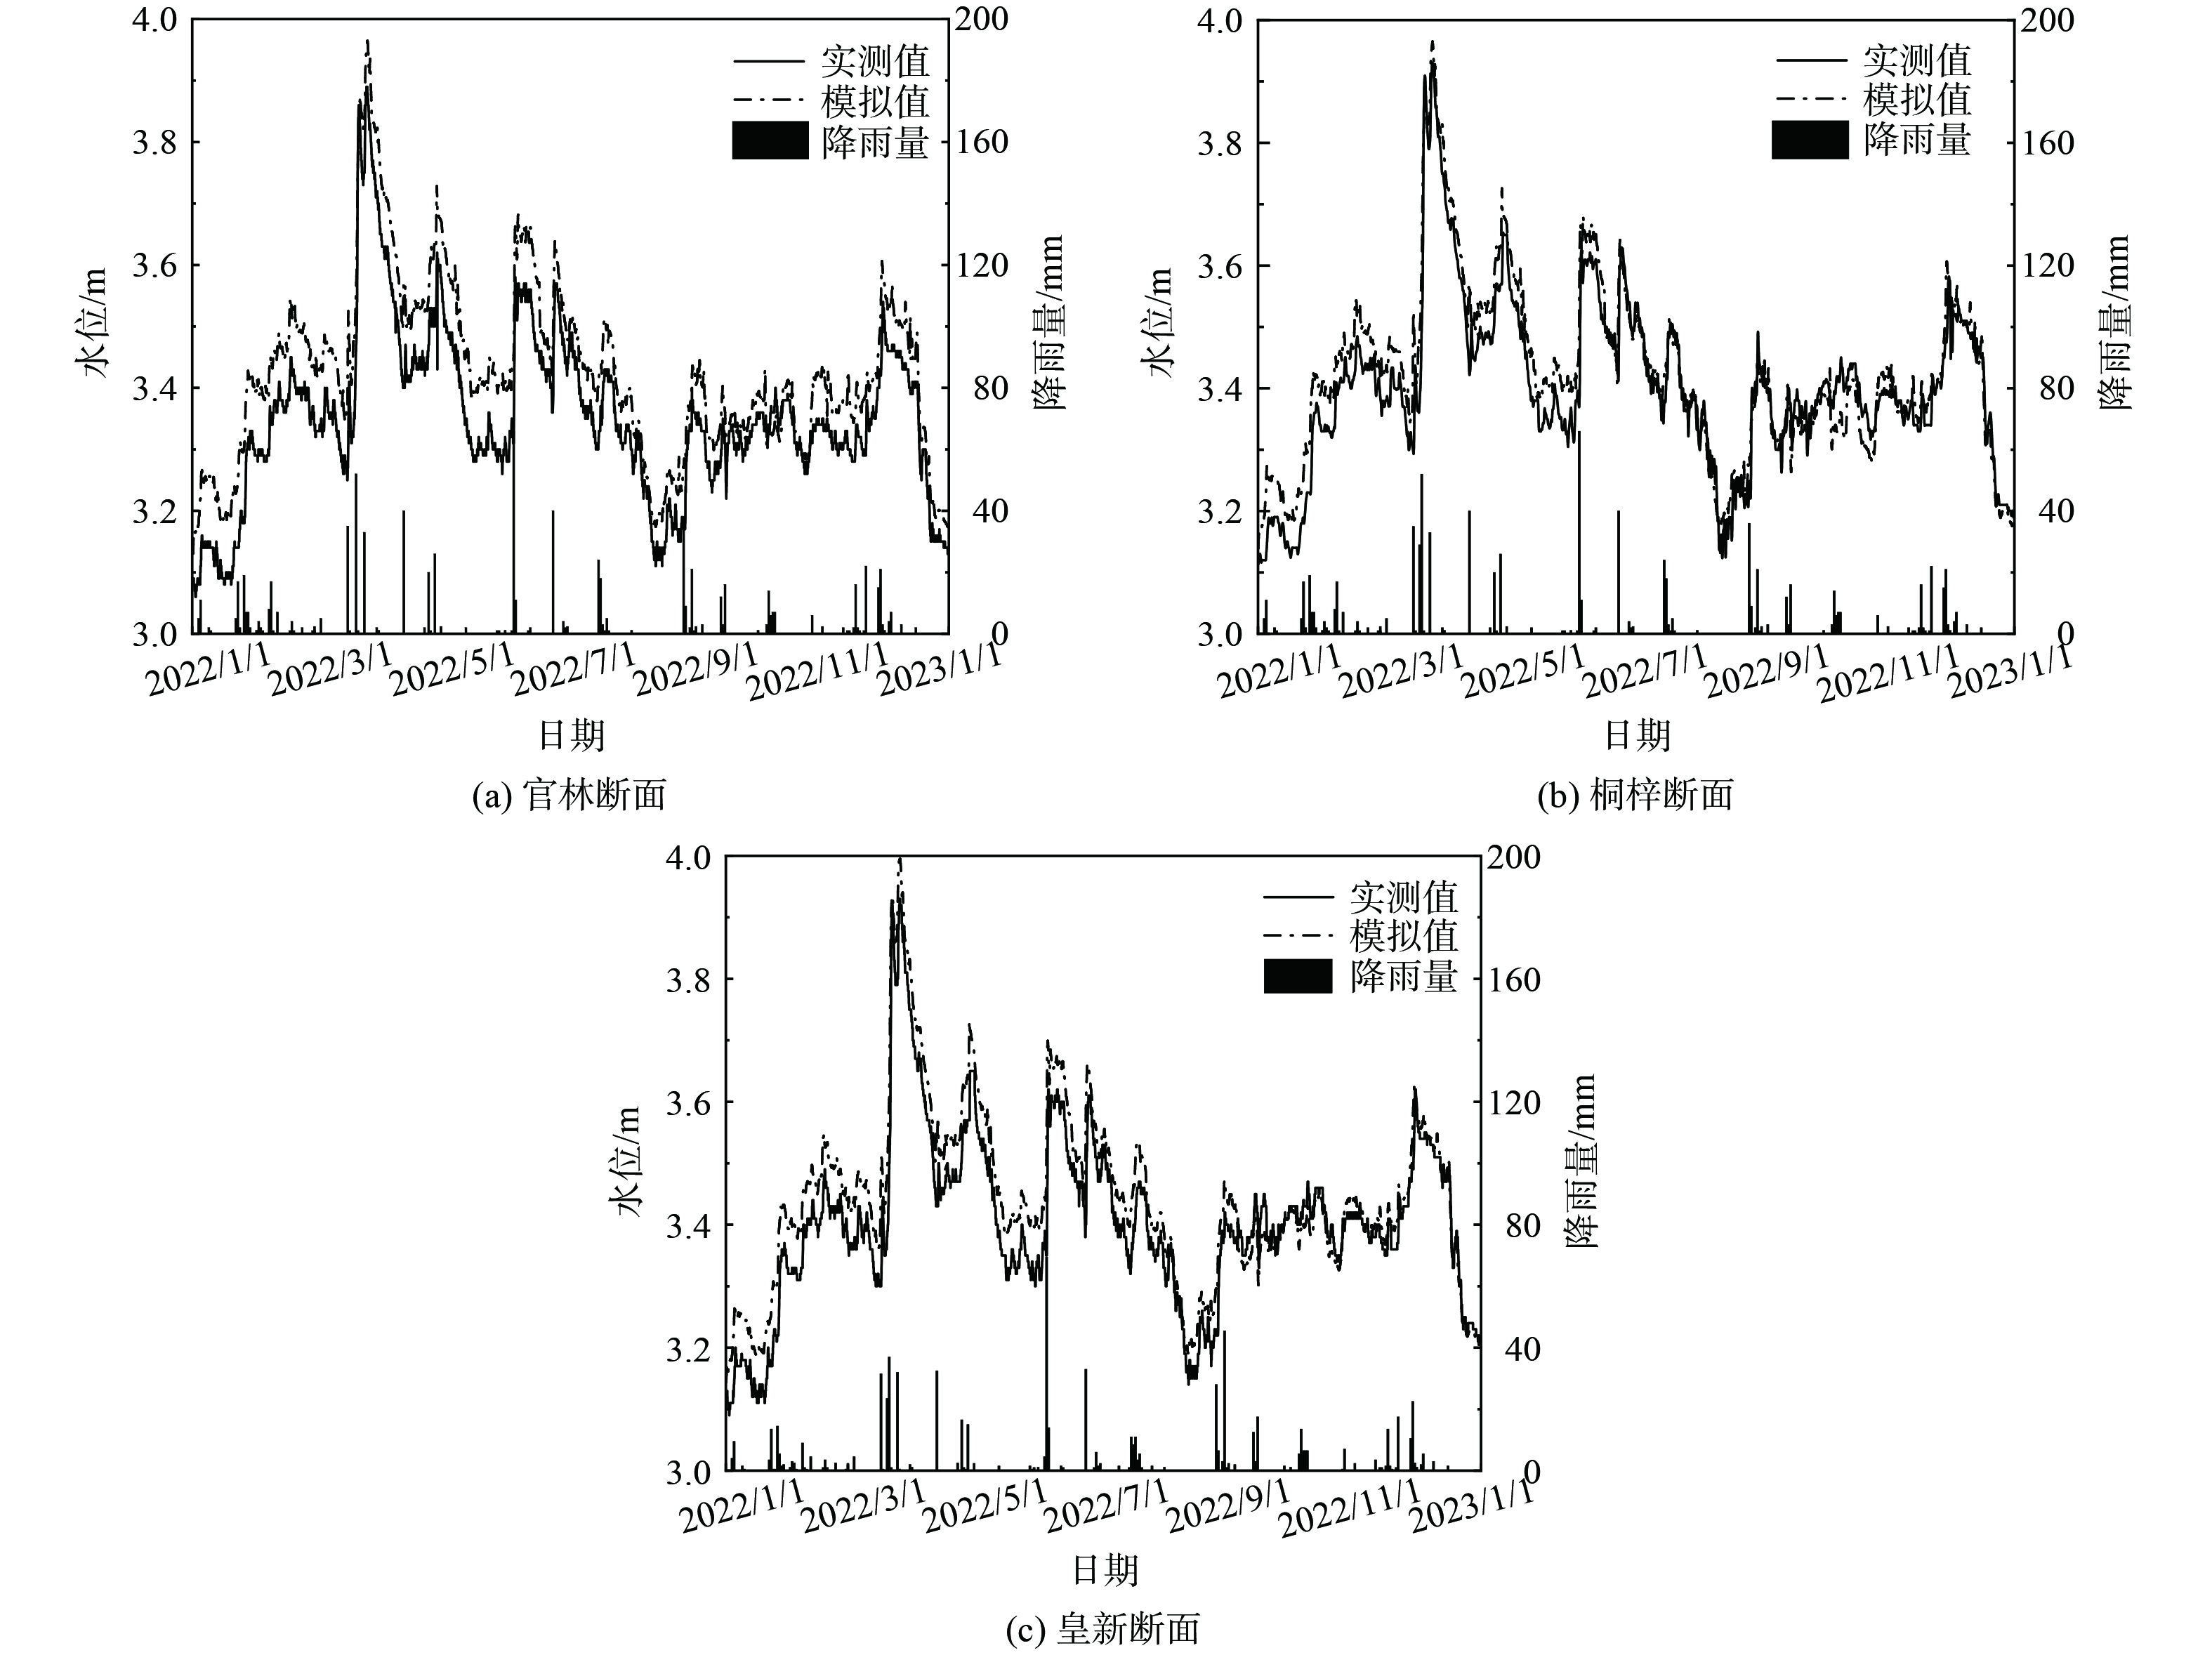
1) 水动力模块。水动力模块需要率定河床糙率,结果如表3所示。采用绝对误差Re、均方根误差RMSE、相关系数R2、Nash-Suttcliffe系数Ens来评价模型的准确性,一般认为Re≤20%,RMSE≤0.1,R2≥0.6,Ens≥0.5时,模型的模拟结果可接受[24-25]。官林、桐梓和皇新断面水位模拟结果见图4。
从图4的模拟结果来看,模拟水位与实测水位拟合情况良好,官林水位的绝对误差Re为2.17%,均方根误差RMSE为0.083,相关系数R2为0.968,Nash-Suttcliffe系数Ens为0.643;桐梓水位的绝对误差Re为1.12%,均方根误差RMSE为0.061、相关系数R2为0.957,Nash-Suttcliffe系数Ens为0.892;皇新水位的绝对误差Re为1.39%,均方根误差RMSE为0.056,相关系数R2为0.962,Nash-Suttcliffe系数Ens为0.832。造成水位误差的原因可能是河网概化时,忽略了水量较小的支浜来水,同时部分排污口流量采用恒定流概化值,导致断面水位偏大。总体而言,模型可以较好的反应官林镇平原河网水动力学变化过程,为进一步与对流扩散模块耦合奠定基础。
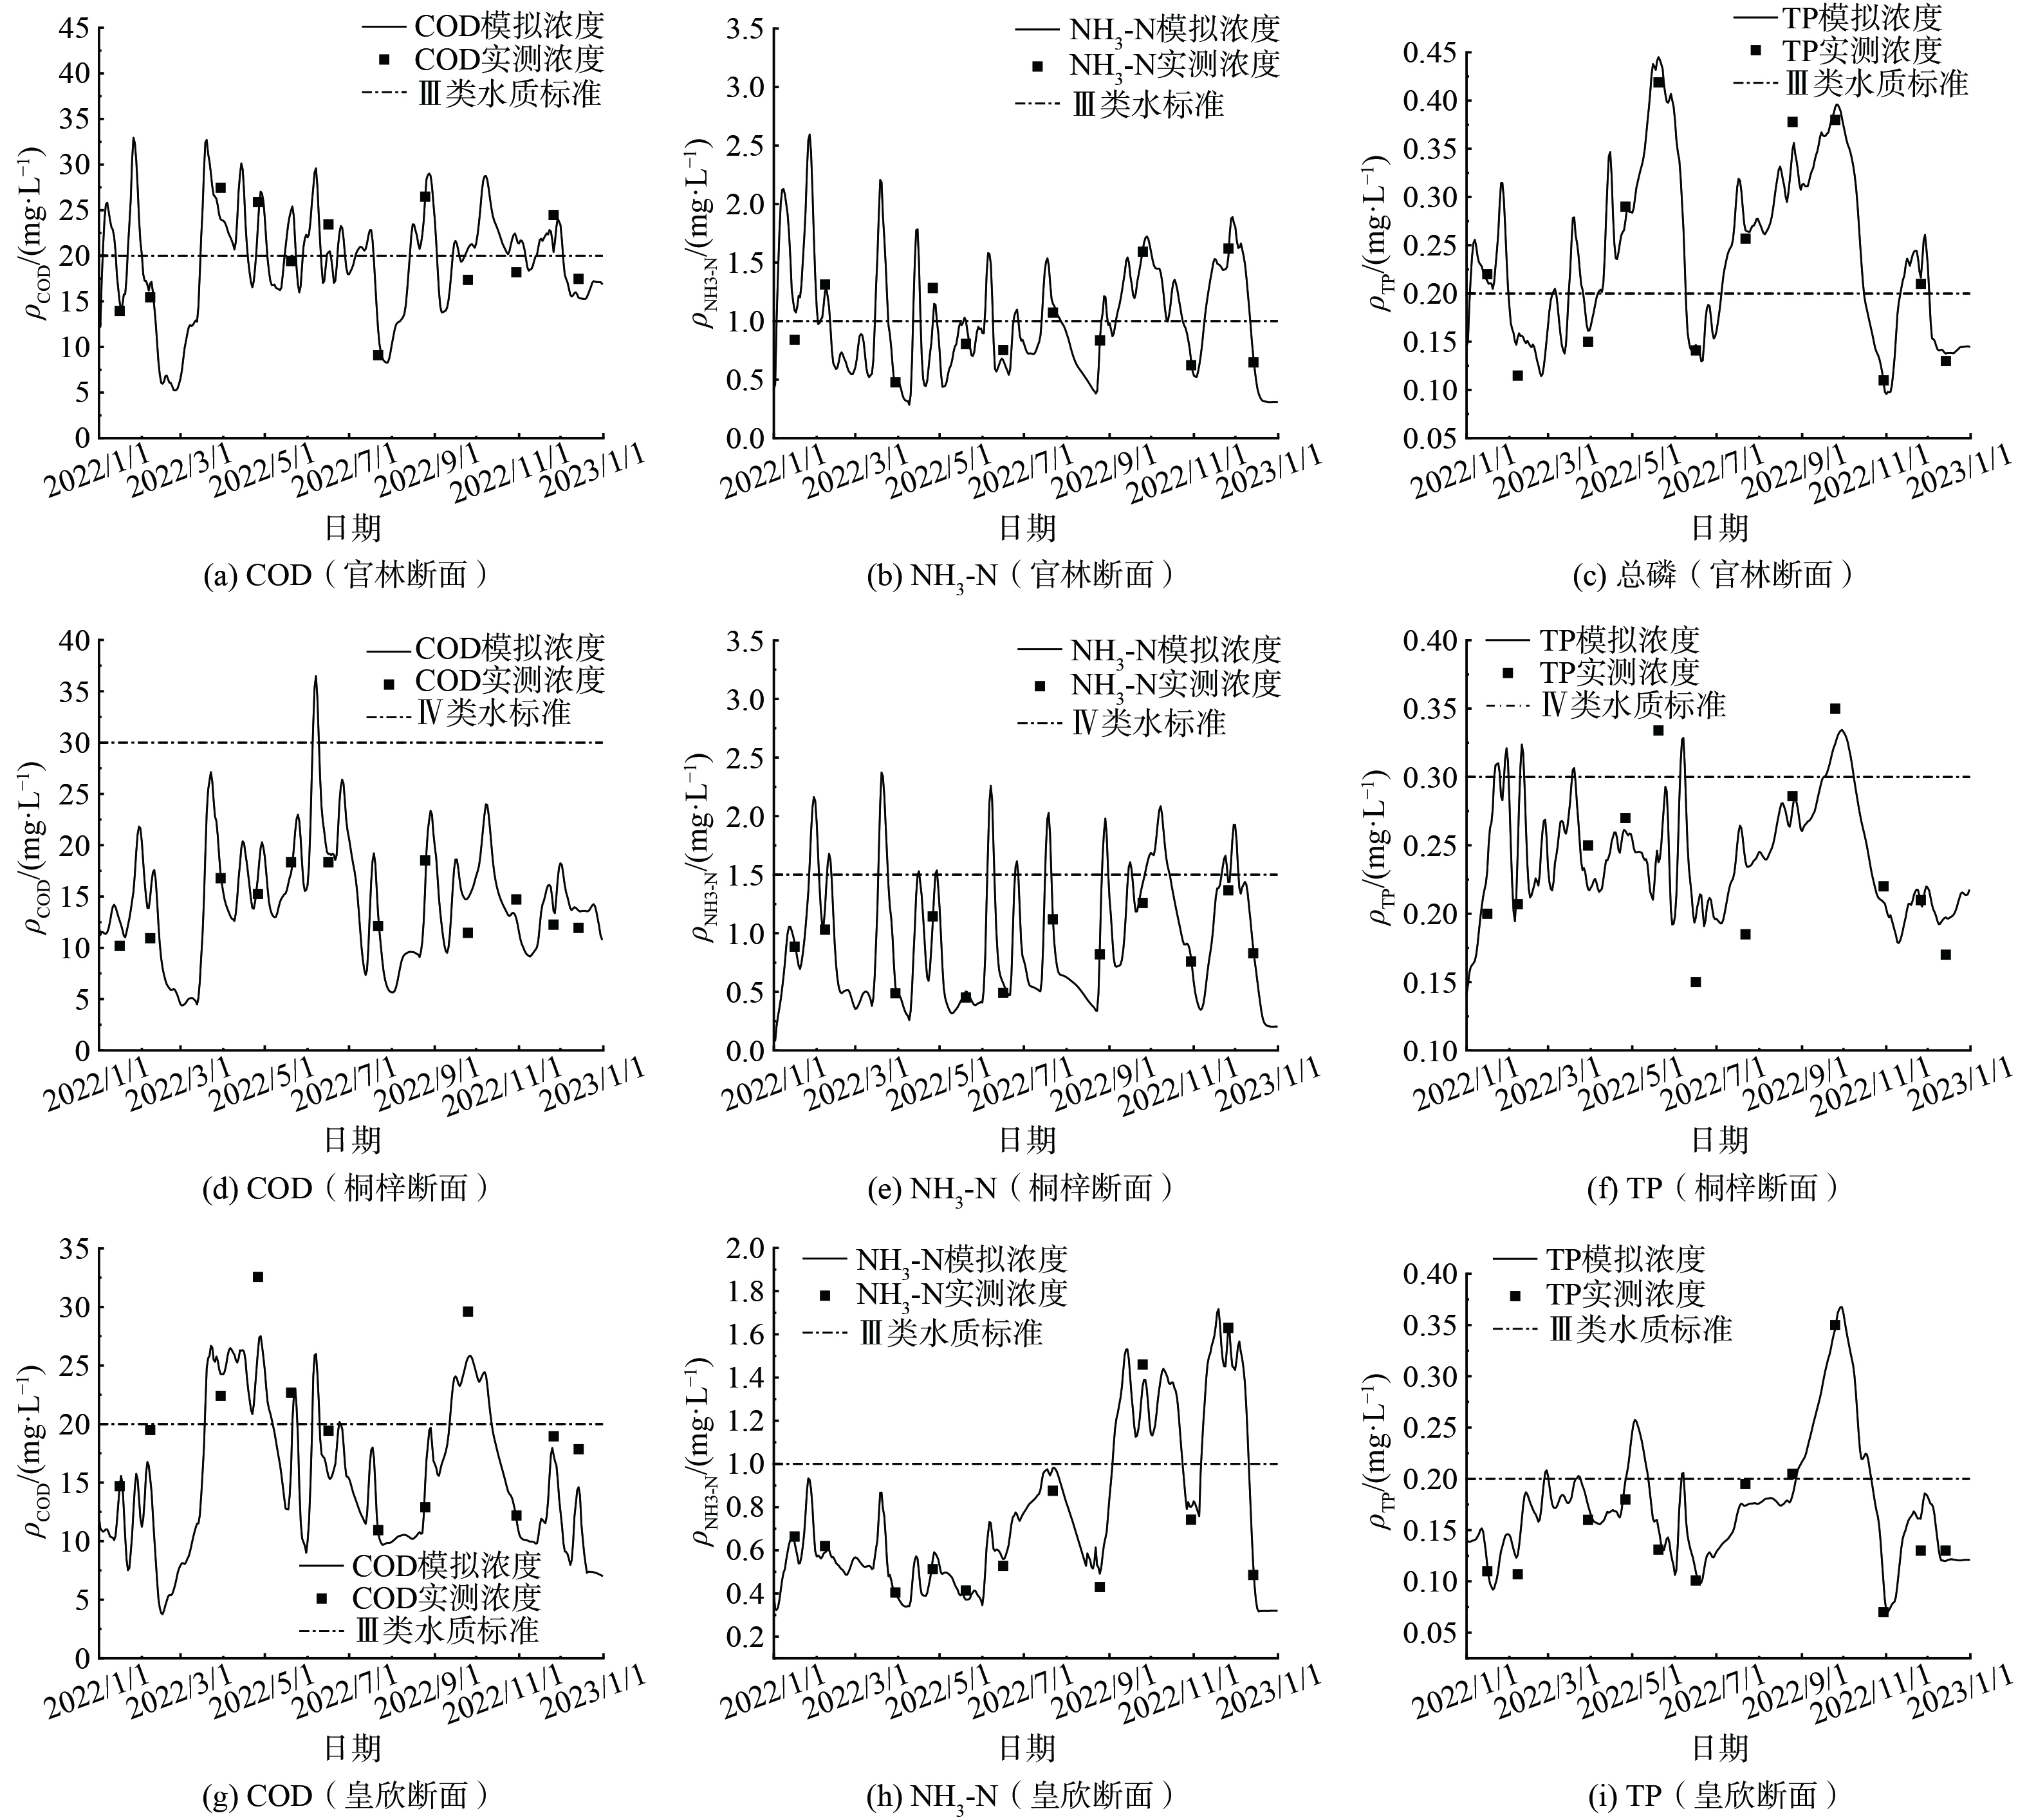
2) 对流扩散模块。对流扩散模块主要率定的参数为纵向扩散系数D和综合衰减系数K,鉴于研究区域污染源及水质污染特征,选择COD、氨氮和TP作为水质模拟污染因子,以官林、桐梓和皇新断面2022年水质监测数据进行率定,参数率定结果见表3,率定断面污染物模拟结果如图5所示。
从图5水质拟合结果可看出该模型基本可以反应研究区域水质变化状况,其中官林断面处COD、NH3-N、TP模拟值与实测值之间的平均相对误差分别为15.19%、10.07%、7.23%;桐梓断面处COD、NH3-N、TP模拟值与实测值之间的平均相对误差分别为14.69%、8.59%、14.38%;皇新断面处COD、NH3-N、TP模拟值与实测值之间的平均相对误差分别为13.21%、7.24%、13.62%,造成误差的原因可能是月际采样只能描述断面水质总体变化趋势,不能真实反应污染物沉积降解过程,同时监测时段可能存在排污口集中排放、偷排等现象,导致实测值显著增大。总体而言,污染物衰减系数及对流扩散系数取值合理,模拟值与实测值之间的拟合程度较高,模型能较好的模拟研究区域的水动力和水质的时空变化,其结果可应用于动态水环境容量的研究。
-
采用MIKE11模型法计算官林镇各控制单元水环境容量,计算公式见(6),水环境容量安全容量取10%,具体计算结果见表4,官林镇剩余水环境容量见表5,各控制单元水环境容量月均变化见图6所示。
在空间尺度上,由表4可知,水环境容量在不同控制单元呈现出明显的动态分布。官林、桐梓与皇新COD环境容量之比为−1︰1.44︰0.10,NH3-N环境容量之比为1︰4.86︰0.98,TP环境容量比值为−1︰0.8︰0.08,说明官林镇水环境容量分布不均匀,且COD分布均匀性更差。其中官林镇临滆湖区域官林控制单元水环境容量小于桐梓与皇新控制单元,且COD、TP水环境容量出现负值。主要是因为官林控制单元人口密度较大,同时伴有水产养殖、畜禽养殖等人为活动,水产养殖以池塘高密度养殖为主,粗放养殖模式下养殖尾水直接排放至河道当中,导致河道淤泥与污染物沉淀严重,水体自净能力显著下降,同时入湖河道水质目标要求较高,河道上下游来水为孟津河与滆湖,水质介于Ⅲ类水与劣Ⅴ类水之间,在部分月份未能满足水功能区划要求;桐梓控制单元内河道本底水质基本满足水质目标,河道常流量较大,稀释容量较高,水环境容量仍有较多剩余;皇新控制单元汇水面积较少,水质在Ⅲ类水上下波动,剩余容量较少。
在时间尺度上,从图6可以看出,各控制单元水环境容量计算结果有明显的动态变化。各污染物水环境容量变化趋势基本相同,进一步对比各月份不同控制单元水环境容量可以看出各控制单元的水环境容量5月至9月变化幅度较大,主要是因为5月开始官林镇河网进入丰水期,受春夏交际“梅雨期”影响,降雨量增大,河道流量增大的同时上游入流水质、污染物入河量也随之变化,同时伴有鱼塘换水及农田灌溉排水等人为活动,导致水环境容量波动明显。
从表5可知,官林镇COD、NH3-N和TP剩余水环境容量分别为516.38、33.42和-7.38 t∙a−1,水环境容量差距悬殊,这与水质标准限值、河网水文条件有关,因此TP水环境容量敏感性最高。官林镇平原河网TP水环境容量超出阈值,需进行污染物削减,COD、NH3-N水环境容量仍有剩余,但官林控制单元水体污染严重,现状条件下几乎没有可利用的水环境容量,需进一步对流域农田径流、畜禽水产养殖等含磷污染源进行管控,采取河道环保疏浚、鱼塘升级改造等科学合理的治理措施,改善水环境质量。
-
由公式(4)可知,水质目标要求、水体平均流速、上游断面来水水质、污染物综合降解系数、非点源污染的时空变化性等都是影响水环境容量的重要影响因素。显而易见,水环境容量与污染物综合降解系数呈正相关,而流速与水环境容量的关系则复杂多变,当流速
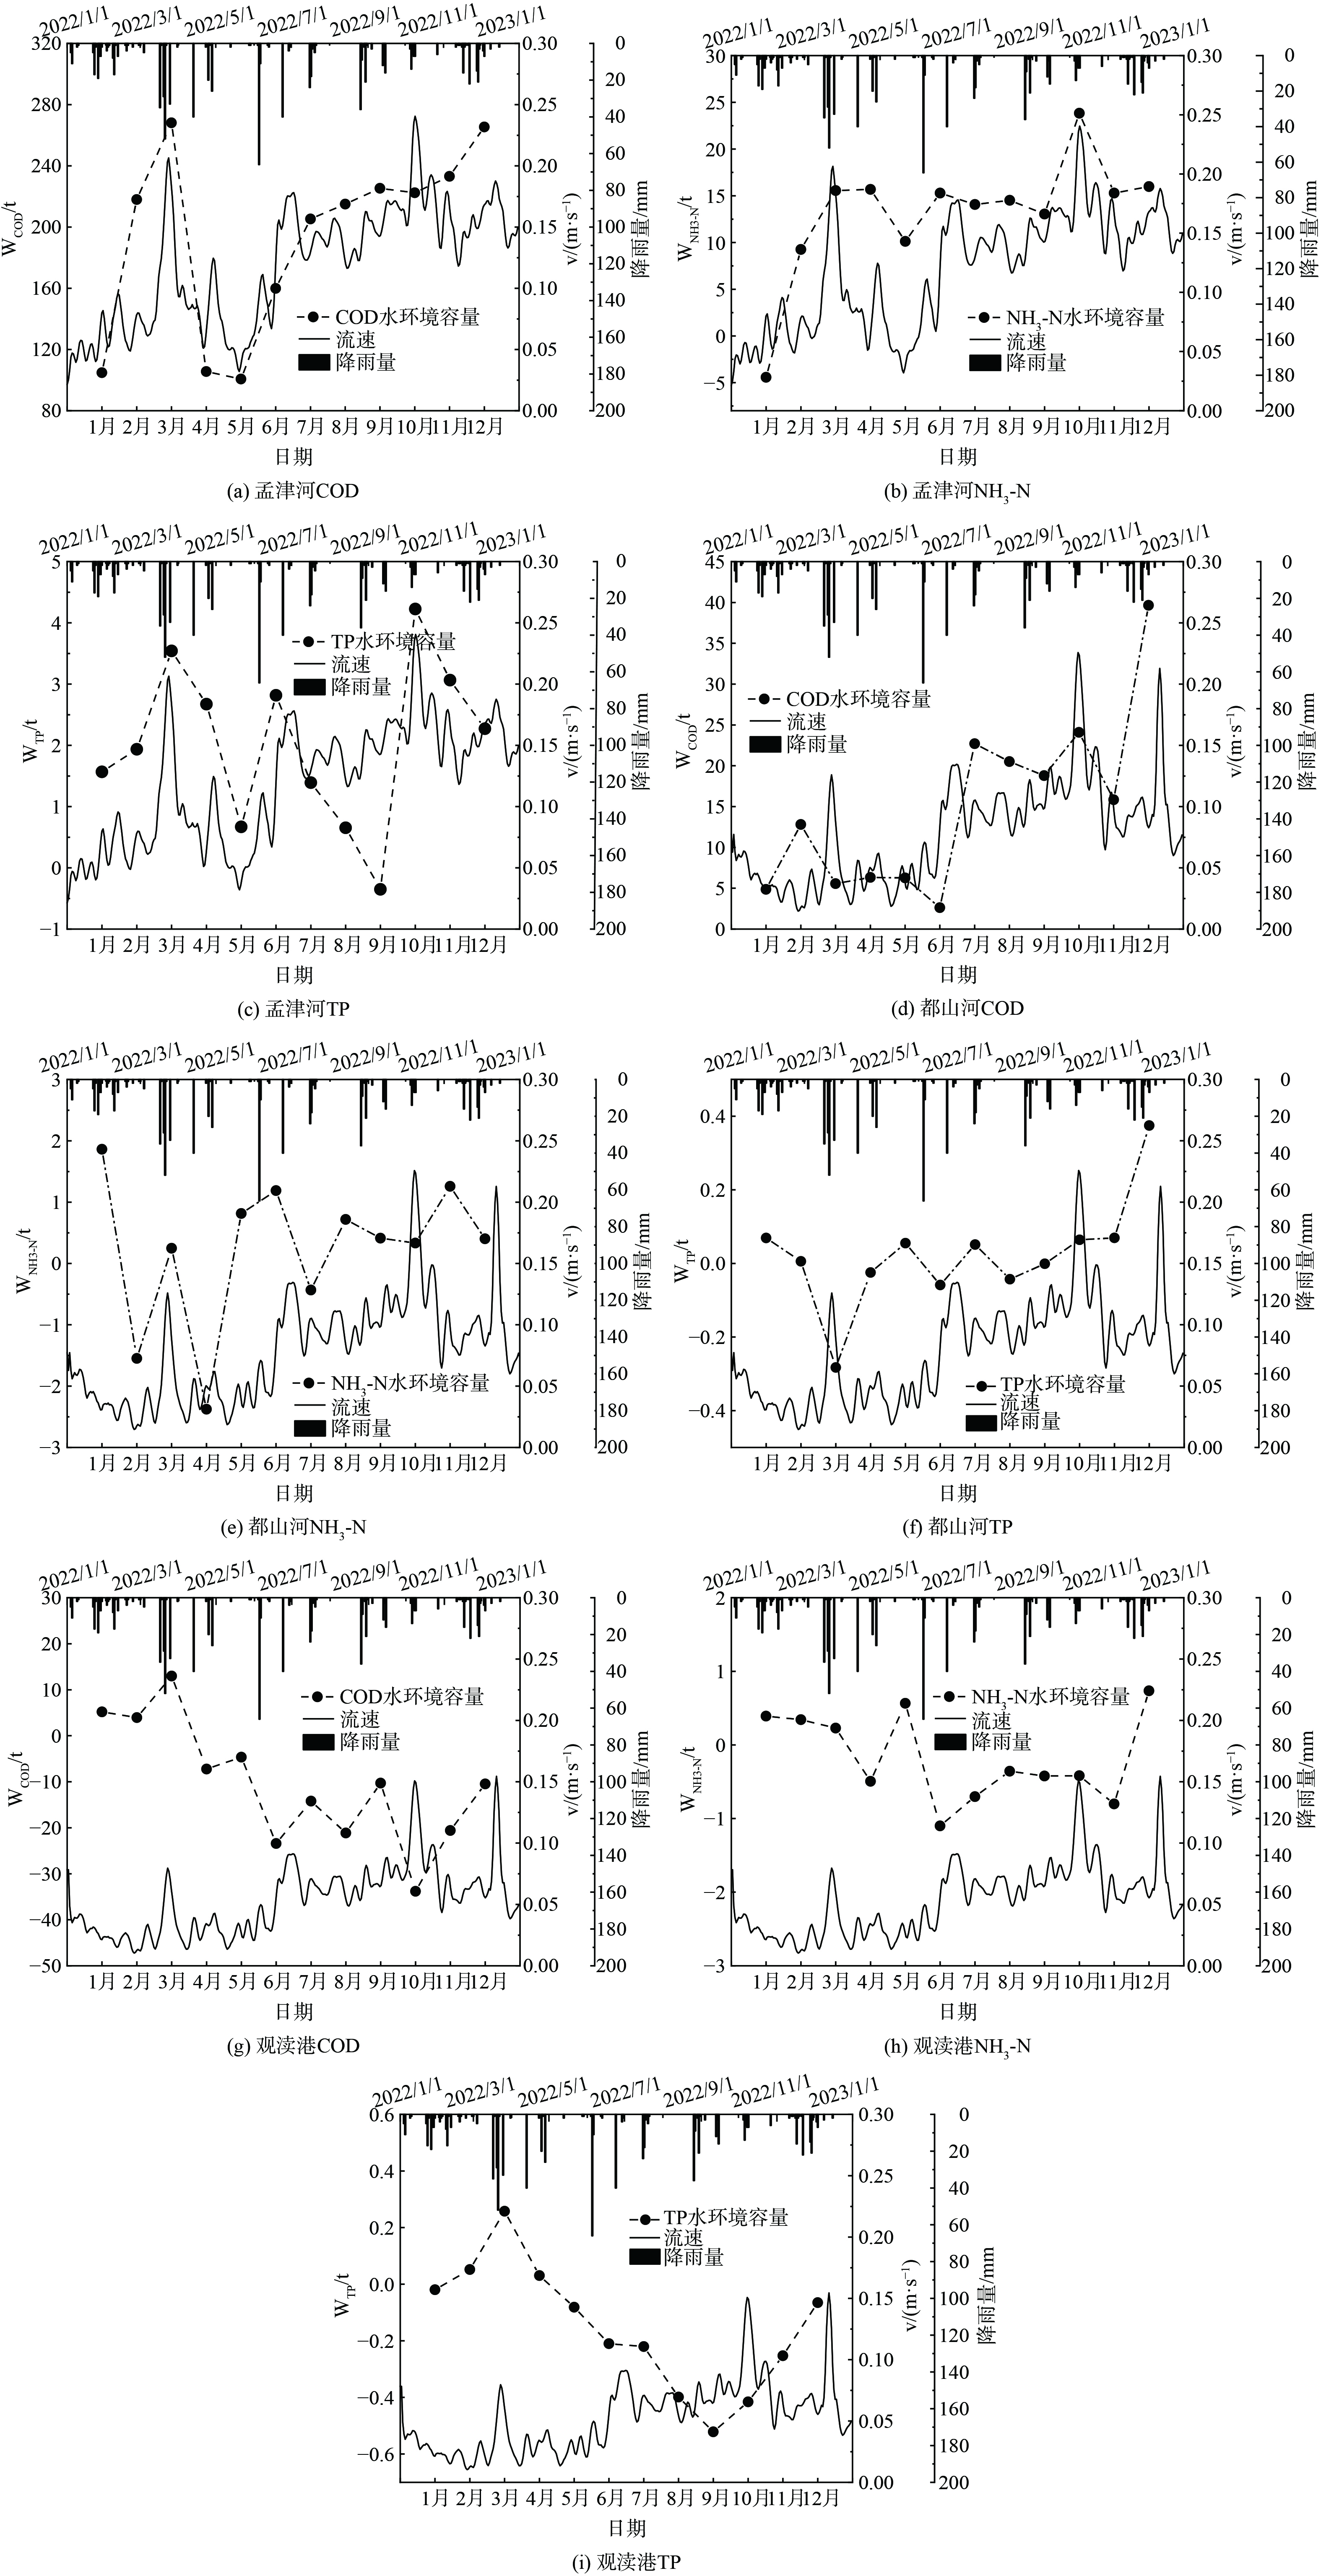
ux=−K1x/ln(cs/c0) 时,水环境容量为0;在其它变量一定的条件下,当cs=c0时,水环境容量随着流速增大而降低[26]。随着水体平均流速的改变,污染物综合降解系数、上游来水水质、入河负荷量等其它因素也随之变化。因此,流速与水环境容量变化的定性关系,需要更深一步的研究。选取市级河道孟津河、镇级河道都山河及村级河道观渎港探究水体流速与水环境容量的关系,如图7所示。由图7可知孟津河COD、NH3-N、TP水环境容量月均值分别为 (193.65±58.22) 、 (13.18±6.31) 、 (2.03±1.27) t;都山河COD、NH3-N、TP水环境容量月均值分别为 (15.00±10.39) 、 (0.24±1.14) 、 (0.02±0.14) t;观渎港COD、NH3-N、TP水环境容量月均值分别为 (−10.31±12.87) 、 (−0.17±0.57) 、 (−0.15±0.21) t,总体来看孟津河整体水环境状况良好,水环境容量基本满足水功能区划要求;都山河整体水环境容量仍有剩余,但出现部分月超标现象;观渎港水环境容量变化范围并不理想,均处于超标情况,由此可见随着河道平均流速的增大,水环境容量也随之增大,水环境容量达标率也逐步提高。由表6河道平均流速与水环境容量相关性可知,孟津河、都山河水环境容量变化与河道平均流量呈正相关,原因为孟津河、都山河上游来水基本满足水质目标要求,随着河道进入丰水期流速增加,微生物活性与生化反应速率提高,有利于水体污染物降解,汛期河道水质提高,导致水环境容量随着流速的增大而增大,呈现正相关性。而观渎港水环境容量变化与河流流量呈负相关,这与普遍认知的丰水期河道纳污能力强有所差别,原因可能是观渎港上游来水水质不满足水质目标要求,随着丰水期河道流速增大,水体交换和流动能力增强,水体自净能力虽有所增强,但河流常流量较小,受丰水期强降雨及上下游季节性河道水质影响较大,入河污染物量超出自净能力范围,汛期河道水质反而降低,导致平均流速越大,水环境容量越差,呈现负相关性。综上所述,官林镇平原河网中孟津河、都山河等水质整体达标河道水环境容量的变化大小与河流流速呈现正相关特征,而观渎港等水质整体不达标河道水环境容量的变化大小与河流流速呈现负相关特征。
-
1) 利用MIKE11构建官林镇平原河网一维水环境模型,并依据2022年实测水文水质数据率定模型参数,官林镇平原河网河床糙率为0.028~0.035;纵向扩散系数为3~10 m·s−1;COD综合衰减系数为0.08~0.12 d−1;NH3-N综合衰减系数为0.06~0.09 d−1;TP综合衰减系数为0.06~0.10 d−1,其模拟水质变化趋势与实测值拟合程度较高,所确定的参数基本能反映河网水质时空演变规律。
2) 官林镇水环境容量计算结果显示,桐梓、皇新控制单元水环境容量仍有剩余;官林控制单元污染物排放量超出水体纳污能力,水环境容量存在数月超标现象,需进一步落实官林控制单元入湖河道清淤和滆湖水产养殖围网综合整治工作。
3) 孟津河、都山河等水质整体达标的河道水环境容量的变化趋势与各月流量和流速的变化趋势一致,呈正相关;观渎港等水质整体未达标的河道水环境容量与各月流量和流速呈负相关,说明水环境容量的大小受水量和水体流速等水文参数的影响较大。
基于MIKE11的江南平原河网动态水环境容量分析
Dynamic water environment capacity of river network in Jiangnan Plain based on MIKE11 model
-
摘要: 传统水环境容量以90%保证率下的设计枯水流量作为计算条件,存在水文计算条件单一、计算结果固定等局限性,不能很好地表征水流方向不定、产汇流过程复杂、污染负荷分散的江南平原河网的水环境容量。以宜兴市官林镇水系为研究对象,基于MIKE11水质模型计算河网控制单元水环境容量,以探究江南平原河网水环境容量的动态特性。结果表明:MIKE11模型法下官林控制单元COD、氨氮和总磷月均水环境容量为−152.80、0.92和−1.69 t;桐梓控制单元COD、氨氮和总磷月均水环境容量为220.23、4.49和1.45 t;皇新控制单元COD、氨氮和总磷月均水环境容量为15.42、0.90和0.14 t,呈现出明显动态特征。代表河道水环境容量与流量流速等水文要素有密切关系,市镇级等水质达标河道水环境容量与流速呈正相关,村级等未达标河道水环境容量与流速呈负相关。本研究可为平原河网水环境保护与管理提供重要参考和新思路。Abstract: Water environment capacity calculated using traditional methods has limitations such as single hydrological calculation conditions and fixed calculation results, as the low water flow rate is normally designed at a 90% guarantee rate. Thus, the traditional methods cannot well characterize the water environment capacity of Jiangnan Plain river network which is with unpredictable flow directions, complicated hydrological processes, and dispersed pollutants. Aiming to help reveal the dynamic characteristics of water environment capacity of river network in Jiangnan Plain, this study took the river system of Guanlin Town, Yixing City as an example to calculate the water environmental capacity of the river network control unit based on the MIKE11 water quality model. The results were that an obvious dynamics was observed for the water environment capacity via the MIKE11 model method and the monthly average water environment capacities were -152.80 t for COD, 0.92 t for ammonia nitrogen and -1.69 t for total phosphorus in Guanlin control unit, 220.23 t for COD, 4.49 t for ammonia nitrogen and 1.45 t for total phosphorus in Tongzi control unit; and 15.42 t for COD, 0.90 t for ammonia nitrogen and 0.14 t for total phosphorus in Huangxin control unit, respectively. The water environment capacities of the representative rivers were closely related with the flow velocity and other hydrological elements, for example, the urban rivers with a standard water quality exhibited a positive correlation between the water environment capacity and the flow velocity, but the rural rivers with a water quality not up to standards showed a contrary pattern. This study can provide an important reference and new ideas for the water environment protection and management of the plain river network.
-
Key words:
- MIKE11 /
- dynamic water environment capacity /
- plains river network
-
江南平原河网地区地势平坦、水资源丰富、人类开发活动高度密集[1],是我国经济核心区域之一,同时也是河网最密集的地区之一[2]。近年来,随着经济迅速发展与城市化水平的提高,大量生活、工农业污染物进入水体,平原河流区域生态水平普遍降低,亟待治理[3]。
水环境容量是指在给定水文条件,确定排污方式和功能目标的前提下,水域所能容纳污染物的最大负荷量[4],这与国外使用的“Total maximum daily loads (TMDL) ” “Environment capacity”有着相似的含义[5]。早在20世纪70年代水环境容量概念引入中国,随着研究的不断深入,如今逐渐形成了公式法[6]、不确定分析法[7]、非均匀系数法[8]等计算方法,但具有一定局限性。随着水环境数学模型及计算机技术的发展,国内外学者大多基于SWMM[9-10]、SWAT[11-12]、EFDC[13]、WASP[14-15]、GIS[16]、MIKE[17-18]等模型,综合考虑实际水力学、地形地貌等自然因素,以模拟水体污染物的时空演变规律。江南平原河网水系具有水流方向不定、产流汇流过程复杂[19]、污染负荷高且分布分散等特点使水环境容量呈现动态变化,然而当前对这变化过程及变化幅度研究较少,传统水环境容量计算方法忽略了水文条件动态变化对水环境容量的影响,水环境容量的准确性不足,亟待开展基于水动力水质模型的动态水环境容量研究。
本研究选取江南平原河网地区典型代表宜兴市官林镇为研究对象,选取化学需氧量 (COD) 、氨氮 (NH3-N) 、总磷 (TP) 3个水质指标作为研究目标,基于MIKE11模型,构建官林镇平原河网水质模型,计算满足水质目标的官林镇各控制单元逐月动态水环境容量,为流域水环境保护与管理提供依据,同时选取控制单元代表河道,通过探究影响动态水环境容量的关键要素,旨在为江南平原地区类似流域水体污染治理提供技术支持和创新思路。
1. 研究区域概况
1.1 研究区域范围
官林镇 (北纬31°34’~31°24’,东经119°38’~119°47’) 位于宜兴西北部,是无锡地区首个千亿级涉农乡镇,工业发达、人口众多。其地处滆湖西畔,地势平坦,属于长江中下游水系的湖沼平原,区域内河流密布、湖荡相连,共有市级河道5条、镇级河道18条,村级河道241条,总长348.47 km,为典型的江南平原河网地区。
控制单元是我国流域空间管理的基础单位,本研究以水环境功能区划、行政区划及流域边界为基础,综合考虑水质监测断面设置、水文站点、点面源污染等因素,以村级行政区作为控制单元的基本组成,以官林、桐梓和皇新为控制断面,将官林镇河网分为官林、桐梓和皇新3个控制单元汇流区,其中桐梓控制单元水质要求达到地表水水质标准Ⅳ类,皇新和官林控制单元要求达到Ⅲ类水质标准。研究区域水系监测点及控制单元划分见图1、表1。
表 1 官林镇采样点坐标Table 1. The coordinates of sampling sites in Guanlin Township监测点位置 断面名称 断面坐标 水环境质量控制目标 经度°E 纬度°N 滆湖 S30 119°45′11.63″ 31°29′46.78″ Ⅲ类 S31 119°45′39.66″ 31°30′35.15″ S32 119°45′57.82″ 31°31′38.51″ S33 119°46′15.40″ 31°32′28.19″ S34 119°46′25.50″ 31°33′5.16″ 官林控制单元 S1 119°44′39.10″ 31°29′46.07″ Ⅲ类 S3 119°44′48.23″ 31°30′1.44″ S5 119°44′56.99″ 31°30′19.03″ S7 119°45′11.28″ 31°30′42.75″ S9 119°45′20.15″ 31°31′16.74″ 官林控制单元 S11 119°45′30.01″ 31°31′56.04″ Ⅲ类 S13 119°45′36.90″ 31°32′18.35″ S15 119°45′39.04″ 31°32′39.18″ S26 119°44′44.29″ 31°28′49.01″ S27 119°44′34.56″ 31°28′54.75″ S28 119°44′30.02″ 31°29′5.30″ S29 119°44′37.26″ 31°29′34.81″ S35 119°45′49.79″ 31°33′15.92″ 桐梓控制单元 S2 119°43′26.89″ 31°30′0.13″ Ⅳ类 S4 119°43′30.68″ 31°30′19.95″ S6 119°43′42.04″ 31°30′32.48″ S8 119°43′57.43″ 31°30′58.92″ S10 119°44′16.18″ 31°31′30.68″ S12 119°44′22.85″ 31°32′14.42″ S14 119°44′33.14″ 31°32′36.27″ S16 119°44′33.14″ 31°32′59.52″ S17 119°43′11.97″ 31°29′48.55″ S18 119°42′52.34″ 31°29′22.39″ S19 119°42′38.06″ 31°29′2.18″ S36 119°44′34.51″ 31°33′39.7″ S37 119°43′41.40″ 31°33′43.68″ S38 119°42′57.56″ 31°33′21.65″ S39 119°42′35.36″ 31°32′59.27″ S40 119°41′58.96″ 31°32′36.36″ S41 119°41′40.36″ 31°31′52.74″ S42 119°41′19.91″ 31°30′50.53″ S43 119°40′39.44″ 31°30′23.22″ S44 119°40′7.38″ 31°29′25″ S20 119°42′7.00″ 31°28′23.14″ S21 119°41′35.66″ 31°27′59.75″ 皇新控制单元 S22 119°40′12.27″ 31°27′1.26″ Ⅲ类 S23 119°42′11.51″ 31°26′3.74″ S24 119°42′6.55″ 31°24′56.52″ S25 119°43′32.29″ 31°27′22.72″ 1.2 流域水质现状
2022年官林镇水体水质监测显示,COD、NH3-N和TP平均浓度介于Ⅲ类水至劣Ⅴ类水之间,其中滆湖水质污染最严重,不满足Ⅲ类水质要求,TP最大超标倍数为12倍,断面超标率为93.75%,官林控制单元COD和TP断面超标率均超过40%。因此为更精确地对污染物总量排放进行控制,需对官林镇分区段计算水环境容量,研究区域水质现状见表2。
表 2 研究区域水质现状及水质目标Table 2. Status of water quality and water quality objectives in the research area污染物指标 统计值 滆湖 官林控制单元 桐梓控制单元 皇新控制单元 COD 浓度范围/(mg∙L−1) 2.07~25.80 7.20~38.02 4.83~70.95 6.86~67.60 平均值/(mg∙L−1) 22.18 26.03 24.37 21.38 水质目标/(mg∙L−1) ≤20 ≤20 ≤30 ≤20 断面超标率/% 52.08 44.79 19.05 26.71 NH3-N 浓度范围/(mg∙L−1) 0.02~2.84 0.02~1.99 0.04~2.53 0.01~2.24 平均值/(mg∙L−1) 0.63 0.82 0.97 0.73 水质目标/(mg∙L−1) ≤1 ≤1 ≤1.5 ≤1 断面超标率/% 33.33 27.78 14.88 11.13 TP 浓度范围/(mg∙L−1) 0.03~0.60 0.05~0.76 0.05~0.63 0.03~0.44 平均值/(mg∙L−1) 0.23 0.25 0.23 0.19 水质目标/(mg∙L−1) ≤0.05 ≤0.20 ≤0.30 ≤0.20 断面超标率/% 93.75 49.48 31.17 38.68 2. 数据与方法
2.1 采样及分析
为更好的分析官林镇平原河网整体水环境现状,水质监测点设置在滆湖及官林镇河网主干河道河口处,共计44个,于2022年每月开展监测。采样时为消除河道边际效应的影响,用有机玻璃采水器 (WB-PM,北京普力特仪器有限公司) 于河道中部水面下0.5 m处采集水样,分装500 mL于聚乙烯储存瓶保存,于24 h内完成水质测定。水体COD、NH3-N和TP分析方法参考国标进行测定,其中COD采用快速消解分光光度法 (HJ/T 399-2007) ,NH3-N采用纳氏试剂分光光度法 (HJ 535-2009) ,TP采用钼酸铵分光光度法 (GB/T 11893-1989) 。
2.2 数据来源
本研究水质目标来源于《江苏省水环境功能区划》,7个水文监测站点的逐时水位数据来源于宜兴市水利局和水文局,河道沿线排污口数据、点源与非点源污染的数据来源于宜兴市环境数据统计。
2.3 模型基本方程
水动力模块是MIKE11模型的核心模块,该模块建立在基于垂直积分的物质和动量守恒方程,即一维非恒定流圣维南方程的基础上。圣维南方程可以从物理机制上描述河流或河口的水文运动规律,其方程主要包括连续性方程与动量方程[20]见式(1)、式(2)。
stringUtils.convertMath(!{formula.content}) (1) stringUtils.convertMath(!{formula.content}) (2) 式中:x为空间变量;t为时间变量;Q为断面流量;h为水位;A为断面面积;R为水力半径;BS为水面宽度;q为旁侧入河流量;C为谢才系数;g为重力加速度;α为垂向速度分布系数。
MIKE11 AD模块是以水动力模块生成的水质流场条件为基础,通过求解水体中较大浓度梯度污染物的一维对流扩散方程模拟水质污染物迁移的模块。AD模块的一维对流扩散方程[21] 见式(3)。
stringUtils.convertMath(!{formula.content}) (3) 式中:C为模拟的物质浓度;u为河段平均流速;Ex为扩散系数;K为模拟物质的衰减系数;x为空间变量;t为时间变量。
2.4 模型构建
1) 河网概化。河网概化的核心原则在于经过概化处理后的河网必须准确地体现自然河网的基本水力特征,这意味着概化后的河网输水过流能力与调蓄能力方面应与实际天然河网相一致[22]。根据研究区域的实际情况,以官林镇河网主干河道为主,不考虑水流量小且对河网影响小的支流,计算模型中共概化河道23条,河道断面间距取500 m,计算节点 (水位、流量计算点) 共314个。河道概化见图2。
2) 模型边界条件。模型的边界条件采用2022年中干河站、杨巷站、滂渎港站、张五渎站逐时水位数据;采用2022年官林镇各监测断面的实测水质数据作为水质边界条件。
3) 研究区域污染负荷排放情况。根据宜兴市环境数据统计及Johns输出系数模型[23]估算官林镇污染负荷排放量。官林镇点源污染主要包括污水处理厂尾水及工业企业直排废水,其中COD入河量320.10 t∙a−1、NH3-N入河量29.01 t∙a−1、TP入河量2.40 t∙a−1。面源污染主要来源于农村生活污水、畜禽水产养殖污染以及农田径流带来的污染,其中COD入河量157.72 t∙a−1、NH3-N入河量13.29 t∙a−1、TP入河量3.78 t∙a−1,具体负荷分布占比见图3。
2.5 模型率定
依据2022年实测水文水质数据,运用经验法及人工试错法对研究区域河网的HD模块及AD模块进行率定,考虑到官林镇河网主干河道水文特征,将官林镇河网分为4个区段分别率定参数,使得模拟结果更符合实际水文情况。
2.6 水环境容量计算
传统一维水环境容量计算模型公式见式(4)[5]。
stringUtils.convertMath(!{formula.content}) (4) 式中:Cs为水质目标浓度,mg∙L−1;C0为断面初始浓度,mg∙L−1;x为沿河段纵向距离,m∙s−1;ux为河段平均流速,m∙s−1;K1为污染物衰减系数,s−1;Q为断面流量,m3∙s−1;q为污水排放量,m3∙s−1;W为河段水环境容量,g∙s−1。Q一般取90%保证率下的最枯月平均流量,该方法计算简便但不能反映水环境容量的时空变化,因此本研究在一维水环境容量计算模型的基础上,提出基于MIKE11模型的动态水环境容量计算方法,能够更真实的反映实际水体水质的迁移转化规律,充分考虑污染物衰减作用,得到计算单元水环境容量计算公式(5)、(6)[5, 24]。
stringUtils.convertMath(!{formula.content}) (5) stringUtils.convertMath(!{formula.content}) (6) 式中:
ˉQ ˉq ˉCm 3. 结果与讨论
3.1 参数率定结果
1) 水动力模块。水动力模块需要率定河床糙率,结果如表3所示。采用绝对误差Re、均方根误差RMSE、相关系数R2、Nash-Suttcliffe系数Ens来评价模型的准确性,一般认为Re≤20%,RMSE≤0.1,R2≥0.6,Ens≥0.5时,模型的模拟结果可接受[24-25]。官林、桐梓和皇新断面水位模拟结果见图4。
表 3 MIKE11模型参数率定结果Table 3. parameter calibration results of MIKE11河道名称 河床糙率n 对流扩散系数D/ (m2∙s−1) 综合降解系数K/d−1 COD NH3-N TP 孟津河 0.030 10 0.12 0.09 0.10 西孟河、北溪河、中干河 0.028 8 0.10 0.08 0.09 大埝河、中心河等孟津河支流 0.033 5 0.09 0.08 0.06 滂渎港、灌渎港等入滆湖河道 0.035 3 0.08 0.06 0.06 从图4的模拟结果来看,模拟水位与实测水位拟合情况良好,官林水位的绝对误差Re为2.17%,均方根误差RMSE为0.083,相关系数R2为0.968,Nash-Suttcliffe系数Ens为0.643;桐梓水位的绝对误差Re为1.12%,均方根误差RMSE为0.061、相关系数R2为0.957,Nash-Suttcliffe系数Ens为0.892;皇新水位的绝对误差Re为1.39%,均方根误差RMSE为0.056,相关系数R2为0.962,Nash-Suttcliffe系数Ens为0.832。造成水位误差的原因可能是河网概化时,忽略了水量较小的支浜来水,同时部分排污口流量采用恒定流概化值,导致断面水位偏大。总体而言,模型可以较好的反应官林镇平原河网水动力学变化过程,为进一步与对流扩散模块耦合奠定基础。
2) 对流扩散模块。对流扩散模块主要率定的参数为纵向扩散系数D和综合衰减系数K,鉴于研究区域污染源及水质污染特征,选择COD、氨氮和TP作为水质模拟污染因子,以官林、桐梓和皇新断面2022年水质监测数据进行率定,参数率定结果见表3,率定断面污染物模拟结果如图5所示。
从图5水质拟合结果可看出该模型基本可以反应研究区域水质变化状况,其中官林断面处COD、NH3-N、TP模拟值与实测值之间的平均相对误差分别为15.19%、10.07%、7.23%;桐梓断面处COD、NH3-N、TP模拟值与实测值之间的平均相对误差分别为14.69%、8.59%、14.38%;皇新断面处COD、NH3-N、TP模拟值与实测值之间的平均相对误差分别为13.21%、7.24%、13.62%,造成误差的原因可能是月际采样只能描述断面水质总体变化趋势,不能真实反应污染物沉积降解过程,同时监测时段可能存在排污口集中排放、偷排等现象,导致实测值显著增大。总体而言,污染物衰减系数及对流扩散系数取值合理,模拟值与实测值之间的拟合程度较高,模型能较好的模拟研究区域的水动力和水质的时空变化,其结果可应用于动态水环境容量的研究。
3.2 水环境容量计算结果
采用MIKE11模型法计算官林镇各控制单元水环境容量,计算公式见(6),水环境容量安全容量取10%,具体计算结果见表4,官林镇剩余水环境容量见表5,各控制单元水环境容量月均变化见图6所示。
表 4 官林镇各控制单元水环境容量月均值Table 4. Monthly average values of water environment capacity of each control unit in Guanlin Townshipt 控制单元 COD NH3-N TP 考虑安全余量 未考虑安全余量 考虑安全余量 未考虑安全余量 考虑安全余量 未考虑安全余量 官林 −152.80 −137.52 0.92 0.83 −1.69 −1.52 桐梓 220.23 198.21 4.49 4.04 1.45 1.31 皇新 15.42 13.88 0.90 0.81 0.14 0.13 表 5 官林镇剩余水环境容量Table 5. The remaining water environment capacity of Guanlin Townshipt∙a−1 污染物 水环境容量 污染物入河量 剩余水环境容量 COD 994.2 477.82 516.38 NH3-N 75.72 42.30 33.42 TP -1.20 6.18 -7.38 在空间尺度上,由表4可知,水环境容量在不同控制单元呈现出明显的动态分布。官林、桐梓与皇新COD环境容量之比为−1︰1.44︰0.10,NH3-N环境容量之比为1︰4.86︰0.98,TP环境容量比值为−1︰0.8︰0.08,说明官林镇水环境容量分布不均匀,且COD分布均匀性更差。其中官林镇临滆湖区域官林控制单元水环境容量小于桐梓与皇新控制单元,且COD、TP水环境容量出现负值。主要是因为官林控制单元人口密度较大,同时伴有水产养殖、畜禽养殖等人为活动,水产养殖以池塘高密度养殖为主,粗放养殖模式下养殖尾水直接排放至河道当中,导致河道淤泥与污染物沉淀严重,水体自净能力显著下降,同时入湖河道水质目标要求较高,河道上下游来水为孟津河与滆湖,水质介于Ⅲ类水与劣Ⅴ类水之间,在部分月份未能满足水功能区划要求;桐梓控制单元内河道本底水质基本满足水质目标,河道常流量较大,稀释容量较高,水环境容量仍有较多剩余;皇新控制单元汇水面积较少,水质在Ⅲ类水上下波动,剩余容量较少。
在时间尺度上,从图6可以看出,各控制单元水环境容量计算结果有明显的动态变化。各污染物水环境容量变化趋势基本相同,进一步对比各月份不同控制单元水环境容量可以看出各控制单元的水环境容量5月至9月变化幅度较大,主要是因为5月开始官林镇河网进入丰水期,受春夏交际“梅雨期”影响,降雨量增大,河道流量增大的同时上游入流水质、污染物入河量也随之变化,同时伴有鱼塘换水及农田灌溉排水等人为活动,导致水环境容量波动明显。
从表5可知,官林镇COD、NH3-N和TP剩余水环境容量分别为516.38、33.42和-7.38 t∙a−1,水环境容量差距悬殊,这与水质标准限值、河网水文条件有关,因此TP水环境容量敏感性最高。官林镇平原河网TP水环境容量超出阈值,需进行污染物削减,COD、NH3-N水环境容量仍有剩余,但官林控制单元水体污染严重,现状条件下几乎没有可利用的水环境容量,需进一步对流域农田径流、畜禽水产养殖等含磷污染源进行管控,采取河道环保疏浚、鱼塘升级改造等科学合理的治理措施,改善水环境质量。
3.3 代表河道水环境容量影响因素分析
由公式(4)可知,水质目标要求、水体平均流速、上游断面来水水质、污染物综合降解系数、非点源污染的时空变化性等都是影响水环境容量的重要影响因素。显而易见,水环境容量与污染物综合降解系数呈正相关,而流速与水环境容量的关系则复杂多变,当流速
ux=−K1x/ln(cs/c0) 由图7可知孟津河COD、NH3-N、TP水环境容量月均值分别为 (193.65±58.22) 、 (13.18±6.31) 、 (2.03±1.27) t;都山河COD、NH3-N、TP水环境容量月均值分别为 (15.00±10.39) 、 (0.24±1.14) 、 (0.02±0.14) t;观渎港COD、NH3-N、TP水环境容量月均值分别为 (−10.31±12.87) 、 (−0.17±0.57) 、 (−0.15±0.21) t,总体来看孟津河整体水环境状况良好,水环境容量基本满足水功能区划要求;都山河整体水环境容量仍有剩余,但出现部分月超标现象;观渎港水环境容量变化范围并不理想,均处于超标情况,由此可见随着河道平均流速的增大,水环境容量也随之增大,水环境容量达标率也逐步提高。由表6河道平均流速与水环境容量相关性可知,孟津河、都山河水环境容量变化与河道平均流量呈正相关,原因为孟津河、都山河上游来水基本满足水质目标要求,随着河道进入丰水期流速增加,微生物活性与生化反应速率提高,有利于水体污染物降解,汛期河道水质提高,导致水环境容量随着流速的增大而增大,呈现正相关性。而观渎港水环境容量变化与河流流量呈负相关,这与普遍认知的丰水期河道纳污能力强有所差别,原因可能是观渎港上游来水水质不满足水质目标要求,随着丰水期河道流速增大,水体交换和流动能力增强,水体自净能力虽有所增强,但河流常流量较小,受丰水期强降雨及上下游季节性河道水质影响较大,入河污染物量超出自净能力范围,汛期河道水质反而降低,导致平均流速越大,水环境容量越差,呈现负相关性。综上所述,官林镇平原河网中孟津河、都山河等水质整体达标河道水环境容量的变化大小与河流流速呈现正相关特征,而观渎港等水质整体不达标河道水环境容量的变化大小与河流流速呈现负相关特征。
表 6 代表河道平均流速与水环境容量相关性Table 6. Correlation between mean flow velocity and water environment capacity of representative stream channels河道 平均流量/ (m3∙s−1) 平均流速/ (m∙s−1) 水环境容量与平均流速相关性 COD NH3-N TP 孟津河 7.64 0.118 0.719 0.749 0.203 都山河 0.94 0.078 0.695 0.306 0.312 观渎港 0.59 0.052 -0.347 -0.511 -0.119 4. 结论
1) 利用MIKE11构建官林镇平原河网一维水环境模型,并依据2022年实测水文水质数据率定模型参数,官林镇平原河网河床糙率为0.028~0.035;纵向扩散系数为3~10 m·s−1;COD综合衰减系数为0.08~0.12 d−1;NH3-N综合衰减系数为0.06~0.09 d−1;TP综合衰减系数为0.06~0.10 d−1,其模拟水质变化趋势与实测值拟合程度较高,所确定的参数基本能反映河网水质时空演变规律。
2) 官林镇水环境容量计算结果显示,桐梓、皇新控制单元水环境容量仍有剩余;官林控制单元污染物排放量超出水体纳污能力,水环境容量存在数月超标现象,需进一步落实官林控制单元入湖河道清淤和滆湖水产养殖围网综合整治工作。
3) 孟津河、都山河等水质整体达标的河道水环境容量的变化趋势与各月流量和流速的变化趋势一致,呈正相关;观渎港等水质整体未达标的河道水环境容量与各月流量和流速呈负相关,说明水环境容量的大小受水量和水体流速等水文参数的影响较大。
-
表 1 官林镇采样点坐标
Table 1. The coordinates of sampling sites in Guanlin Township
监测点位置 断面名称 断面坐标 水环境质量控制目标 经度°E 纬度°N 滆湖 S30 119°45′11.63″ 31°29′46.78″ Ⅲ类 S31 119°45′39.66″ 31°30′35.15″ S32 119°45′57.82″ 31°31′38.51″ S33 119°46′15.40″ 31°32′28.19″ S34 119°46′25.50″ 31°33′5.16″ 官林控制单元 S1 119°44′39.10″ 31°29′46.07″ Ⅲ类 S3 119°44′48.23″ 31°30′1.44″ S5 119°44′56.99″ 31°30′19.03″ S7 119°45′11.28″ 31°30′42.75″ S9 119°45′20.15″ 31°31′16.74″ 官林控制单元 S11 119°45′30.01″ 31°31′56.04″ Ⅲ类 S13 119°45′36.90″ 31°32′18.35″ S15 119°45′39.04″ 31°32′39.18″ S26 119°44′44.29″ 31°28′49.01″ S27 119°44′34.56″ 31°28′54.75″ S28 119°44′30.02″ 31°29′5.30″ S29 119°44′37.26″ 31°29′34.81″ S35 119°45′49.79″ 31°33′15.92″ 桐梓控制单元 S2 119°43′26.89″ 31°30′0.13″ Ⅳ类 S4 119°43′30.68″ 31°30′19.95″ S6 119°43′42.04″ 31°30′32.48″ S8 119°43′57.43″ 31°30′58.92″ S10 119°44′16.18″ 31°31′30.68″ S12 119°44′22.85″ 31°32′14.42″ S14 119°44′33.14″ 31°32′36.27″ S16 119°44′33.14″ 31°32′59.52″ S17 119°43′11.97″ 31°29′48.55″ S18 119°42′52.34″ 31°29′22.39″ S19 119°42′38.06″ 31°29′2.18″ S36 119°44′34.51″ 31°33′39.7″ S37 119°43′41.40″ 31°33′43.68″ S38 119°42′57.56″ 31°33′21.65″ S39 119°42′35.36″ 31°32′59.27″ S40 119°41′58.96″ 31°32′36.36″ S41 119°41′40.36″ 31°31′52.74″ S42 119°41′19.91″ 31°30′50.53″ S43 119°40′39.44″ 31°30′23.22″ S44 119°40′7.38″ 31°29′25″ S20 119°42′7.00″ 31°28′23.14″ S21 119°41′35.66″ 31°27′59.75″ 皇新控制单元 S22 119°40′12.27″ 31°27′1.26″ Ⅲ类 S23 119°42′11.51″ 31°26′3.74″ S24 119°42′6.55″ 31°24′56.52″ S25 119°43′32.29″ 31°27′22.72″ 表 2 研究区域水质现状及水质目标
Table 2. Status of water quality and water quality objectives in the research area
污染物指标 统计值 滆湖 官林控制单元 桐梓控制单元 皇新控制单元 COD 浓度范围/(mg∙L−1) 2.07~25.80 7.20~38.02 4.83~70.95 6.86~67.60 平均值/(mg∙L−1) 22.18 26.03 24.37 21.38 水质目标/(mg∙L−1) ≤20 ≤20 ≤30 ≤20 断面超标率/% 52.08 44.79 19.05 26.71 NH3-N 浓度范围/(mg∙L−1) 0.02~2.84 0.02~1.99 0.04~2.53 0.01~2.24 平均值/(mg∙L−1) 0.63 0.82 0.97 0.73 水质目标/(mg∙L−1) ≤1 ≤1 ≤1.5 ≤1 断面超标率/% 33.33 27.78 14.88 11.13 TP 浓度范围/(mg∙L−1) 0.03~0.60 0.05~0.76 0.05~0.63 0.03~0.44 平均值/(mg∙L−1) 0.23 0.25 0.23 0.19 水质目标/(mg∙L−1) ≤0.05 ≤0.20 ≤0.30 ≤0.20 断面超标率/% 93.75 49.48 31.17 38.68 表 3 MIKE11模型参数率定结果
Table 3. parameter calibration results of MIKE11
河道名称 河床糙率n 对流扩散系数D/ (m2∙s−1) 综合降解系数K/d−1 COD NH3-N TP 孟津河 0.030 10 0.12 0.09 0.10 西孟河、北溪河、中干河 0.028 8 0.10 0.08 0.09 大埝河、中心河等孟津河支流 0.033 5 0.09 0.08 0.06 滂渎港、灌渎港等入滆湖河道 0.035 3 0.08 0.06 0.06 表 4 官林镇各控制单元水环境容量月均值
Table 4. Monthly average values of water environment capacity of each control unit in Guanlin Township
t 控制单元 COD NH3-N TP 考虑安全余量 未考虑安全余量 考虑安全余量 未考虑安全余量 考虑安全余量 未考虑安全余量 官林 −152.80 −137.52 0.92 0.83 −1.69 −1.52 桐梓 220.23 198.21 4.49 4.04 1.45 1.31 皇新 15.42 13.88 0.90 0.81 0.14 0.13 表 5 官林镇剩余水环境容量
Table 5. The remaining water environment capacity of Guanlin Township
t∙a−1 污染物 水环境容量 污染物入河量 剩余水环境容量 COD 994.2 477.82 516.38 NH3-N 75.72 42.30 33.42 TP -1.20 6.18 -7.38 表 6 代表河道平均流速与水环境容量相关性
Table 6. Correlation between mean flow velocity and water environment capacity of representative stream channels
河道 平均流量/ (m3∙s−1) 平均流速/ (m∙s−1) 水环境容量与平均流速相关性 COD NH3-N TP 孟津河 7.64 0.118 0.719 0.749 0.203 都山河 0.94 0.078 0.695 0.306 0.312 观渎港 0.59 0.052 -0.347 -0.511 -0.119 -
[1] 廖迎娣, 范俊浩, 张欢, 等. 长江下游平原河网地区生态护岸对河流生态系统影响的评价指标体系[J]. 水资源保护, 2022, 38(4): 189-194. [2] 魏蓥蓥, 李一平, 翁晟琳, 等. 太湖流域城市化对平原河网水系结构与连通性影响[J]. 湖泊科学, 2020, 32(2): 553-563. [3] 马小雪, 龚畅, 郭加汛, 等. 长江下游快速城市化地区水污染特征及源解析: 以秦淮河流域为例[J]. 环境科学, 2021, 42(7): 3291-3303. [4] 马秋霞, 逄勇, 胥瑞晨, 等. 底洞沟流域污染溯源及水环境容量研究[J]. 水资源与水工程学报, 2022, 33(4): 58-63. [5] 孙冬梅, 程雅芳, 冯平. 海河干流汛期动态水环境容量计算研究[J]. 水利学报, 2019, 50(12): 1454-1466. [6] 董飞, 刘晓波, 彭文启, 等. 地表水水环境容量计算方法回顾与展望[J]. 水科学进展, 2014, 25(3): 451-463. [7] 陈丁江, 吕军, 金培坚, 等. 非点源污染河流水环境容量的不确定性分析[J]. 环境科学, 2010, 31(5): 1215-1219. [8] 王华, 逄勇, 丁玲. 滨江水体水环境容量计算研究[J]. 环境科学学报, 2007(12): 2067-2073. doi: 10.3321/j.issn:0253-2468.2007.12.022 [9] 孔宇, 孙巍, 李小龙, 等. 河道海绵建设中SWMM-MIKE11耦合模型的构建及应用思路[J]. 水资源保护, 2021, 37(6): 74-79. [10] 陈焰, 夏瑞, 王璐, 等. 基于SWMM-EFDC耦合模拟的新凤河流域水环境治理工程效应评估[J]. 环境工程技术学报, 2021, 11(4): 777-788. doi: 10.12153/j.issn.1674-991X.20200283 [11] ERRAIOUI L, TAIA S, TAJ-EDDINE K, et al. Hydrological modelling in the ouergha watershed by soil and water analysis tool[J]. Journal of Ecological Engineering, 2023, 24(4): 343-356. doi: 10.12911/22998993/161043 [12] XUE B L, ZHANG H W, WANG Y T, et al. Modeling water quantity and quality for a typical agricultural plain basin of northern China by a coupled model[J]. Science of the Total Environment, 2021, 790: 148139. doi: 10.1016/j.scitotenv.2021.148139 [13] 陶亚, 陈宇轩, 赵喜亮, 等. 基于EFDC模型的阿什河水环境容量季节性分析[J]. 环境工程, 2017, 35(7): 65-69. [14] 李大鸣, 李佩瑶, 栗琪程, 等. 基于SWAT-WASP耦合的东洋河流域水质分析[J]. 安全与环境学报, 2021, 21(2): 849-857. [15] OBIN N, TAO H N, GE F, et al. Research on water quality simulation and water environmental capacity in lushui river based on WASP model[J]. Water, 2021, 13(20): 2819. doi: 10.3390/w13202819 [16] BUI L T, PHAM T H. Linking hydrological, hydraulic and water quality models for river water environmental capacity assessment[J]. Science of the Total Environment, 2022, 857: 159490. [17] FENNELL J, SOULSBY C, WILKINSON M E, et al. Time variable effectiveness and cost-benefits of different nature-based solution types and design for drought and flood management[J]. Nature-Based Solutions, 2023, 3: 100050. doi: 10.1016/j.nbsj.2023.100050 [18] THU MINH H V, TRI P D, UT V N, et al. A model-based approach for improving surface water quality management in aquaculture using MIKE 11: A case of the Long Xuyen Quadangle, Mekong Delta, Vietnam[J]. Water, 2022, 14(3): 412. doi: 10.3390/w14030412 [19] 丁洋, 赵进勇, 徐征和, 等. 基于SWAT模型的平原河湖水网区小流域径流过程模拟[J]. 水生态学杂志, 2019, 40(2): 7-13. [20] 李晋, 辛克刚, 王磊, 等. 基于MIKE11的城市雨源型河流再生水补水方案研究[J]. 给水排水, 2020, 56(S1): 681-686. [21] 王海森, 冯岚, 李百炼, 等. 基于MIKE 11的河网区域小型闸坝调控的水质响应模拟研究[J]. 环境科学学报, 2022, 42(8): 314-324. [22] 高丽莎, 高程程, 汪涛. 基于精细化河网水动力模型的长宁区除涝能力评估[J]. 水资源保护, 2021, 37(5): 62-67. [23] 龚世飞, 肖能武, 丁武汉, 等. 基于耕地承载力的十堰市畜禽养殖环境风险评价[J]. 中国农业科学, 2023, 56(5): 920-934. [24] 熊鸿斌, 张斯思, 匡武, 等. 基于MIKE 11模型的引江济淮工程涡河段动态水环境容量研究[J]. 自然资源学报, 2017, 32(8): 1422-1432. [25] 熊鸿斌, 陈雪, 张斯思. 基于MIKE11模型提高污染河流水质改善效果的方法[J]. 环境科学, 2017, 38(12): 5063-5073. [26] 杜慧玲, 于晓英, 曲茉莉. 松花江干流哈尔滨段COD和氨氮动态水环境容量研究[J]. 水资源与水工程学报, 2018, 29(2): 69-75+83. doi: 10.11705/j.issn.1672-643X.2018.02.12 期刊类型引用(1)
1. 王进喜,付怡琳. 污染物总量控制和地表水环境容量的研究进展. 兰州文理学院学报(自然科学版). 2024(05): 89-92+128 .  百度学术
百度学术
其他类型引用(5)
-


 下载:
下载:
