-
近年来,大气污染问题备受瞩目,已成为影响人们日常生活的重要因素。尤其是细颗粒物(PM2.5),由于其自身特性,易携带重金属、细菌和病毒等有害物质,对人体健康和生态环境造成了极大威胁[1-4],同时由于其具有光学特性,对太阳辐射强迫和气候变化也有重要影响[5]。研究者对国内多数大城市的PM2.5污染特征与成因进行了深入研究,对中小城市的研究也已全面起步,对PM2.5的组成结构[6-7]、形貌特征[8]、形成机制[9]和污染来源[10-11]等已经有了全面认识。城市大气环境中PM2.5的形成同时受本地污染源排放和区域传输的双重影响,区域传输受风速风向、逆温、湿度和边界层高度等气象条件影响显著[12],本地排放受燃煤、工业生产、机动车和扬尘等贡献突出[13]。各类污染源除直接排放一次PM2.5外,其排放的SO2、NOx、NH3和VOCs等气态前体物还可通过复杂的物理化学反应形成二次污染,二次无机离子(SNA,SNA=SO42−+NO3−+NH4+)和二次有机碳(SOC)均为PM2.5的主要组成部分[6,14],二次组分可占PM2.5的47%~63%[11]。随着我国大气污染治理工作的深入推进,SO2、NOx及一次PM2.5的排放得到有效控制,但二次污染问题日益凸显,VOCs、NH3和温室气体等逐渐成为影响城市大气环境的主要因素,PM2.5与臭氧协同控制、碳减排等区域性环境问题使当今大气污染防治工作面临着新一轮挑战[15-16]。
盐城市位于江苏沿海中部,是国家沿海发展和长三角一体化两大战略的交汇点,社会经济发展位居江苏中位,并处稳步前进阶段。但目前有关江苏省的大气污染研究中,针对盐城市的研究极少。2017年10月底至11月初我国北方地区发生一次区域性PM2.5重污染过程,本研究通过手工采集的方法捕获了盐城市此次污染过程,分析了PM2.5质量浓度以及水溶性离子、碳质组分等污染特征,并采用物质平衡法重构PM2.5,运用主成分分析法(PCA)分析PM2.5的主要来源,以此探究此次污染过程中PM2.5构成的变化规律,可为研究盐城市PM2.5污染成因和来源提供参考。
-
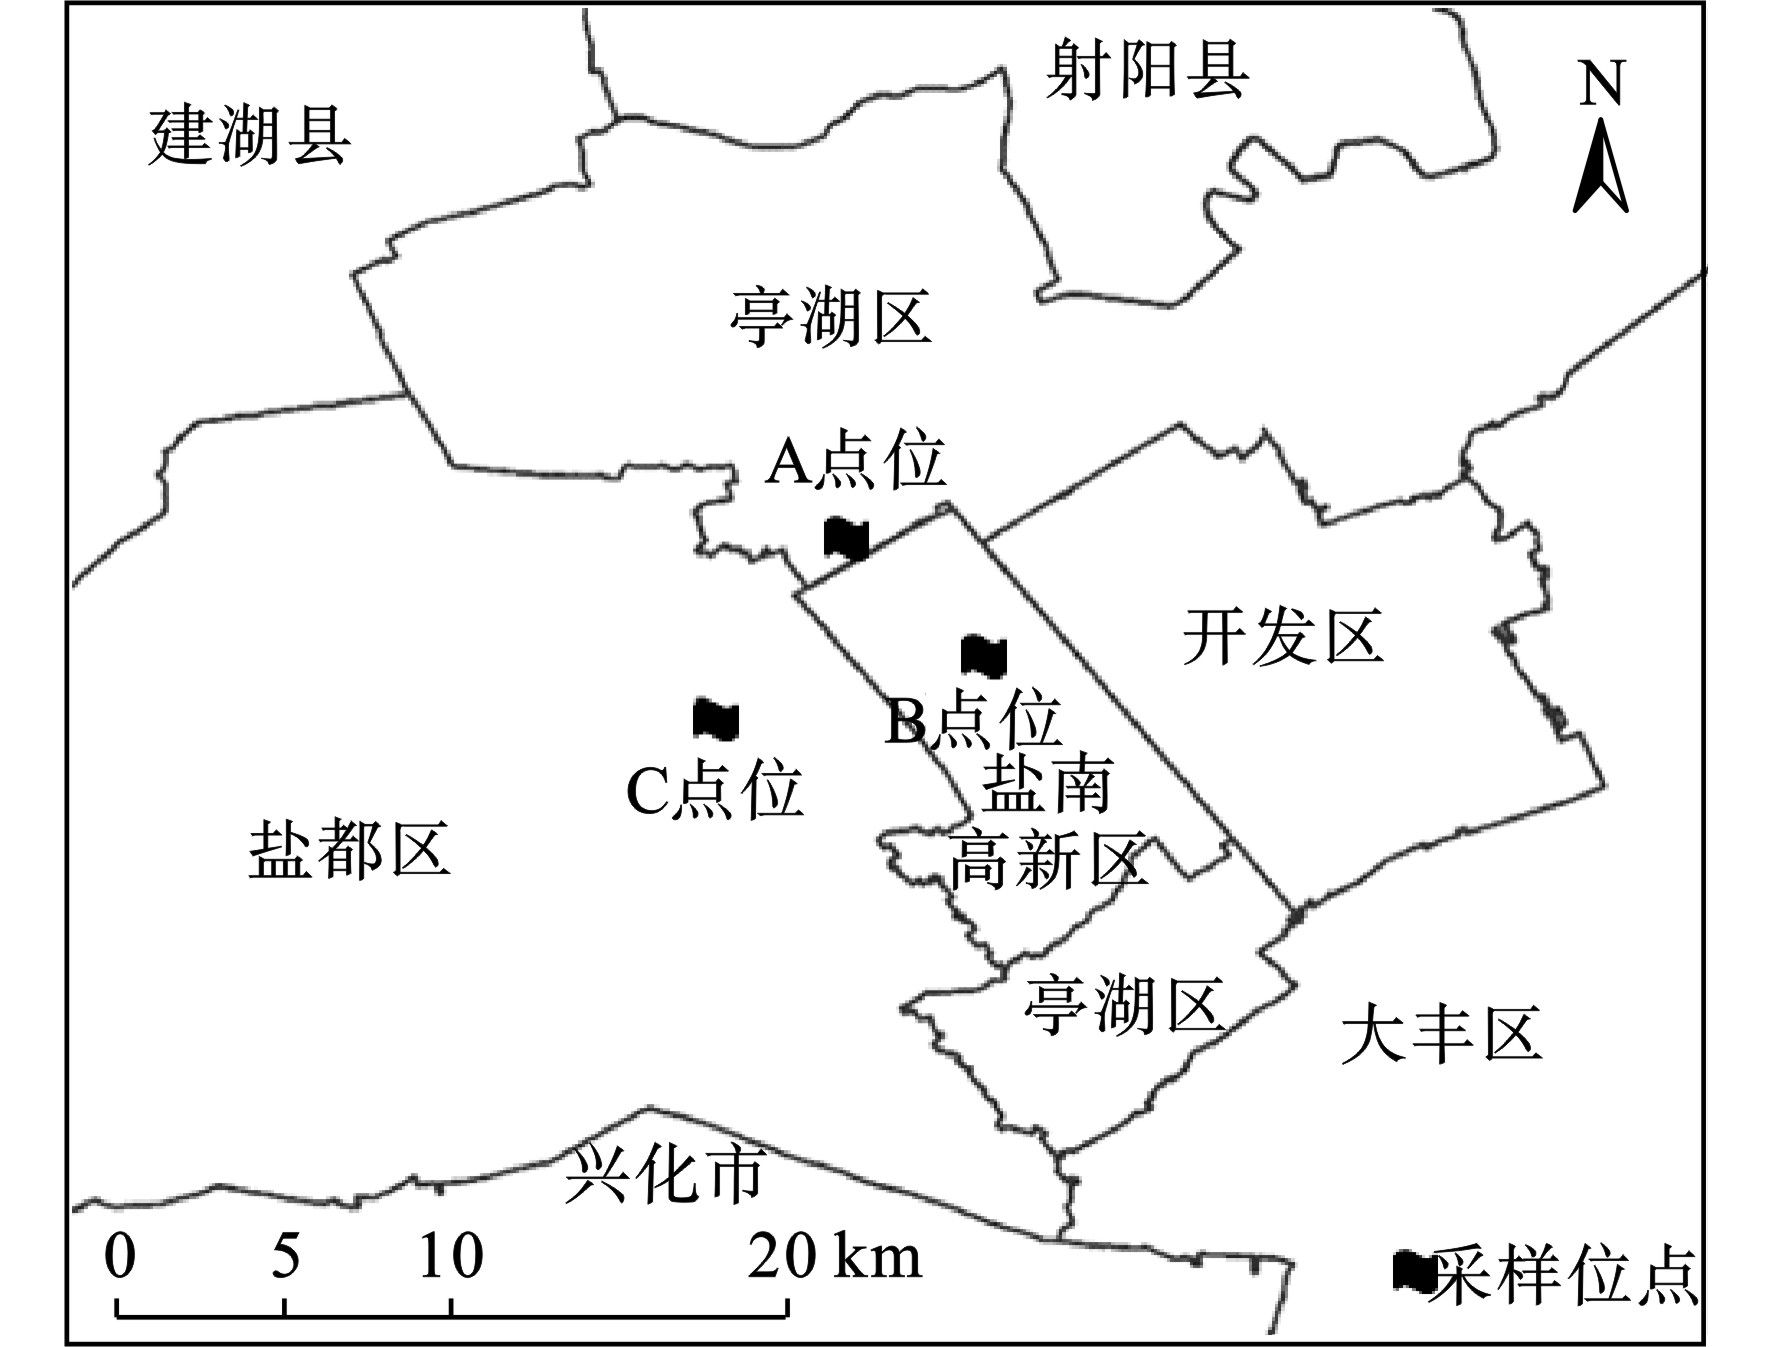
根据盐城市空间布局,在市区设置盐城市气象局(A)、盐塘河公园(B)和研创大厦(C)3个PM2.5采样点位,分别代表老城区、新城区和城郊结合区,见图1。
每个点位设置2台武汉天虹TH-150A中流量大气颗粒物采样器,分别使用90 mm的石英滤膜和聚丙烯纤维滤膜同步采集PM2.5,前者用于有机碳(OC)、元素碳(EC)和水溶性离子分析,后者用于PM2.5重量和元素分析,石英滤膜在使用前放入450 ℃的马弗炉中烘烤6 h去除有机物杂质。采样时段从当日上午11:00至次日上午9:00,共22 h,采样流量为100 L/min,自2017年10月29日至11月5日3个点位共采集有效样品20个。样品采集后,膜样品放入膜盒中,用自封袋密封,装入冰箱中(−4 ℃)避光保存至分析。
-
采样前后,使用瑞士梅特勒-托利多XP105DR十万分之一电子天平进行PM2.5样品称重。采用美国Sunset公司Model-4半连续有机碳/元素碳气溶胶分析仪对PM2.5中的OC、EC进行分析。采用瑞士万通Metrohm 883离子色谱仪对水溶性离子进行分析,包括SO42−、NO3−、Cl−、Na+、NH4+、K+、Mg2+和Ca2+。采用美国Agilent 7500cx电感耦合等离子体质谱仪(ICP-MS)分析PM2.5样品中的元素,包括Mg、Al、Si、Ca、Ti、V、Cr、Mn、Fe、Ni、Cu、Zn、As、Cd和Pb等无机元素。
-
本研究将利用化学组分重构方法来识别PM2.5的主要来源,涵盖的物种包括硫酸铵、硝酸铵、一次有机物(POM)、二次有机物(SOM)、EC、地壳尘和海盐,主要通过以下方法获取各类物种的浓度。
硫酸铵和硝酸铵由SO42− 和NO3−分别乘以系数获取,见式(1~2)[17]:
OC与EC的比值OC/EC通常用于衡量二次有机碳(SOC),当OC/EC﹥2时[18],表明OC中存在SOC,且OC/EC越大,SOC占OC比例越高,PM2.5中有机物(OM)通过OC乘以转换系数1.6获取[14,17,19]。SOC、OM、SOM和POM的计算,见式(3~6):
式中,(OC/EC)min为采样期间OC/EC的最小值,本研究取推荐值2.0。地壳尘根据主要地壳组分的氧化物(如Al2O3、SiO2、CaO、FeO/Fe2O3和TiO2)进行估算加和获取[17],见式(7):
海盐通常用Cl−或Na+乘以系数来估算,由于Cl−还可能受燃煤源的贡献,因此本研究中采用Na+估算法[17],见式(8):
-
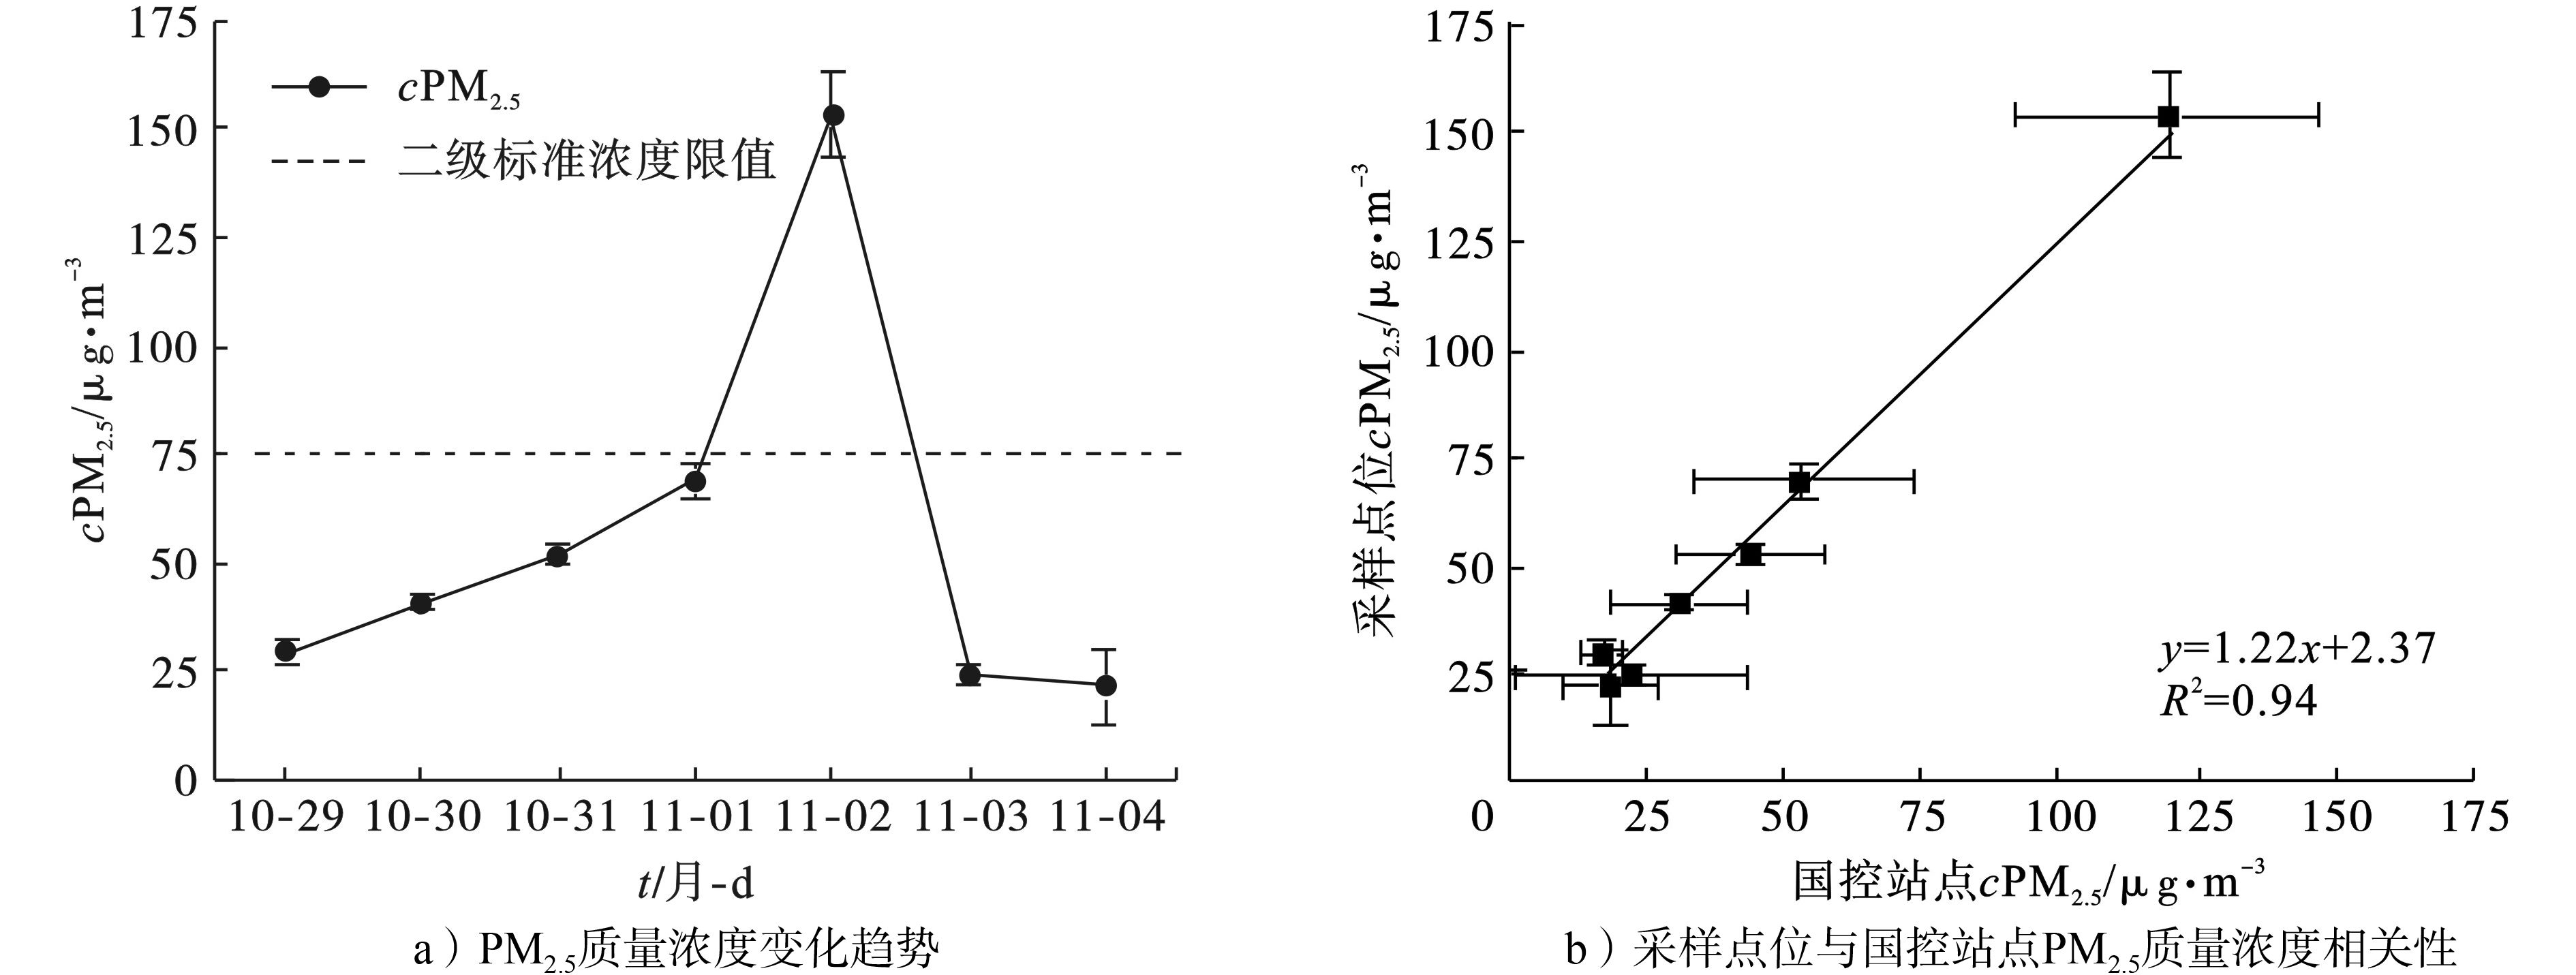
采样期间3个点位的PM2.5质量浓度变化,见图2a,整个过程呈现明显的倒V字型。PM2.5浓度从10月29日的一级优水平开始逐渐升高,11月2日夜间至11月3日上午达到四级中度污染水平,随后扩散条件转为有利,PM2.5浓度呈现快速下降趋势,至11月3日下午重新降至一级优水平,期间PM2.5平均浓度为(55.7±43.9) μg/m3,处于二级良的水平。采样期间各采样点位的PM2.5日平均浓度与盐城市4个空气质量国控站点的变化趋势基本一致,相关性显著,见图2b。期间,盐城市国控站点PM2.5最高小时浓度达到210 μg/m3,采样点位11月2日PM2.5平均浓度达到153.1 μg/m3,超出《环境空气质量标准:GB 3095—2012》二级日均浓度限值1.0倍。
-
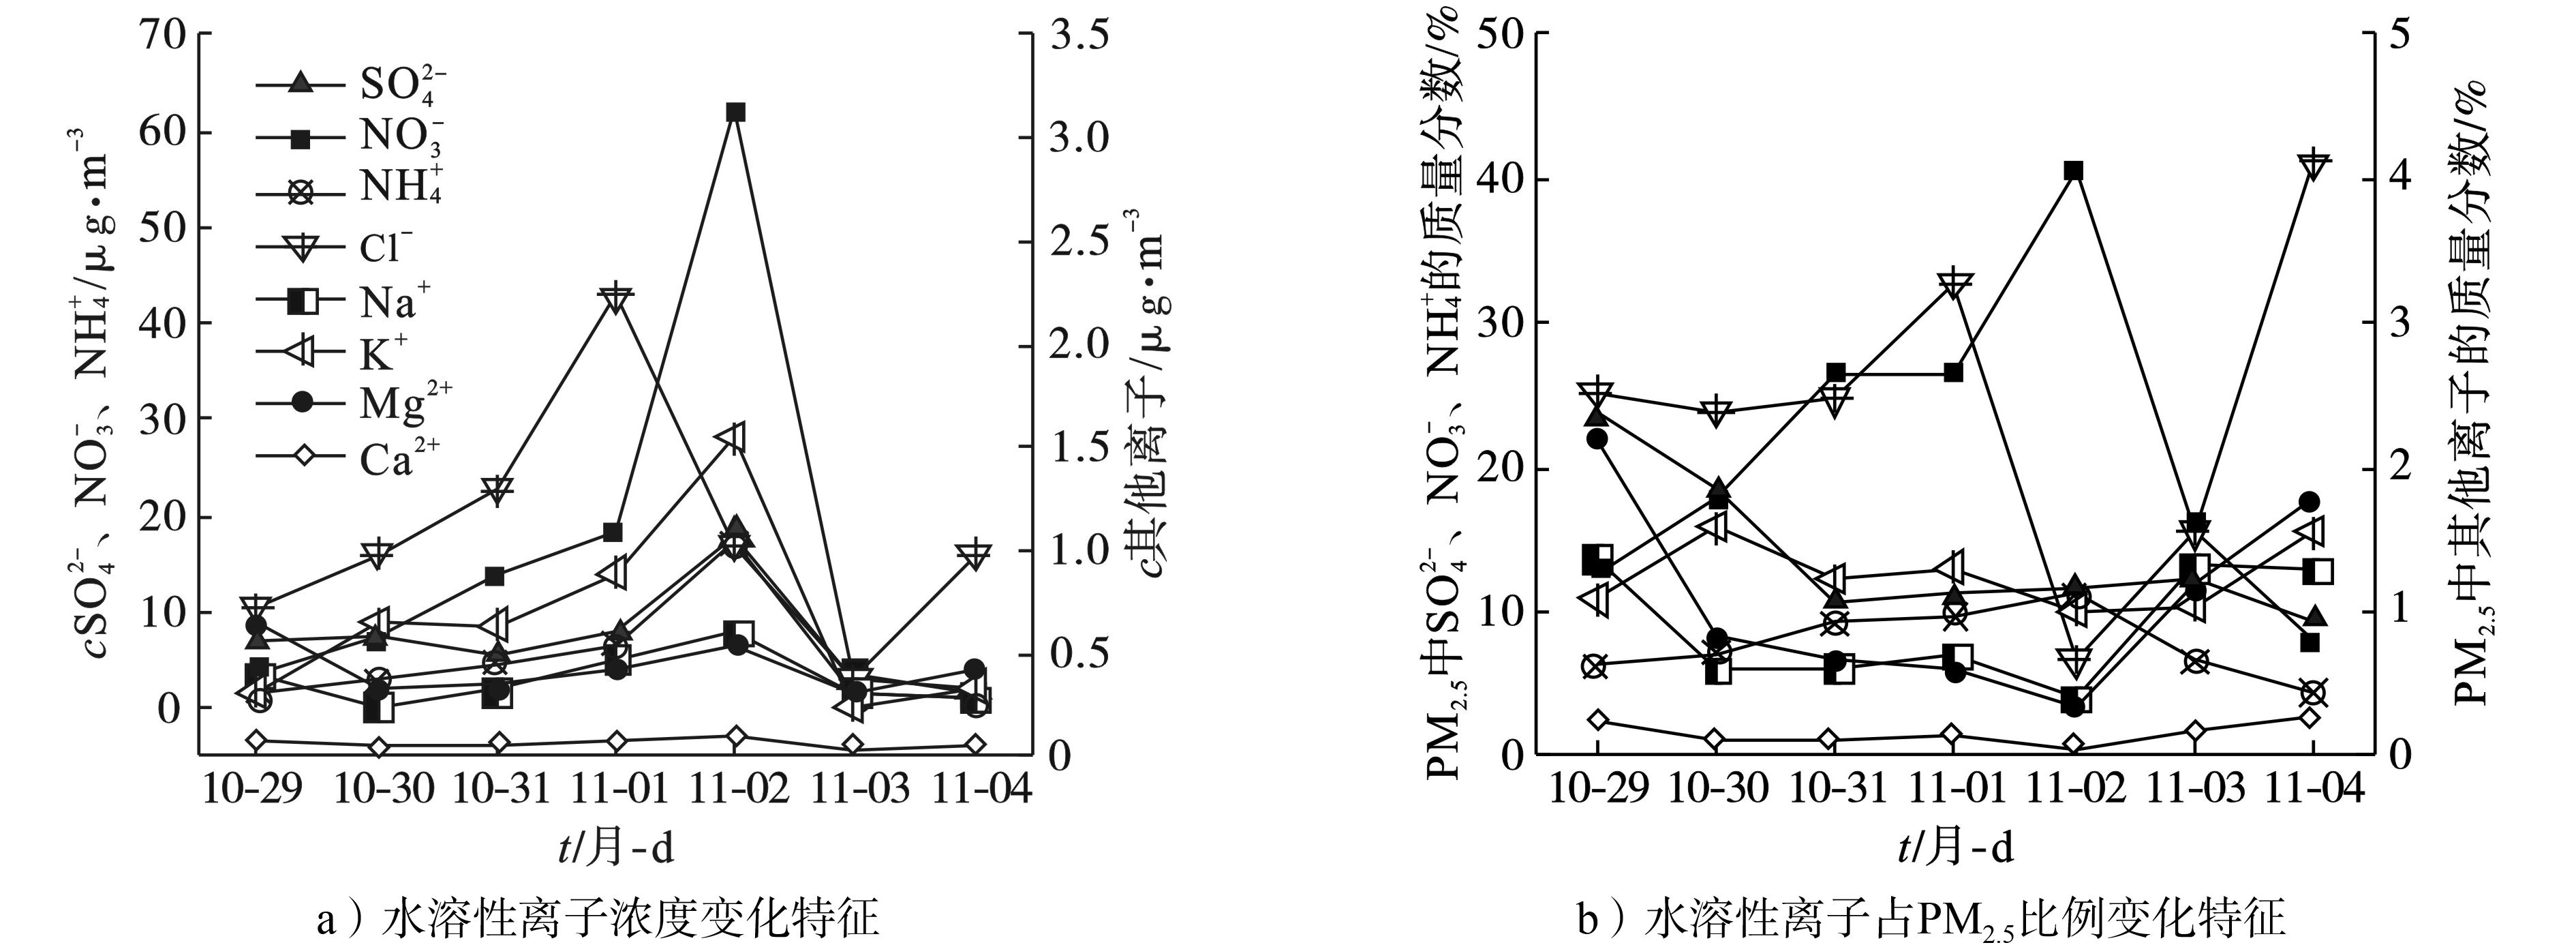
对采样期间PM2.5中的水溶性离子成分进行分析,见图3。
8种水溶性离子的总质量浓度平均值为(30.5±32.2) μg/m3,占PM2.5的48.5%,与北京[6]、上海[10]、南京[20]、南通[21]、徐州[22]和宿迁[23]等城市相比,此次污染过程盐城市PM2.5中水溶性离子处于中等水平。各离子浓度的排序为NO3−>SO42−>NH4+>Cl−>K+>Mg2+>Na+>Ca2+,其中二次无机离子NO3−、SO42−和NH4+质量浓度明显比其他离子高,平均值分别为(15.7±21.0) 、(7.2±5.7) 和(5.0±5.6) μg/m3,SNA占总水溶性离子浓度的比例平均为86.3%,在PM2.5中平均占比为42.7%,说明二次无机离子为PM2.5的主要成分,且这一比值高于北京、上海、徐州和宿迁等地。
从日变化特征来看,水溶性离子与PM2.5浓度的整体变化趋势基本一致。随着污染的加重,二次无机离子NO3−、SO42−、NH4+以及Cl−和K+的质量浓度均呈现快速升高趋势,其中NO3−升幅最大,11月1日较10月29日污染初期升高3.9倍,而11月2日较11月1日升高2.4倍,达到62.4 μg/m3。从各离子在PM2.5中占比的变化趋势中同样可以发现,PM2.5上升期,NO3−占比快速升高,使得浓度同样在升高的SO42−、NH4+、Cl−和K+占比仅呈现缓慢上升甚至出现下降,但SNA在PM2.5中占比整体呈现逐渐升高趋势,最高时达到63.6%,可见二次污染对此次污染过程的形成起主要作用,尤其受NO3−影响最为显著。随着污染减轻,SNA的质量浓度及占PM2.5比例均呈快速下降趋势。PM2.5上升和下降过程中,Na+、Mg2+和Ca2+在PM2.5中占比较低,质量浓度和所占比例仅呈小幅变化。
-
SO42−和NO3−在大气环境中形成过程比较复杂,用硫表观转化率和氮表观转化率来表示SO2和NO2的二次转化程度[9],见式(9~10):
式中,SOR指硫表观转化率,NOR指氮表观转化率,n指对应成分的物质的量。SOR、NOR大于0.1表明大气中有光化学氧化过程发生,且SOR和NOR越大,表明越多的SO2和NO2气体转化为SO42−和NO3−。
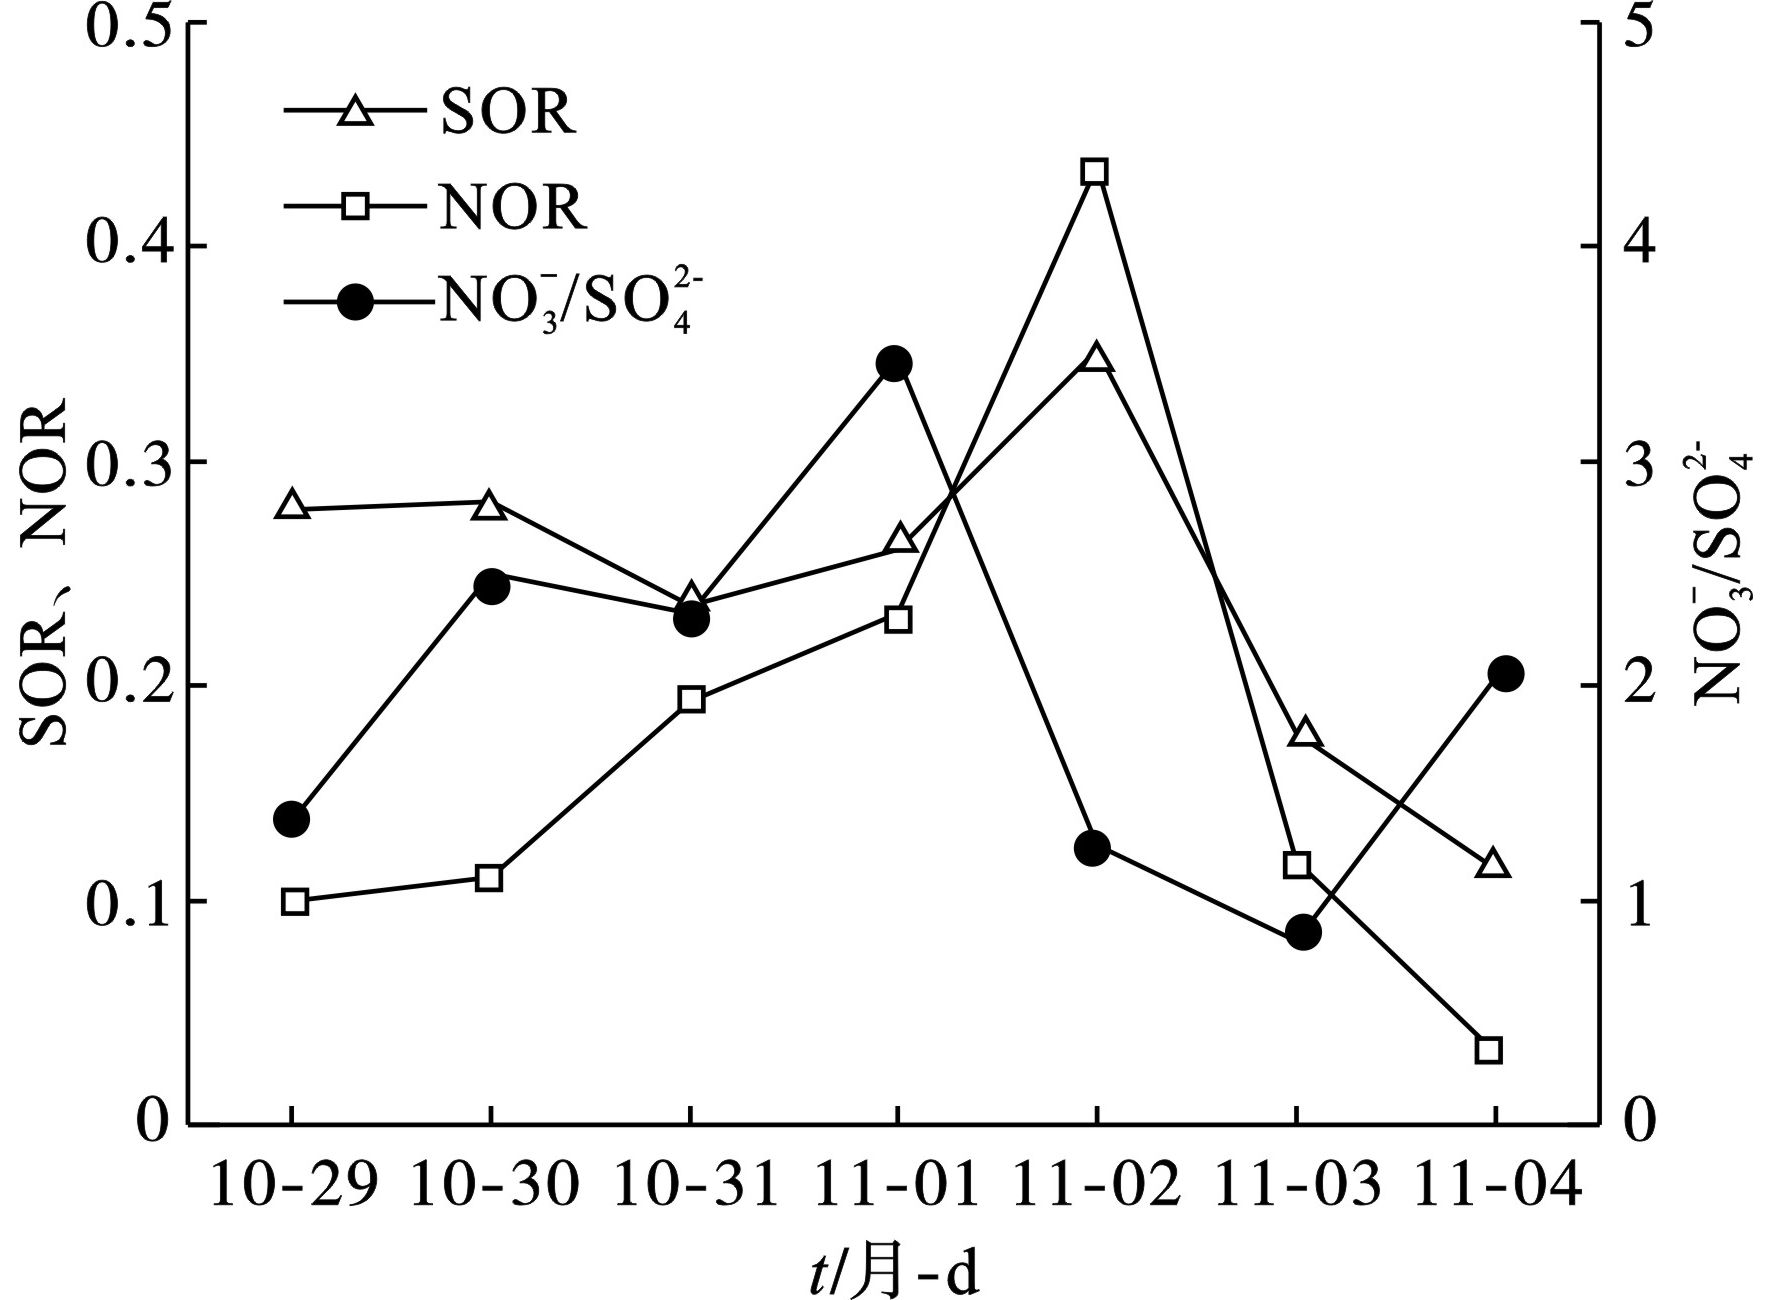
采样期间盐城市SOR和NOR的平均值各为0.24和0.17,从SOR和NOR的逐日变化趋势看,见图4,污染发生初期,NOR低于SOR,随着污染逐渐加重,NOR快速升高,至11月2日达到0.43,超过SOR(0.35),随后两者同时迅速下降,NOR下降幅度大于SOR。可见,盐城市此次污染过程同时受SO2和NO2的二次转化影响,但NO2的二次转化对PM2.5浓度的升高起主要作用,污染高峰时期NO3−为PM2.5主要成分,而非污染天气时SO2更易发生二次转化,PM2.5中SO42−占比高于NO3−。
大气环境中SO2和NOx的人为贡献主要为固定源(以燃煤源为主)和移动源(以机动车尾气为主),两者对颗粒物的贡献大小常用NO3−与SO42−的质量浓度比(NO3−/SO42−)来指示[6,10],当比值﹥1时,移动源贡献为主,比值﹤1时则以固定源贡献为主。期间,盐城市NO3−/SO42−的变化范围为0.83~3.50,平均值为1.91,说明移动源是盐城市此次污染过程的主要贡献源。
-
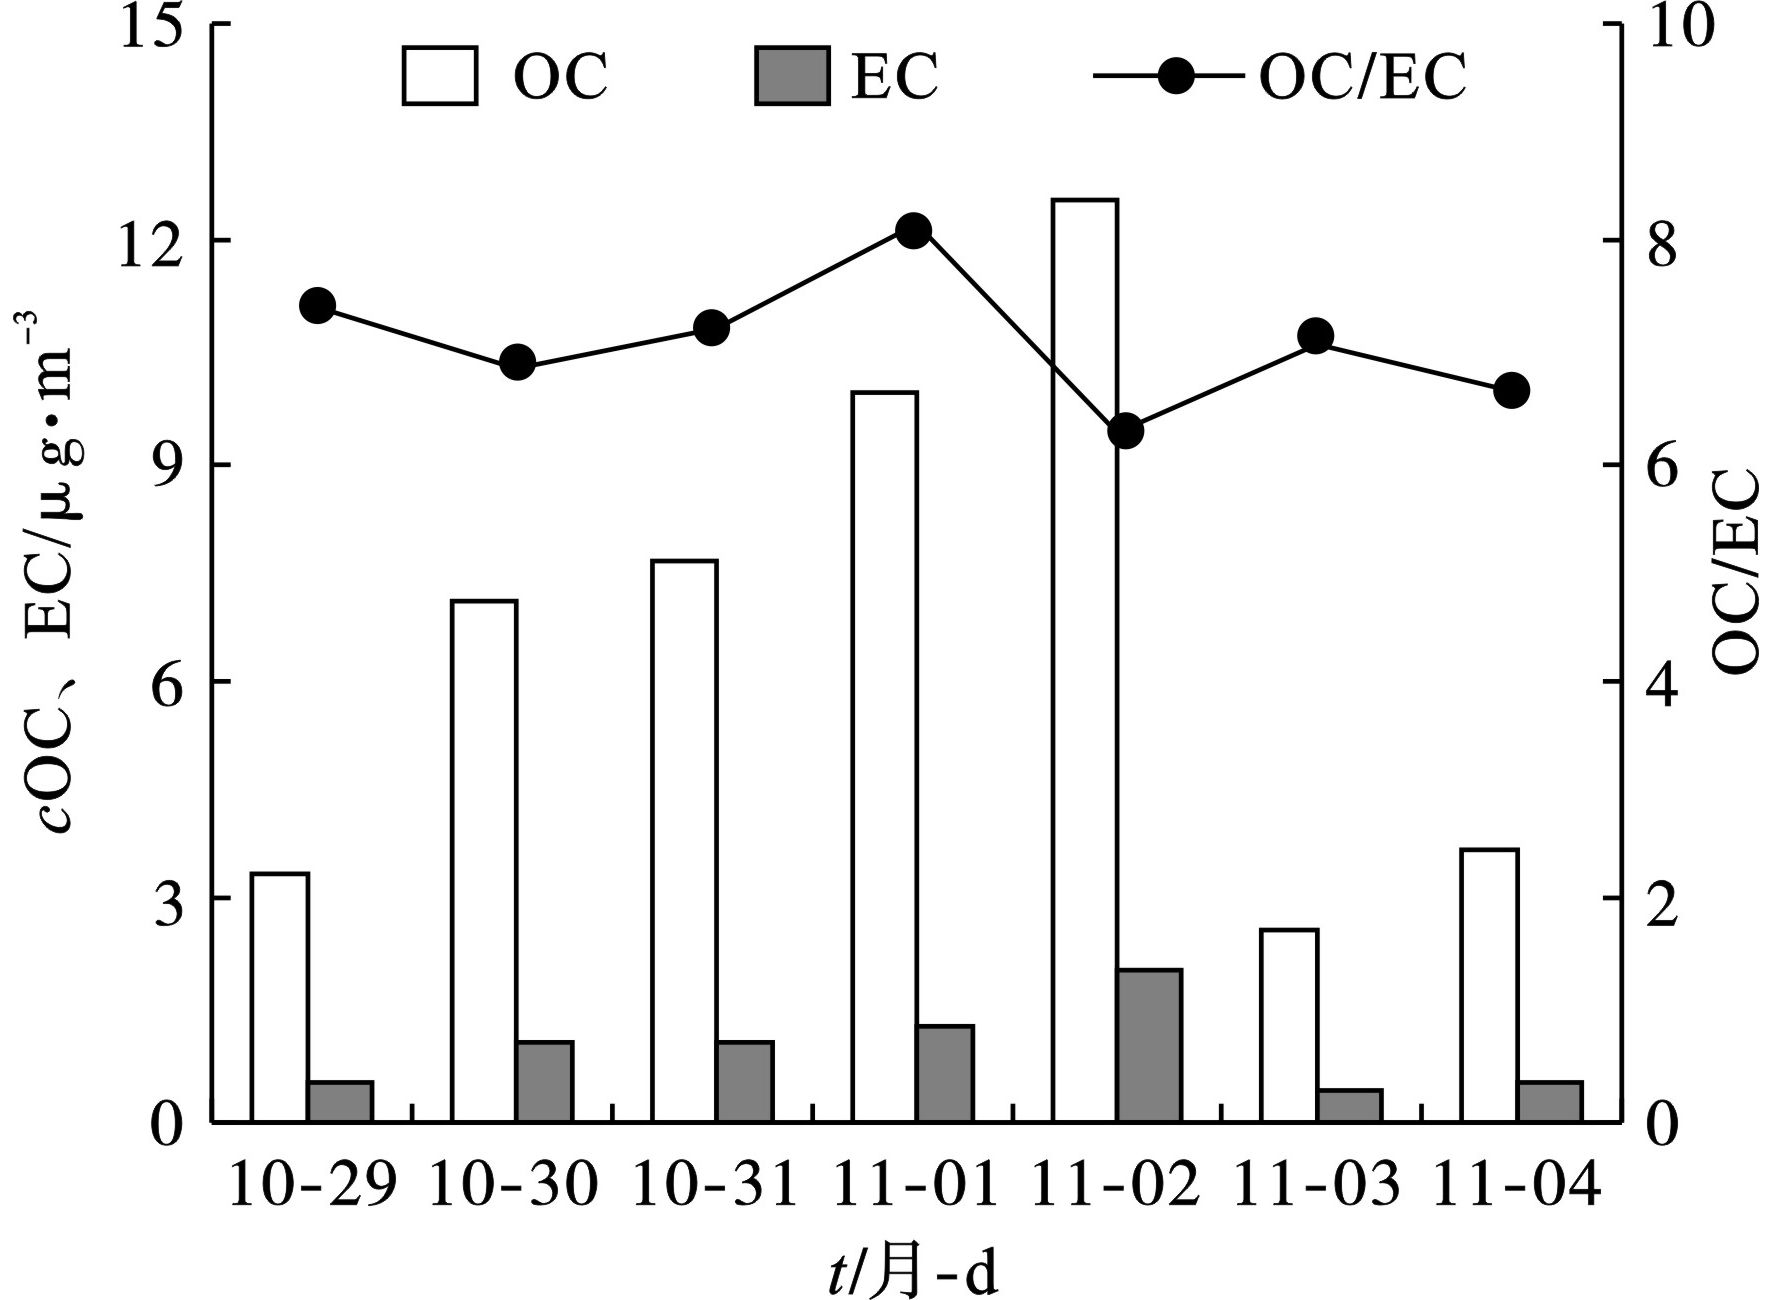
采样期间盐城市PM2.5中OC、EC质量浓度及OC/EC的逐日变化趋势,见图5。
结果显示,OC、EC的逐日变化趋势与PM2.5基本一致,OC浓度变化范围为2.6~12.6 μg/m3,EC变化范围为0.4~2.0 μg/m3,平均值分别为(6.5±3.6) 和(0.9±0.6) μg/m3,占PM2.5的平均比例分别为13.3%和1.9%,OC浓度整体上远高于EC,是PM2.5的重要组成部分。此次污染过程从起始阶段到污染高峰期再到结束,OC/EC整体上均远﹥2,平均值为7.0,表明存在明显的二次有机污染过程。采样期间SOC的质量浓度均值为(4.6±2.6) μg/m3,平均占PM2.5的9.5%,占OC的71.0%,高于南京[7]和常州[14]等城市,说明二次组分对盐城市的OC贡献尤为显著。
-
采用物质平衡方法重构获得的PM2.5质量浓度约为实测PM2.5质量浓度的88.2%,两者相关性良好(R2=0.99)。从各组分占PM2.5比重来看,见图6,硝酸铵和硫酸铵为主要组分,分别为27.3%和19.2%,主要由NOx、SO2和NH3等气态前体物通过二次转化生成。地壳尘、SOM和POM分别为15.9%、15.3%和6.1%,其中地壳尘主要来自各类扬尘源,SOM主要由VOCs等气态前体物通过复杂的物理化学反应转化生成,POM主要来自一次排放。海盐和EC占PM2.5比例较低,分别为2.3%和1.9%。污染上升期,PM2.5各组分中硝酸铵占比升幅显著,11月2日达到52.5%;硫酸铵占比变化不大,SOM占比有所降低,但两者质量浓度均处于升高趋势;地壳尘占比下降明显;POM、EC和海盐占比变化不大,且浓度较低,可见此次污染过程PM2.5浓度的升高主要由硝酸盐主导。
-
利用SPSS软件进行主成分分析,识别PM2.5主要污染源,提取了特征值﹥1的4个主成分,发现其解释了将近94%的总变量,见表1。
表1可知,主成分1中载荷较高的组分有SO42−、NO3−、NH4+、K+、EC和OC,解释了36.6%的贡献率。其中SO42−、NO3−和NH4+主要由SO2、NOx和NH3等经二次转化生成,与燃煤源和交通源有关[24],K+和OC主要来自生物质燃烧,OC同时还有二次生成,与VOCs排放源有关,EC主要来自交通源、燃煤源和生物质燃烧源[25],因此主成分1被认为是燃煤源、交通源和生物质燃烧源的综合源。主成分2中载荷较高的组分有Cd、As、Pb、Mn和Fe,解释了26.0%的贡献率,Cd、As和Pb主要来自燃煤源[26-27]以及金属工业[28-29],Mn和Fe主要来自金属工业[28-29],因此主成分2被认为是工业源。主成分3中载荷较高的组分有Mg2+、Ca2+、V和Cu,解释了16.6%的贡献率,其中Mg2+、Ca2+为地壳元素,可指示土壤扬尘源和建筑扬尘源[24],V是燃油的特征元素[26],对于水路货运量在江苏省排名靠前的盐城市来说,船舶的排放贡献不可忽视,Cu主要来自道路扬尘[28]和金属工业[29],因此主成分3被认为是扬尘源和船舶交通源的综合源。主成分4中载荷较高的组分有Si和Cl−,解释了14.8%的贡献率,其中Si是土壤扬尘的特征元素[26],Cl−主要来自燃煤源[24],因此主成分4被识别为扬尘源和燃煤源。
综合分析可知,盐城市此次PM2.5污染过程的主要贡献源为燃煤源、交通源、工业生产、扬尘源以及生物质燃烧源等。从盐城市情来看,其经济社会发展水平位居江苏中位,并处于快速前进阶段。煤炭消耗量、机动车保有量等均位居江苏省中游水平,并呈增长趋势,冶金、化工和涂装企业数量较多,水路货运量、农林牧渔业总产值均位居江苏省前列,房地产业稳步发展,由此导致NOx、SO2、NH3、VOCs和一次PM2.5等污染物排放量处于高位,对城市大气环境造成一定影响。当气象条件不利时,污染物易通过二次转化、累积等过程形成较重污染。
-
(1)采样期间,PM2.5平均浓度为(55.7±43.9) μg/m3,处于二级良的水平,11月2日达到153.1 μg/m3,超出空气质量二级标准浓度限值1.0倍,采样点位与国控站点PM2.5浓度相关性显著。
(2)PM2.5组分中,水溶性离子的总质量浓度平均值为(30.5±32.2) μg/m3,平均占PM2.5的48.5%,其中SNA平均占比42.7%;随着污染加重,SNA、Cl−和K+质量浓度呈快速升高趋势,Na+、Mg2+和Ca2+质量浓度及占PM2.5比例变化幅度不显著,且占PM2.5比例较低。
(3)采样期间,SOR和NOR的平均值分别为0.24和0.17,表明存在明显的二次转化作用;污染高峰期,NOR(0.43)高于SOR(0.35),表明NO2的二次转化对PM2.5浓度的升高起主要作用;NO3−/SO42−的变化范围为0.83~3.50,平均值为1.91,表明机动车是此次污染过程的主要贡献源。
(4)采样期间OC浓度变化范围为2.6~12.6 μg/m3,EC浓度为0.4~2.0 μg/m3,OC/EC平均值7.0,表明存在明显的二次有机污染过程,SOC平均占OC的71.0%,占PM2.5的9.5%。
(5)组分重构及PCA结果表明,硝酸铵、硫酸铵、地壳尘和SOM为此次污染过程PM2.5的主要组分,二次转化是形成污染的主要原因,燃煤源、交通源、工业生产、扬尘源以及生物质燃烧源为此次污染过程的主要贡献源。
盐城市秋季典型PM2.5污染过程的组分及来源特征
Characteristics of composition and pollution source during a typical PM2.5 pollution period in autumn of Yancheng
-
摘要: 为探究盐城市大气环境PM2.5污染特征,于2017年10月29日~11月5日对一次典型PM2.5污染过程进行了监测采样,分析了水溶性离子、碳质组分等成分的污染特征以及PM2.5主要来源。结果表明,PM2.5浓度整体呈典型的倒V字型变化特征,平均质量浓度为(55.7±43.9) μg/m3,处于二级良的水平。各化学组分中,水溶性离子总质量浓度平均值为(30.5±32.2) μg/m3,占PM2.5的48.5%,其中SNA为主要成分,平均占PM2.5的42.7%;NO3−/SO42−的平均值为1.91,表明移动源对此次污染过程的贡献大于固定源;碳质组分OC/EC的平均值为7.0,表明存在明显的二次有机污染过程,其中SOC平均占OC的71.0%,占PM2.5的9.5%。PM2.5组分重构及主成分分析结果表明,二次转化是形成此次污染的主要原因,燃煤源、交通源、工业生产、扬尘源以及生物质燃烧源为主要贡献源。Abstract: In order to explore the pollution characteristics of atmospheric PM2.5 in Yancheng, a typical PM2.5 pollution process was monitored and sampled from October 29th to November 4th, 2017. The pollution characteristics of water-soluble ions and carbon components and the main sources of PM2.5 were analyzed. The results showed that PM2.5 concentration presented a typical inverted V-shaped change characteristic with average mass concentration of (55.7±43.9) μg/m3, which was in the level of the second stage denoted a good air quality. Among various components, the average mass concentration of water-soluble inorganic ions was (30.5±32.2) μg/m3, accounting for 48.5% of PM2.5 with SNA as the main component accounting for 42.7%. The average value of NO3−/SO42− was 1.91, thus indicating that mobile pollution sources contributed more to the pollution process than stationary pollution sources. The average value of OC/EC was 7.0, thus indicating there was an obvious secondary organic pollution process with the SOC accounted for 71.0% and 9.5% of OC and PM2.5. The results of PM2.5 component reconstruction and principal component analysis showed that the secondary transformation mainly caused the pollution process. It can be found that coal burning, traffic, industrial production, dust and biomass combustion as the main contributing sources.
-
Key words:
- PM2.5 /
- water-soluble ions /
- carbonaceous component /
- secondary transformation /
- Yancheng
-

-
表 1 PM2.5中主成分旋转因子载荷矩阵
组分 主成分1 主成分2 主成分3 主成分4 OC 0.899 −0.031 0.092 0.380 EC 0.962 0.017 0.064 0.256 Cl− 0.227 −0.361 0.184 0.795 NO3− 0.916 0.286 0.226 0.120 SO42− 0.923 0.121 0.343 −0.088 NH4+ 0.919 0.262 0.235 0.163 Na+ 0.642 0.330 0.651 0.220 K+ 0.947 0.102 0.166 0.251 Mg2+ 0.191 −0.183 0.890 −0.299 Ca2+ 0.519 −0.021 0.776 0.349 Al −0.401 0.085 −0.546 −0.353 Si 0.130 0.023 −0.019 0.819 Ti −0.260 0.602 −0.081 −0.720 Fe 0.462 0.826 0.041 −0.085 V 0.374 0.259 0.827 0.268 Cr 0.824 0.458 0.261 0.024 Mn 0.452 0.849 0.066 0.265 Ni 0.673 0.616 0.300 0.272 Cu −0.291 −0.227 0.689 −0.590 Zn 0.546 0.620 0.212 0.459 As −0.226 0.942 −0.160 −0.151 Cd 0.113 0.956 −0.031 −0.227 Pb 0.298 0.934 −0.010 −0.153 特征值 8.407 5.990 3.816 3.406 贡献率/% 36.551 26.044 16.592 14.809 累计贡献/% 36.551 62.595 79.186 93.995 -
[1] 陈晨, 仲宇, 刘园园, 等. 2013—2018年北京市大气PM2.5持续高暴露对居民因病入院的急性影响[J]. 环境科学研究, 2021, 34(1): 213 − 219. [2] 张梦娇, 苏方成, 徐起翔, 等. 2013~2017年中国PM2.5污染防治的健康效益评估[J]. 环境科学, 2021, 42(2): 513 − 522. [3] COHEN A J, BRAUER M, BURNETT R, et al. Estimates and 25-year trends of the global burden of disease attributable to ambient air pollution: An analysis of data from the Global Burden of Diseases Study 2015[J]. The Lancet, 2017, 389(10082): 1907 − 1918. doi: 10.1016/S0140-6736(17)30505-6 [4] APTE J S, MARSHALL J D, COHEN A J, et al. Addressing global mortality from ambient PM2.5[J]. Environmental Science Technology, 2015, 49(13): 8057 − 8066. doi: 10.1021/acs.est.5b01236 [5] STIER P, SEINFELD J, KINNE S, et al. Aerosol absorption and radiative forcing[J]. Atmospheric Chemistry and Physics, 2007, 7(19): 5237 − 5261. doi: 10.5194/acp-7-5237-2007 [6] 李欢, 唐贵谦, 张军科, 等. 2017~2018年北京大气PM2.5中水溶性无机离子特征[J]. 环境科学, 2020, 41(10): 4364 − 4373. [7] 徐足飞, 曹芳, 高嵩, 等. 南京北郊秋季PM2.5碳质组分污染特征及来源分析[J]. 环境科学, 2018, 39(7): 3033 − 3041. [8] 赵承美, 邵龙义, 侯聪, 等. 北京、郑州和深圳三城市空气中气溶胶单颗粒特征的扫描电镜分析[J]. 岩石矿物学杂志, 2015, 34(6): 925 − 931. doi: 10.3969/j.issn.1000-6524.2015.06.018 [9] 贾佳, 丛怡, 高清敏, 等. 中原城市冬季两次重污染形成机制及来源[J]. 环境科学, 2020, 41(12): 5256 − 5266. [10] DU W J, ZHANG Y R, CHEN Y T, et al. Chemical characterization and source apportionment of PM2.5 during spring and winter in the Yangtze River Delta, China[J]. Aerosol and Air Quality Research, 2017, 17(9): 2165 − 2180. doi: 10.4209/aaqr.2017.03.0108 [11] QIAO X, YING Q, LI X H, et al. Source apportionment of PM2.5 for 25 Chinese provincial capitals and municipalities using a source-oriented Community Multiscale Air Quality model[J]. Science of the Total Environment, 2018, 612: 462 − 471. doi: 10.1016/j.scitotenv.2017.08.272 [12] 韩博威, 马晓燕. 2014—2018年冬季长三角强霾事件及天气形势影响分析[J]. 环境科学学报, 2020, 40(7): 2333 − 2345. [13] ZHENG B, TONG D, LI M, et al. Trends in China's anthropogenic emissions since 2010 as the consequence of clean air actions[J]. Atmospheric Chemistry and Physics, 2018, 18(19): 14095 − 14111. doi: 10.5194/acp-18-14095-2018 [14] 叶招莲, 刘佳澍, 李清, 等. 常州夏秋季PM2.5中碳质气溶胶特征及来源[J]. 环境科学, 2017, 38(11): 4469 − 4477. [15] 王韵杰, 张少君, 郝吉明. 中国大气污染治理: 进展·挑战·路径[J]. 环境科学研究, 2019, 32(10): 1755 − 1762. [16] 李红, 彭良, 毕方, 等. 我国PM2.5与臭氧污染协同控制策略研究[J]. 环境科学研究, 2019, 32(10): 1763 − 1778. [17] WANG H B, TIAN M, LI X H, et al. Chemical composition and light extinction contribution of PM2.5 in urban Beijing for a 1-year period[J]. Aerosol and Air Quality Research, 2015, 15(6): 2200 − 2211. doi: 10.4209/aaqr.2015.04.0257 [18] CHOW J C, WATSON J G, LU Z Q, et al. Descriptive analysis of PM2.5 and PM10 at regionally representative locations during SJVAQS/AUSPEX[J]. Atmospheric Environment, 1996, 30(12): 2079 − 2112. doi: 10.1016/1352-2310(95)00402-5 [19] XING L, FU T M, CAO J J, et al. Seasonal and spatial variability of the OM/OC mass ratios and high regional correlation between oxalic acid and zinc in Chinese urban organic aerosols[J]. Atmospheric Chemistry and Physics, 2013, 13(8): 4307 − 4318. doi: 10.5194/acp-13-4307-2013 [20] 罗干, 王体健, 赵明, 等. 基于在线监测的南京仙林PM2.5组分特征与来源解析[J]. 中国环境科学, 2020, 40(5): 1857 − 1868. doi: 10.3969/j.issn.1000-6923.2020.05.001 [21] 蒋荣, 严飞, 杨杰, 等. 南通市冬季PM2.5中水溶性离子污染特征[J]. 环境监控与预警, 2020, 12(2): 45 − 48. doi: 10.3969/j.issn.1674-6732.2020.02.009 [22] 范美益, 曹芳, 张园园, 等. 徐州市冬季大气细颗粒物水溶性无机离子污染特征及来源解析[J]. 环境科学, 2017, 38(11): 4478 − 4485. [23] 马红璐, 赵欣, 陆建刚, 等. 宿迁市PM2.5中水溶性无机离子的季节特征和来源分析[J]. 环境科学, 2020, 41(9): 3899 − 3907. [24] 程渊, 吴建会, 毕晓辉, 等. 武汉市大气PM2.5中水溶性离子污染特征及来源[J]. 环境科学学报, 2019, 39(1): 189 − 196. [25] 鲍秋阳, 王毅勇, 张学磊, 等. 吉林市大气PM2.5污染特征及来源分析[J]. 环境保护科学, 2018, 44(3): 74 − 79. [26] 赵晓亮, 岳阳霞, 许端平, 等. 阜新市秋冬季节PM2.5中无机元素污染特征及来源[J]. 中国环境科学, 2020, 40(10): 4247 − 4258. doi: 10.3969/j.issn.1000-6923.2020.10.007 [27] 崔巧丽, 王京伟, 肖强, 等. 采暖季延庆城区大气PM2.5中金属元素污染特征及来源分析[J]. 环境保护科学, 2019, 45(6): 71 − 75. [28] 张晓茹, 孔少飞, 银燕, 等. 亚青会期间南京大气PM2.5中重金属来源及风险[J]. 中国环境科学, 2016, 36(1): 1 − 11. doi: 10.3969/j.issn.1000-6923.2016.01.001 [29] TAIWO A M, HARRISON R M, SHI Z. A review of receptor modeling of industrially emitted particulate matter[J]. Atmospheric Environment, 2014, 97: 109 − 120. doi: 10.1016/j.atmosenv.2014.07.051 -


 下载:
下载:
