

-
PM2.5作为灰霾天气的主要污染物之一[1],对人类健康、区域生态环境甚至全球气候均产生较大的负面影响[2-3]. 研究表明,水溶性无机离子(water soluble inorganic ions, WSIIs)是PM2.5的重要组分,可占其质量的30%—80%[4-5]. 通常,二次无机离子(SNA,即sulfate, SO42−; nitrate, NO3−; ammonium, NH4+)在WSIIs中具有主导地位[6-8]. 例如有研究发现,在天津2014年冬季一次典型重污染过程中,PM2.5的爆发式增长与SNA浓度激增密切相关[9];在京津冀地区2018年1月的某次污染过程中SNA占比和二次转化效率均显著提升[10]. SNA主要由SO2、NOx和NH3等气态前体物经过复杂的大气化学反应生成[11],而大气强氧化性[12]以及较低的大气边界层高度(boundary layer height, BLH)[10]、低风速(wind speed, WS)、高相对湿度(relative humidity, RH)等气象条件均有利于前体物的转化,进而使得污染加剧. 同时,区域传输和本地污染物的排放也是加剧大气污染的重要影响因素[13-15]. 春节作为我国最受重视的传统节日,期间车流量减少和社会生产活动水平下降可使区域性污染排放结构发生明显变化[16]. 然而有研究显示,除烟花爆竹导致的除夕夜较为短暂的大气污染外,春节期间城市持续性的大气污染事件仍可发生. 例如2020年春节假期,在受新冠疫情爆发叠加影响的情形下[17-18],我国华北和东部地区仍然出现了严重的灰霾污染事件[19-20]. 因此,探明城市春节期间重污染事件发生机制具有重要意义[21].
天津市位于我国环渤海心脏地带,是京津冀地区典型大气污染重点治理和联防联控的核心环节城市之一[22-23]. 近年来,随着“大气污染防治行动计划(2013—2017)”和“打赢蓝天保卫战三年行动计划”等大气减排措施的制定实施,天津空气质量得到明显改善[24]. 例如PM2.5(空气动力学当量直径 ≤ 2.5 μm的细颗粒物)年均浓度从2015年70 μg·m−3降至2021年39 μg·m−3(降幅30%)[25-26],但是天津市冬季重污染天气仍时有发生[22]. 本研究通过采集天津2018—2020年连续3年春节假期期间PM2.5样品,测定PM2.5及水溶性离子的浓度并分析其变化特征;结合气象参数、硫/氮氧化率等探讨春节假期污染事件中SNA的形成过程;综合考虑区域传输以及疫情效应等影响因素,对比阐释天津连续3年春节假期不同污染事件的生成机制,为春节期间城市大气污染防控提供科学支撑.
-
本研究观测点设置在天津大学卫津路校区教学楼楼顶(39.11°N,117.16°E,距地面高度约25 m),周围分布有高校、交通干道、居民区、商业区、无大型工业区,可代表典型城市环境[27].
PM2.5样本采集周期为当日8:00—次日7:00,采样时段为春节假期(SFH):2018年2月15日至21日;2019年2月4日至10日;2020年1月24日至30日. 根据《环境空气质量标准(GB 3095—2012)》中规定的24 h PM2.5平均浓度大于75 μg·m−3为污染天[28],在采样时段内划分出以下2段污染期:2018年2月15日至21日(污染期Ⅰ,春节假期均处于污染期,共7 d)、2020年1月25日至28日(污染期Ⅱ,处于疫情防控期,共4 d).
采样器为美国Tisch大流量细颗粒物采样器(TE-6070D-BLX, TEI, USA),切割粒径为2.5 μm,流量为1.15 m³·min−1,采样用的石英纤维滤膜(25 cm × 20 cm, PALL, USA)提前进行450 ℃高温煅烧处理,样品采集后保存至-20 ℃冰箱中. 样品膜经超纯水超声洗脱萃取后得到的洗脱液,通过离子色谱仪(ICS 5000+, Thermo Fisher Scientific, USA)测定其中8种水溶性无机离子浓度(Cl−、SO42−、NO3−、Na+、NH4+、K+、Mg2+、Ca2+). 气象数据如温度(T)、风速、风向(Wind Direction, WD)、相对湿度通过气象站(MetPak, Gill, UK)收集,采集频率1 h. 6类污染物数据(PM2.5、PM10、SO2、NO2、O3、CO)来自中国环境监测总站全国城市空气质量实时发布平台(http://106.37.208.233:20035/),选用距离采样点2.5 km的“宾水西道”国控站点.
-
为探究2次污染期BLH变化对天津市大气污染的影响,选取东经116.75°至118°,北纬38.5°至39.5°区域进行研究,包含天津绝大部分地区和渤海小部分海域. 研究区域包含30个网格(1个网格对应1个高度值),分辨率为0.25° × 0.25°(约27 km × 27 km),30个网格(高度值)拼接在一起为每小时BLH. BLH采集周期与PM2.5采样周期对应,采集频率1 h(BJT = UTC + 8)[29],数据来自“The Climate Data Store” (https://cds.climate.copernicus.eu/cdsapp#!/home) . 使用时,将污染期内每个网格高度值进行均值化,得到30个均值,进一步拼接,即为该污染时段的BLH;研究BLH变化趋势则将每日BLH进行平均,最终得到一个数值.
-
通过MeteoInfo Map软件计算了污染期间每小时距地面500 m高度的48 h后向轨迹,模式采用的气象场为美国国家环境预报中心(NECP)再分析资料[30].
浓度权重轨迹(CWT)分析法是指网格化识别源区的分析方法[31],通过计算源区网格ij的平均权重浓度cij分析其对目标网格污染贡献,相较于PSCF能更好反应网格污染程度[32],如公式(1).
式中,cij是网格(i,j)的平均污染权重,k是气团轨迹,M为轨迹数量,ck为轨迹k经过网格ij时对应的要素值,τijk是轨迹k在网格中停留时间.
在此之上,引入经验权重函数W(nij)对结果进行修正,即对其进行区间化赋权与降低误差处理[33].
进而对CWT进行加权计算得到公式(3):
-
如图1所示,2018年SFH的PM2.5平均浓度为(98.32 ± 15.21)μg·m−3,气态前体物SO2、NO2平均浓度分别为(30.04 ± 10.53)μg·m−3、(43.82 ± 10.17)μg·m−3. 2019年SFH的PM2.5平均浓度为(49.97 ± 54.39)μg·m−3,相比2018年SFH降低了49.2%,且SO2、NO2平均浓度也分别减少57.8%、49.9%. 上述变化,应该是受到2017年以来推出的“代煤工程”以及《天津市打赢蓝天保卫战三年作战计划(2018—2020年)》等大气减排措施的影响. 而2020年SFH在减排措施、疫情效应等叠加影响下,SO2浓度((14.91 ± 4.18)μg·m−3)和NO2浓度((37.4 ± 9.23)μg·m−3)相比2018年同期有所降低,但相比2019年SFH分别提升了17.7%、70.2%,且PM2.5浓度((137.7 ± 98.07)μg·m−3)达到3年最高. 虽然2019年SFH的除夕当天(2019年2月4日)也发生了严重的大气污染,推断是当天较差的扩散条件(WS为1.14 m·s−1)以及燃放烟花爆竹(Cl−、K+浓度分别为10.41 μg·m−3、9.58 μg·m−3)所导致[34-35]. 此外,该污染期较短(仅为1 d),故后续不进行单独讨论.
污染期Ⅱ的PM2.5浓度((206.5 ± 57.34 )μg·m−3)升高至污染期I的2.1倍,O3浓度((61.53 ± 12.61)μg·m−3)升高了17.03 μg·m−3. 而SO2浓度((14.89 ± 2.81)μg·m−3)降低至污染期Ⅰ的49.6%,NO2浓度((43.99 ± 5.1)μg·m−3)差异不显著. 在气象条件方面,污染期Ⅱ的RH相比于污染期Ⅰ升高至71.2%,温度((0.47 ± 1.49)℃)变化不明显,而风速((1.27 ± 0.23)m·s−1)降低了50.8%. 前人的研究表明,气溶胶浓度的增加与气象条件的改变息息相关[36],即2018年、2020年SFH期间发生的污染事件可能与气象条件的改变有较大关联.
-
如表1所示,2019年SNA浓度相比2018年降幅达49.9%,而2020年相比2019年增长196.9%,这与3年春节假期PM2.5浓度变化规律相符,并且污染期Ⅰ和污染期Ⅱ中的SNA浓度变化趋势也与PM2.5浓度在2次污染期间的变化趋势一致. 在3年春节假期中,SNA在WSIIs中的占比均超过73.0%,在污染期Ⅰ和Ⅱ中SNA在WSIIs占比更是分别高达77%和81%. 同时,随着PM2.5浓度的升高,SNA在WSIIs中的占比也越大,这表明SNA是天津市PM2.5中最主要的水溶性离子组分.
由图2可知,在3年春节假期与2次污染期PM2.5的WSIIs中,占比最高的组分为NO3−浓度. 这可能受“代煤工程”等减排措施的影响,冬季燃煤量逐年降低,使得SO2与SO42−排放减少. 同时,天津汽车保有量的增多使得NOx的排放增加,导致NO3−的生成增加[37-38].
-
由于H2SO4饱和蒸气压较低,NH3一般先与其反应生成稳定的硫酸盐,后与HNO3反应生成硝酸盐[39],因此前人通常根据铵根与硫酸根的物质的量比([NH4+]/[SO42−])识别富铵环境(ammonium rich, AR)和贫铵环境(ammonium poor, AP)[40]. 在前人的研究中,一般将[NH4+]/[SO42−] = 1.5设置为判定AR与AP的阈值[41],即当[NH4+]/[SO42−] ≥ 1.5时,为富铵环境,利于NO3−的产生. 而在本研究中,根据[NO3−]/[SO42−]与[NH4+]/[SO42−](物质的量比),得到线性回归方程[42](图3):将3年春节假期、2次污染期[NH4+]/[SO42−] = 2.3设置为判定AR与AP的阈值,即当[NH4+]/[SO42−] ≥ 2.3时,富铵条件普遍存在,NH4+与H2SO4完全中和,剩余NH4+形成NH4NO3浓度显著增加.
由图3(a)、(b)可知,3年春节期间的[NH4+]/[SO42−]比值范围在3.91—9.80,均值为5.77;在2段污染期中,[NH4+]/[SO42−]比值范围在4.02—6.23,均值为4.89,以上[NH4+]/[SO42−]比值全部大于2.3. 即3年春节假期中与2段污染期均处于AR状态. 进一步对比图3(c)、(d)以说明PM2.5在不同研究阶段主要无机离子组分特征,即在3年春节假期及2段污染期的AR状态下,SNA均主要以(NH4)2SO4和NH4NO3形式存在. 而图3(d)所示函数斜率(0.94)偏低,表明在污染事件中,除(NH4)2SO4、NH4NO3,还可能存在NH4Cl等无机盐,并且NH4NO3质量浓度明显高于(NH4)2SO4、NH4Cl等(表1). 同时,污染期Ⅱ的NH4NO3质量浓度远高于污染期Ⅰ(表1). 以上说明NH4NO3是3年春节假期及2段污染期最主要的无机盐[43-44],并且污染越严重,NH4NO3浓度越高,而控制硝酸盐的快速增长,对于天津市控制PM2.5浓度升高和提升空气质量具有重要意义.
-
CO主要来自燃烧、工业、汽车等污染源,可以较好地指示一次排放剧烈程度[45-46]. 前人常用PM2.5/CO浓度比值评价一次燃烧排放对PM2.5的贡献[47],PM2.5/CO比值越高,一次燃烧对PM2.5贡献越小,即二次污染物对PM2.5的贡献越大[48]. 如表2、图1所示,在3年春节假期中,PM2.5/CO比值与CO、PM2.5浓度变化趋势相同,说明污染越重,二次转化比一次排放对PM2.5增长的贡献率上升的越快. 尤其是污染期Ⅱ相比于污染期Ⅰ,CO浓度所表征的一次排放强度更大,但PM2.5/CO比值也更高,表明污染期Ⅱ中虽然一次排放均有所增强,但二次转化可能对PM2.5的影响更大.
气态前体物SO2主要与·OH发生均相反应或在颗粒物表面发生非均相反应生成SO42-[11, 39],NO2则通过均相和非均相反应生成NO3-[49-50]. 一般地,硫氧化率(sulfur oxidation ratio, SOR)、氮氧化率(nitrogen oxidation ratio, NOR)用以分别表征气态前体物SO2和NO2的大气二次转化程度[51]:
式中,c(SO42−)、c(SO2)、c(NO3−)、c(NO2)分别表示摩尔浓度,通常当SOR、NOR > 0.1时,说明SO42−和NO3−的前体物SO2、NO2在大气中发生明显的二次转化过程[52],并且SOR、NOR越高表示气态污染物氧化程度越高,二次转化程度也越高[53]. 如表2、图1所示,3年春节假期和2次污染期SOR、NOR值均大于0.1,尤其在污染期Ⅱ中SOR、NOR高达0.49、0.34,然而污染期Ⅱ比污染期Ⅰ的SO2浓度降低50.4%,NO2浓度变化不明显. 上述变化说明在大气减排与新冠疫情影响下天津市SO2排放减少,并使得过量的NH4+更多的与NO3−结合生成硝酸盐并导致更高的NOR值. 因此,在有效控制大气中SO2排放的同时,对硝酸盐的气态前体物NOx实施更严格更精准的排放控制,可能有助于进一步降低天津春节期间PM2.5浓度.
根据前文讨论可得,污染期Ⅱ比污染期Ⅰ的SO2浓度低50.4%、NO2浓度持平,而高PM2.5/CO(0.11 ± 0.02)比值以及高SOR(0.49 ± 0.08)、NOR(0.34 ± 0.06)值表明二次转化对PM2.5浓度的贡献在污染期Ⅱ中相比于污染期Ⅰ要高得多.
诸多研究表明,除二次转化外,污染期PM2.5的生成很大程度上也与气象参数的变化相关[36]. 就平均温度而言,2个污染期相近,说明温度可能不是造成两个污染期PM2.5污染浓度差异较大的主要因素. 而污染期Ⅱ的RH(71.2%)为污染期Ⅰ的1.44倍,并且高湿条件(RH > 60%)是诱发大气污染的关键因子,会促进气溶胶含水量(ALWC)升高,进而加快SO2的液相反应和N2O5的水解反应[36],导致SO42−、NO3−浓度大幅升高. 污染期Ⅱ的O3浓度(61.53 μg·m−3)为污染期Ⅰ的1.38倍,有研究表明较高的O3浓度会增强大气氧化能力,进而提高气态前体物的二次转化速率[54].
污染期Ⅱ的WS(1.27 m·s−1)相对污染期Ⅰ较低,说明该污染阶段的大气扩散条件持续较差,易于污染物的累积与高强度二次转化的发生(图1). 如图4所示,污染期Ⅱ的BLH(242.51 m)相比污染期Ⅰ降低了34.2%,边界层垂直结构趋于稳定[42, 55]. 较低且稳定的大气边界层有效削弱了大气垂直扩散能力,抑制了水汽与各类大气污染物向大气上层扩散,进而使得水汽与各类大气污染物扩散困难并产生堆积,同时利于混合层中气溶胶的吸湿增长,导致SOR、NOR升高,尤其是NO3−对PM2.5的贡献增加(图1).
在以上较长时间的低风速、高相对湿度、低边界层高度等不利气象条件的共同作用下,形成静稳、强逆温天气[38],使得大气环境容量大幅减少,进而大幅削弱大气环境承载污染物的能力,并且使得二次无机气溶胶生成速率大幅提升,从而导致近地面发生严重污染. 通过对比图4可进一步印证,大气静稳、强逆温条件下污染期Ⅱ的CWT高值区基本集中在天津及周边区域,说明区域传输对于污染期Ⅱ的污染贡献可能较少. 而污染期Ⅰ的CWT高值区主要分布在天津周边及西北部的长距离传输路径上,表明污染期Ⅰ的中长距离区域传输对PM2.5浓度的影响可能远高于污染期Ⅱ.
因此,污染期Ⅱ“异常现象”中,虽然春节期间“假日效应”、“环保措施”与“疫情影响”可能对天津市大气污染物一次排放减少有所贡献[38],但在不利气象条件作用下大幅降低的大气环境容量,以及增强的二次转化过程、天津及周边区域的污染物传输,共同削弱了减排效果,并导致大气污染情况严重恶化. 而污染期Ⅰ除二次转化作用外,远距离区域传输也是天津市大气污染重要的影响因素.
-
(1)3年春节假期及2次污染期均处于富铵环境([NH4+]/[SO42−] ≥ 2.3),SNA是天津PM2.5中最主要的水溶性离子组分. SNA主要以(NH4)2SO4、NH4NO3、NH4Cl形式存在,其中NH4NO3是最主要的无机盐,并且污染期Ⅱ的NH4NO3浓度远高于污染期Ⅰ,说明NH4NO3的大量生成可能是促进灰霾发生的主要因素.
(2)在2018—2020年春节假期,尤其是2次污染期的PM2.5/CO比值、SOR、NOR均说明前体污染物的二次转化过程对天津市PM2.5贡献巨大. 对于污染期Ⅰ,较强的区域传输和二次转化是大气污染的主要原因. 对于污染期Ⅱ,“假日效应”与“新冠疫情”可能产生了良好减排效果,但在较低的BLH、WS和高RH等不利气象因素作用下形成静稳、强逆温天气,导致大气环境容量减少,并使得SO42−、NO3−的二次生成速率大幅增加,同时在天津及周边区域污染物传输的共同作用下,使得大气污染情况严重恶化.
天津市2018—2020年春节PM2.5中水溶性无机离子特征及重污染过程分析
Characteristics of water-soluble inorganic ions in PM2.5 and study of heavy pollution period during 2018—2020 Spring Festival in Tianjin
-
摘要: 为阐明大气污染重点整治和新冠疫情影响下我国华北地区城市春节期间重污染过程PM2.5中水溶性无机离子变化特征及其影响因素,本研究结合气态前体物浓度和气象要素,对天津市2018—2020年连续3年春节假期的2次重污染过程PM2.5中主要水溶性无机离子(WSIIs)浓度进行对比分析. 结果表明,2018年和2020年春节假期PM2.5平均浓度(98.32 μg·m−3和137.7 μg·m−3)显著高于2019年(49.97 μg·m−3). PM2.5平均浓度在污染期Ⅱ(2020年为206.5 μg·m−3)是污染期Ⅰ(2018年98.32 μg·m−3)的2.1倍;2次污染事件中NO2浓度变化不大,而SO2浓度在污染期Ⅱ(14.89 μg·m−3)是污染期Ⅰ(30.04 μg·m−3)的49.6%. SNA在WSIIs中占比超过77%,主要以NH4NO3、(NH4)2SO4形式存在,其中NH4NO3为最主要的无机盐,且污染期Ⅱ的NH4NO3浓度远高于污染期Ⅰ. 此外,污染期Ⅱ的PM2.5/CO、SOR、NOR均明显升高,表明更有效的SO42−和NO3−形成过程是导致污染期Ⅱ中PM2.5浓度偏高的主要原因之一. 不利的边界层高度、相对湿度、风速等气象要素形成静稳、强逆温天气,导致大气环境容量减小,并使得污染期Ⅱ的二次无机气溶胶生成效率大幅提高,进而削弱了疫情效应与减排措施的影响. 而污染期Ⅰ除了二次转化外,PM2.5浓度可能更多受到区域传输等影响.Abstract: To elucidate the variation characteristics and influencing factors of water-soluble inorganic ions (WSIIs) in PM2.5 during the heavy pollution period of the Spring Festival under the influence of air pollution control and COVID-19 epidemic, the concentrations of WSIIs in PM2.5 during two heavy pollution periods occurred in the three consecutive Spring Festival holidays in Tianjin from 2018 to 2020 were comparably investigated. The results showed that the average PM2.5 concentration in 2018 (98.32 μg·m−3) and in 2020 (137.7 μg·m−3) was significantly higher than that in 2019 (49.97 μg·m−3). The average PM2.5 concentration in the period Ⅱ of heavy pollution episode in 2020 (206.5 μg·m−3) was 2.1 times higher than that in the period Ⅰ in 2018 (98.32 μg·m−3). The concentration of NO2 in the two pollution periods changed little, while the average concentration of SO2 in the period Ⅱ (14.89 μg·m−3) was 49.6% of that in the period Ⅰ (30.04 μg·m−3). The SNA accounted for more than 77% of the WSIIs, and were mainly in the forms of NH4NO3 and (NH4)2SO4 among which NH4NO3 was the most important inorganic salt and it’s concentration in the period Ⅱ was much higher than that in the period Ⅰ. In addition, PM2.5/CO, SOR and NOR in the period Ⅱ significantly increased, indicating that the more effective formation of SO42− and NO3− was one of the main reasons for the high concentration of PM2.5 in the period Ⅱ. Adverse meteorological conditions such as low boundary layer height, high relative humidity and low wind speed resulted in stable and strong inversion weather, which led to the reduction of atmospheric environmental capacity and greatly improved the generation efficiency of secondary inorganic aerosols during the period Ⅱ, thus offsetting the impact of epidemic effect and emission reduction measures. For the period Ⅰ, in addition to secondary transformation, PM2.5 concentrations may be more affected by regional transmission.
-
Key words:
- Spring Festival /
- water-soluble inorganic ions /
- SNA /
- formation mechanism /
- Tianjin.
-

-
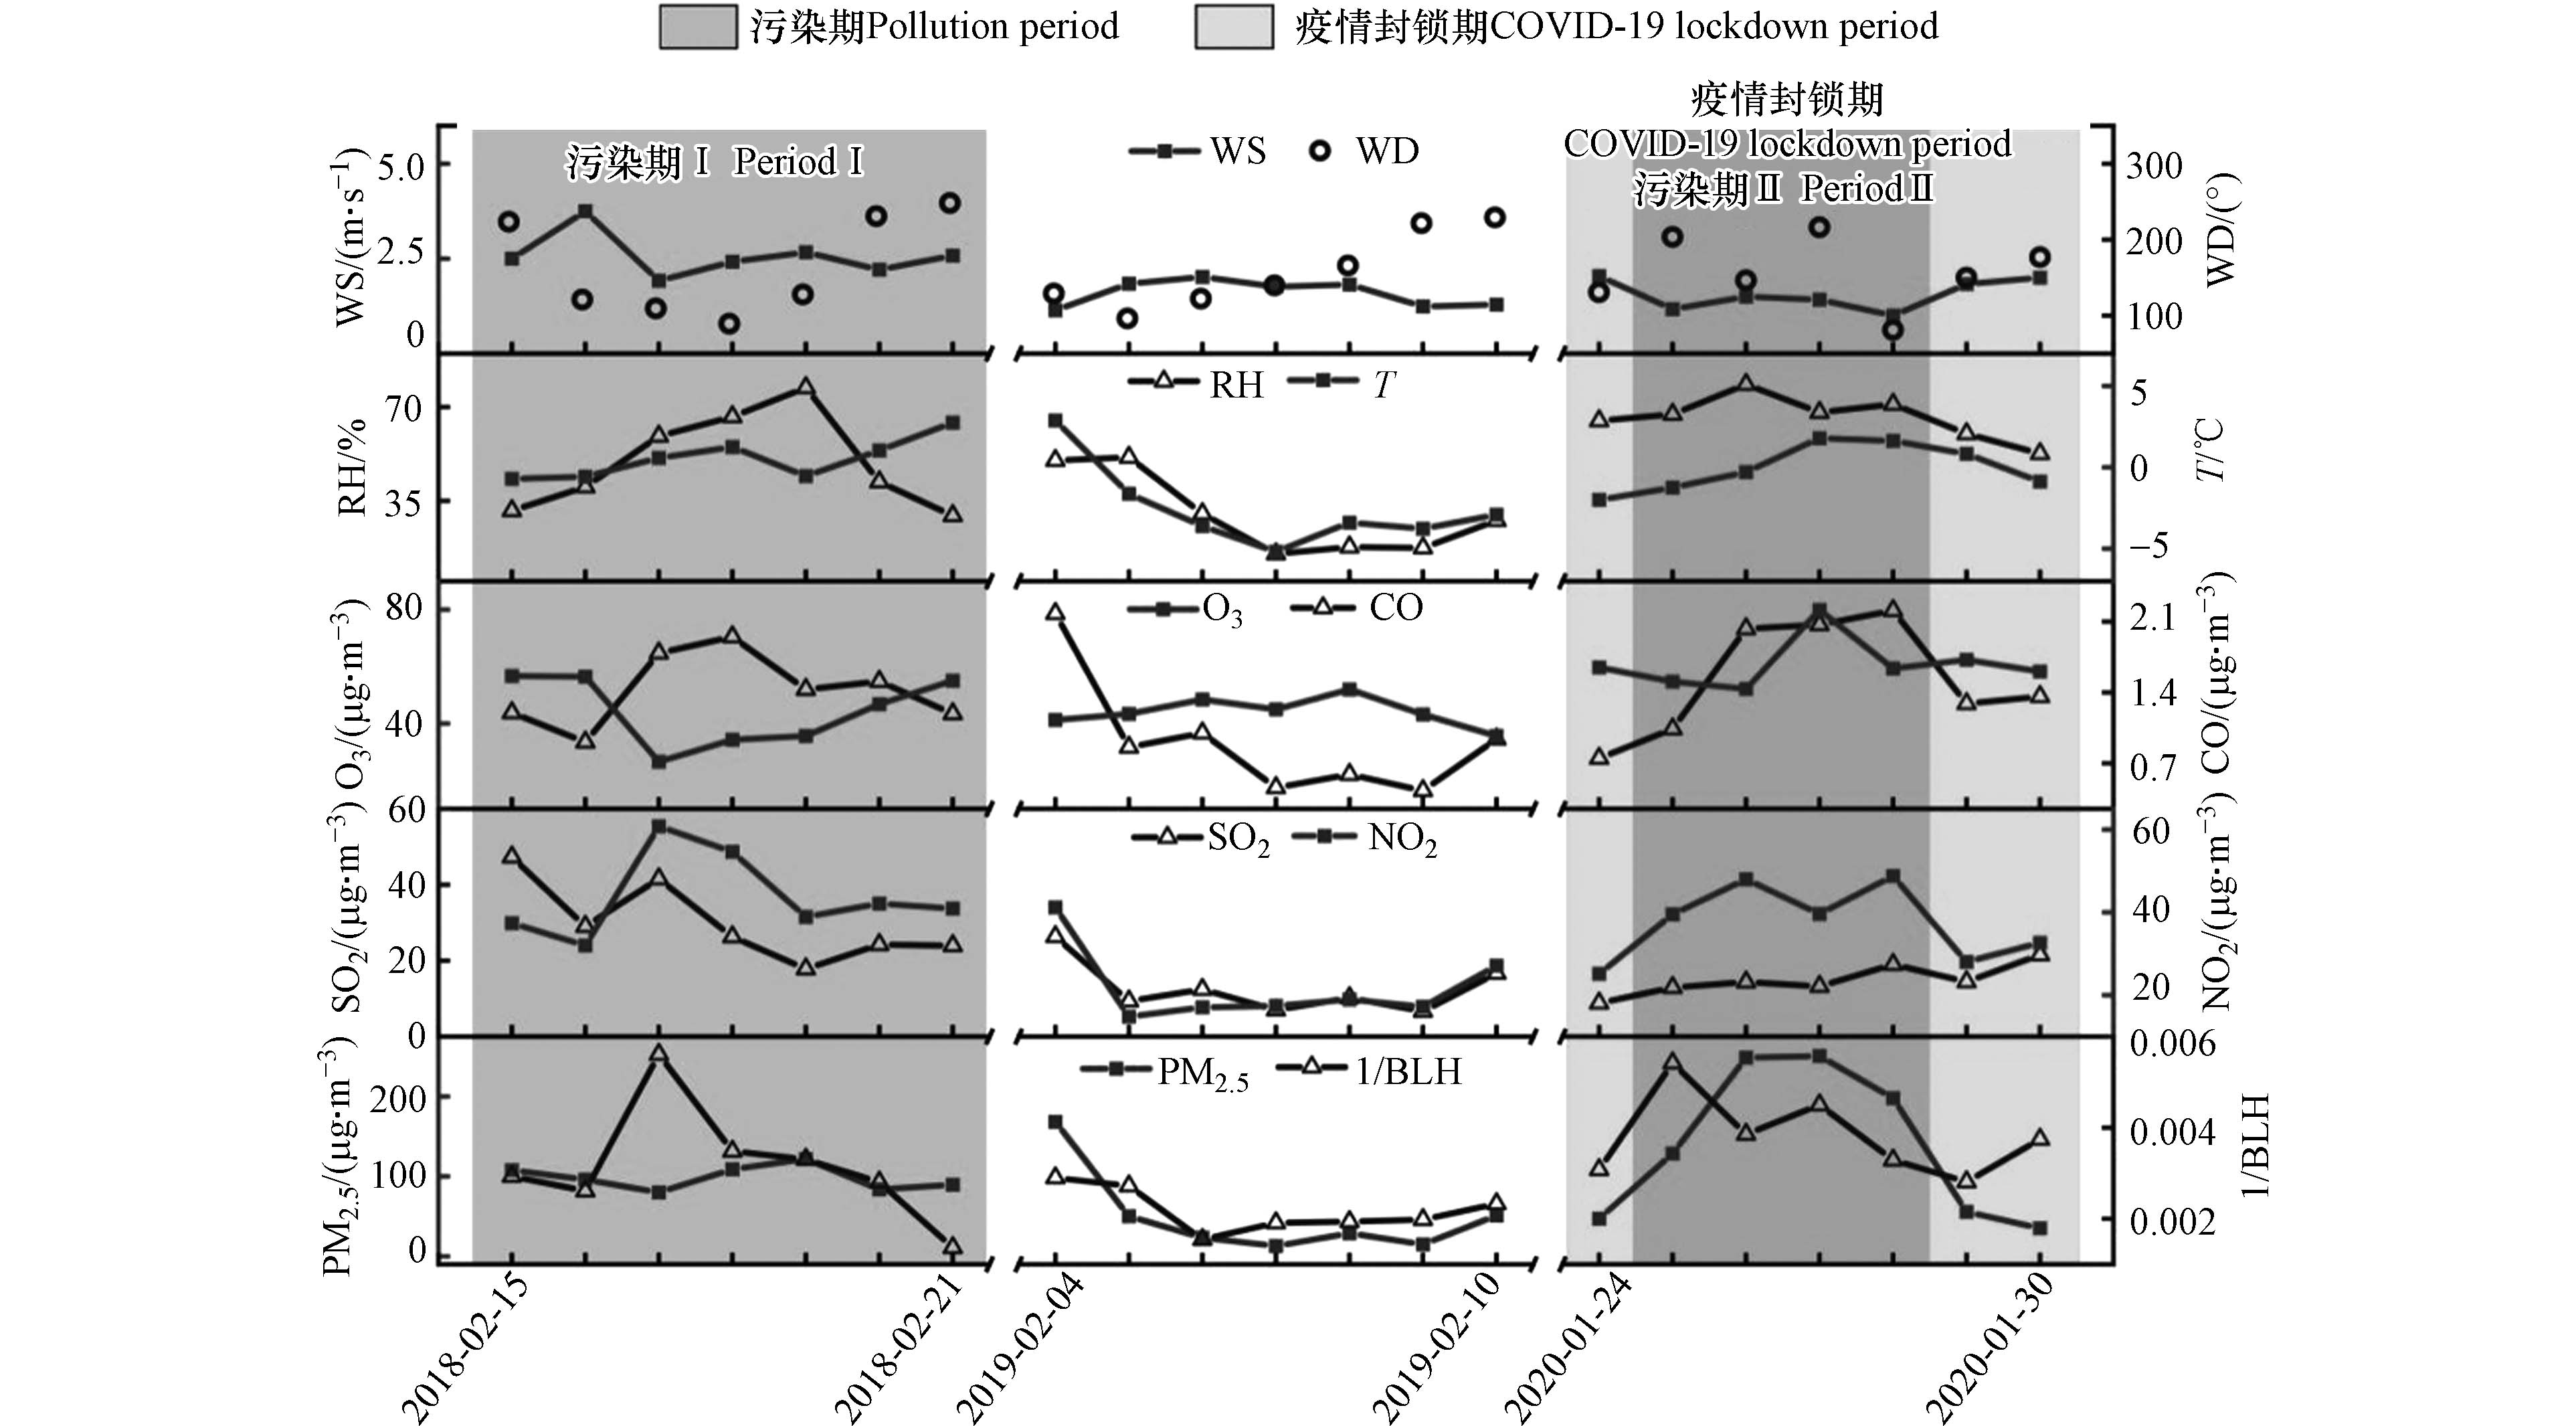
图 1 2018—2020年春节假期期间主要气象参数、大气污染物浓度及大气边界层高度的时间序列
Figure 1. Time series of major meteorological parameters, air pollutant concentrations and BLH during the 2018—2020 Spring Festival Holiday
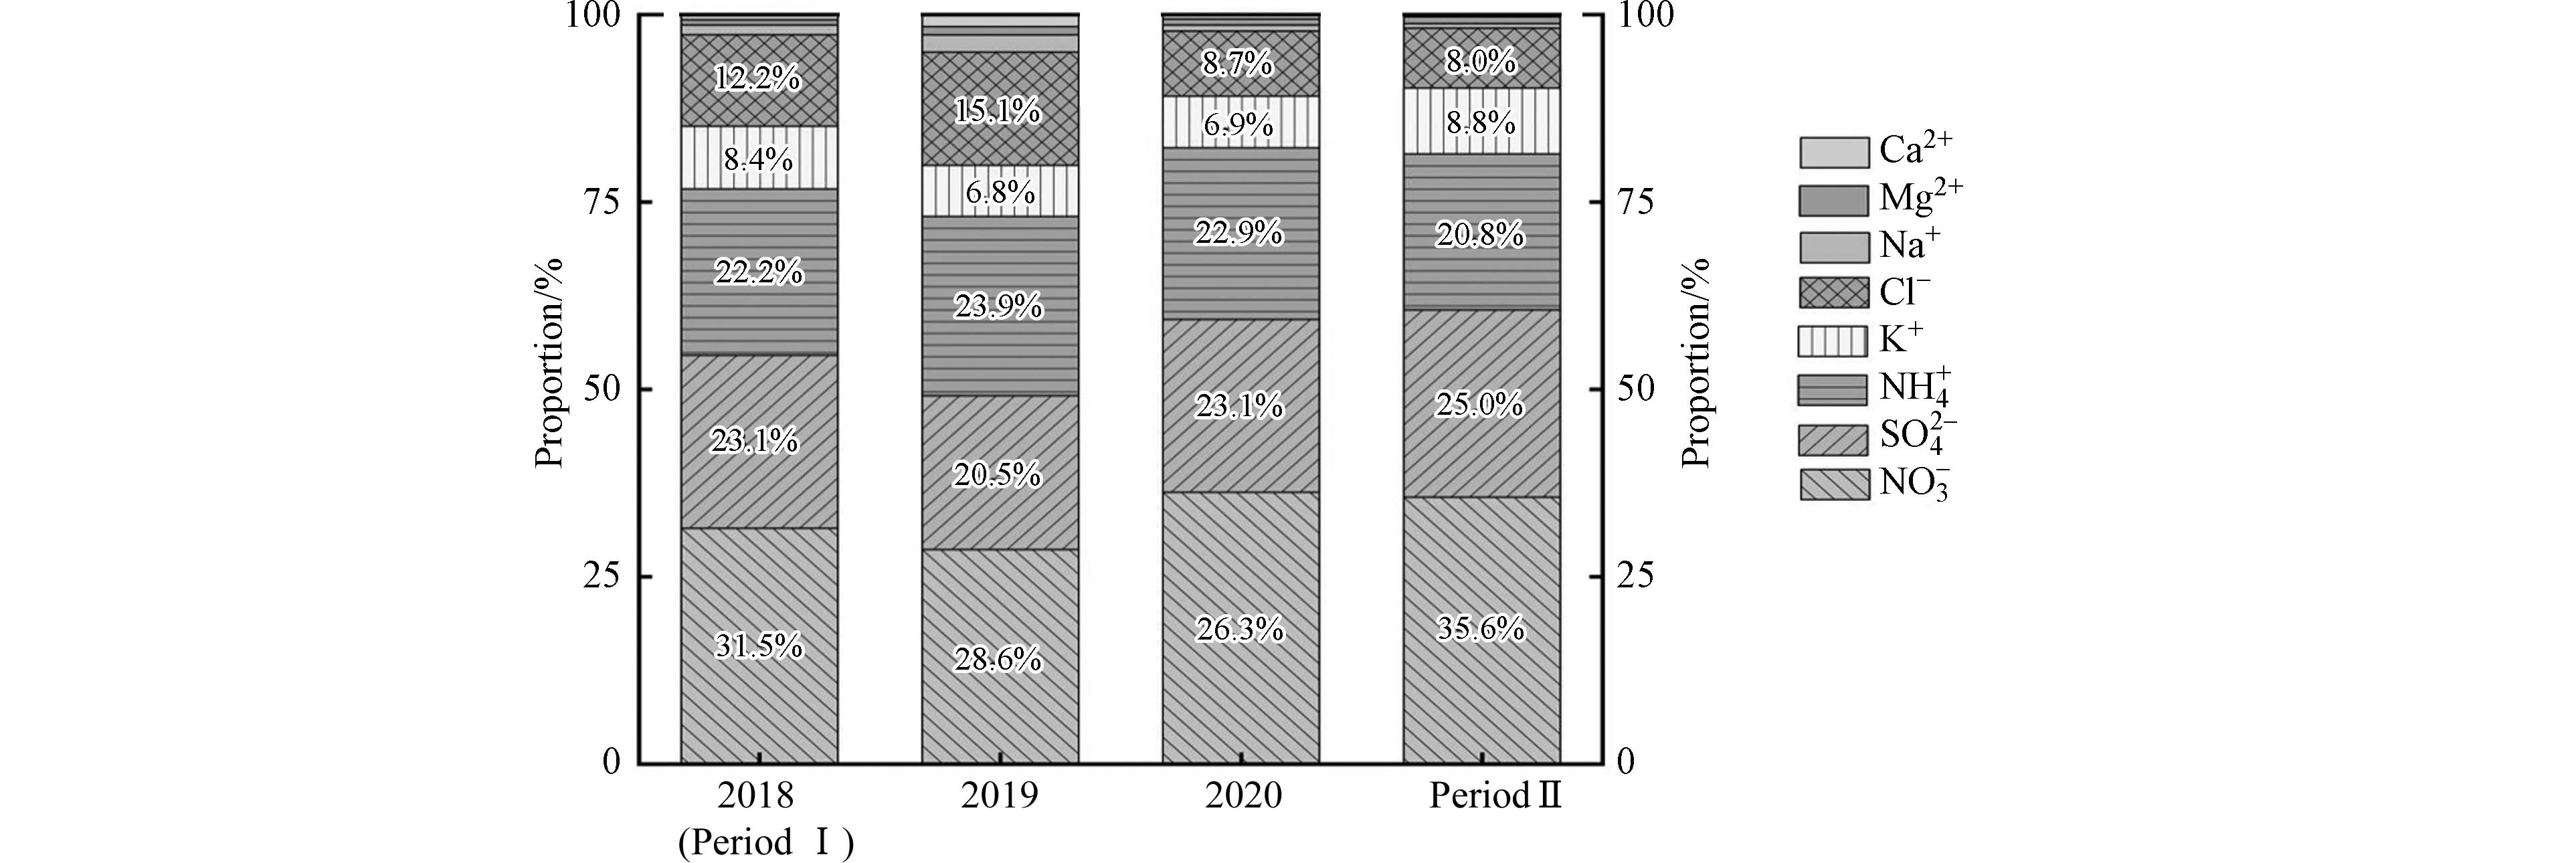
图 2 2018—2020年春节假期及2次污染过程水溶性离子(WSIIs)中各组分浓度占比
Figure 2. Concentrations of each component in WSIIs in Spring Festival holiday and 2 pollution periods during from 2018 to 2020
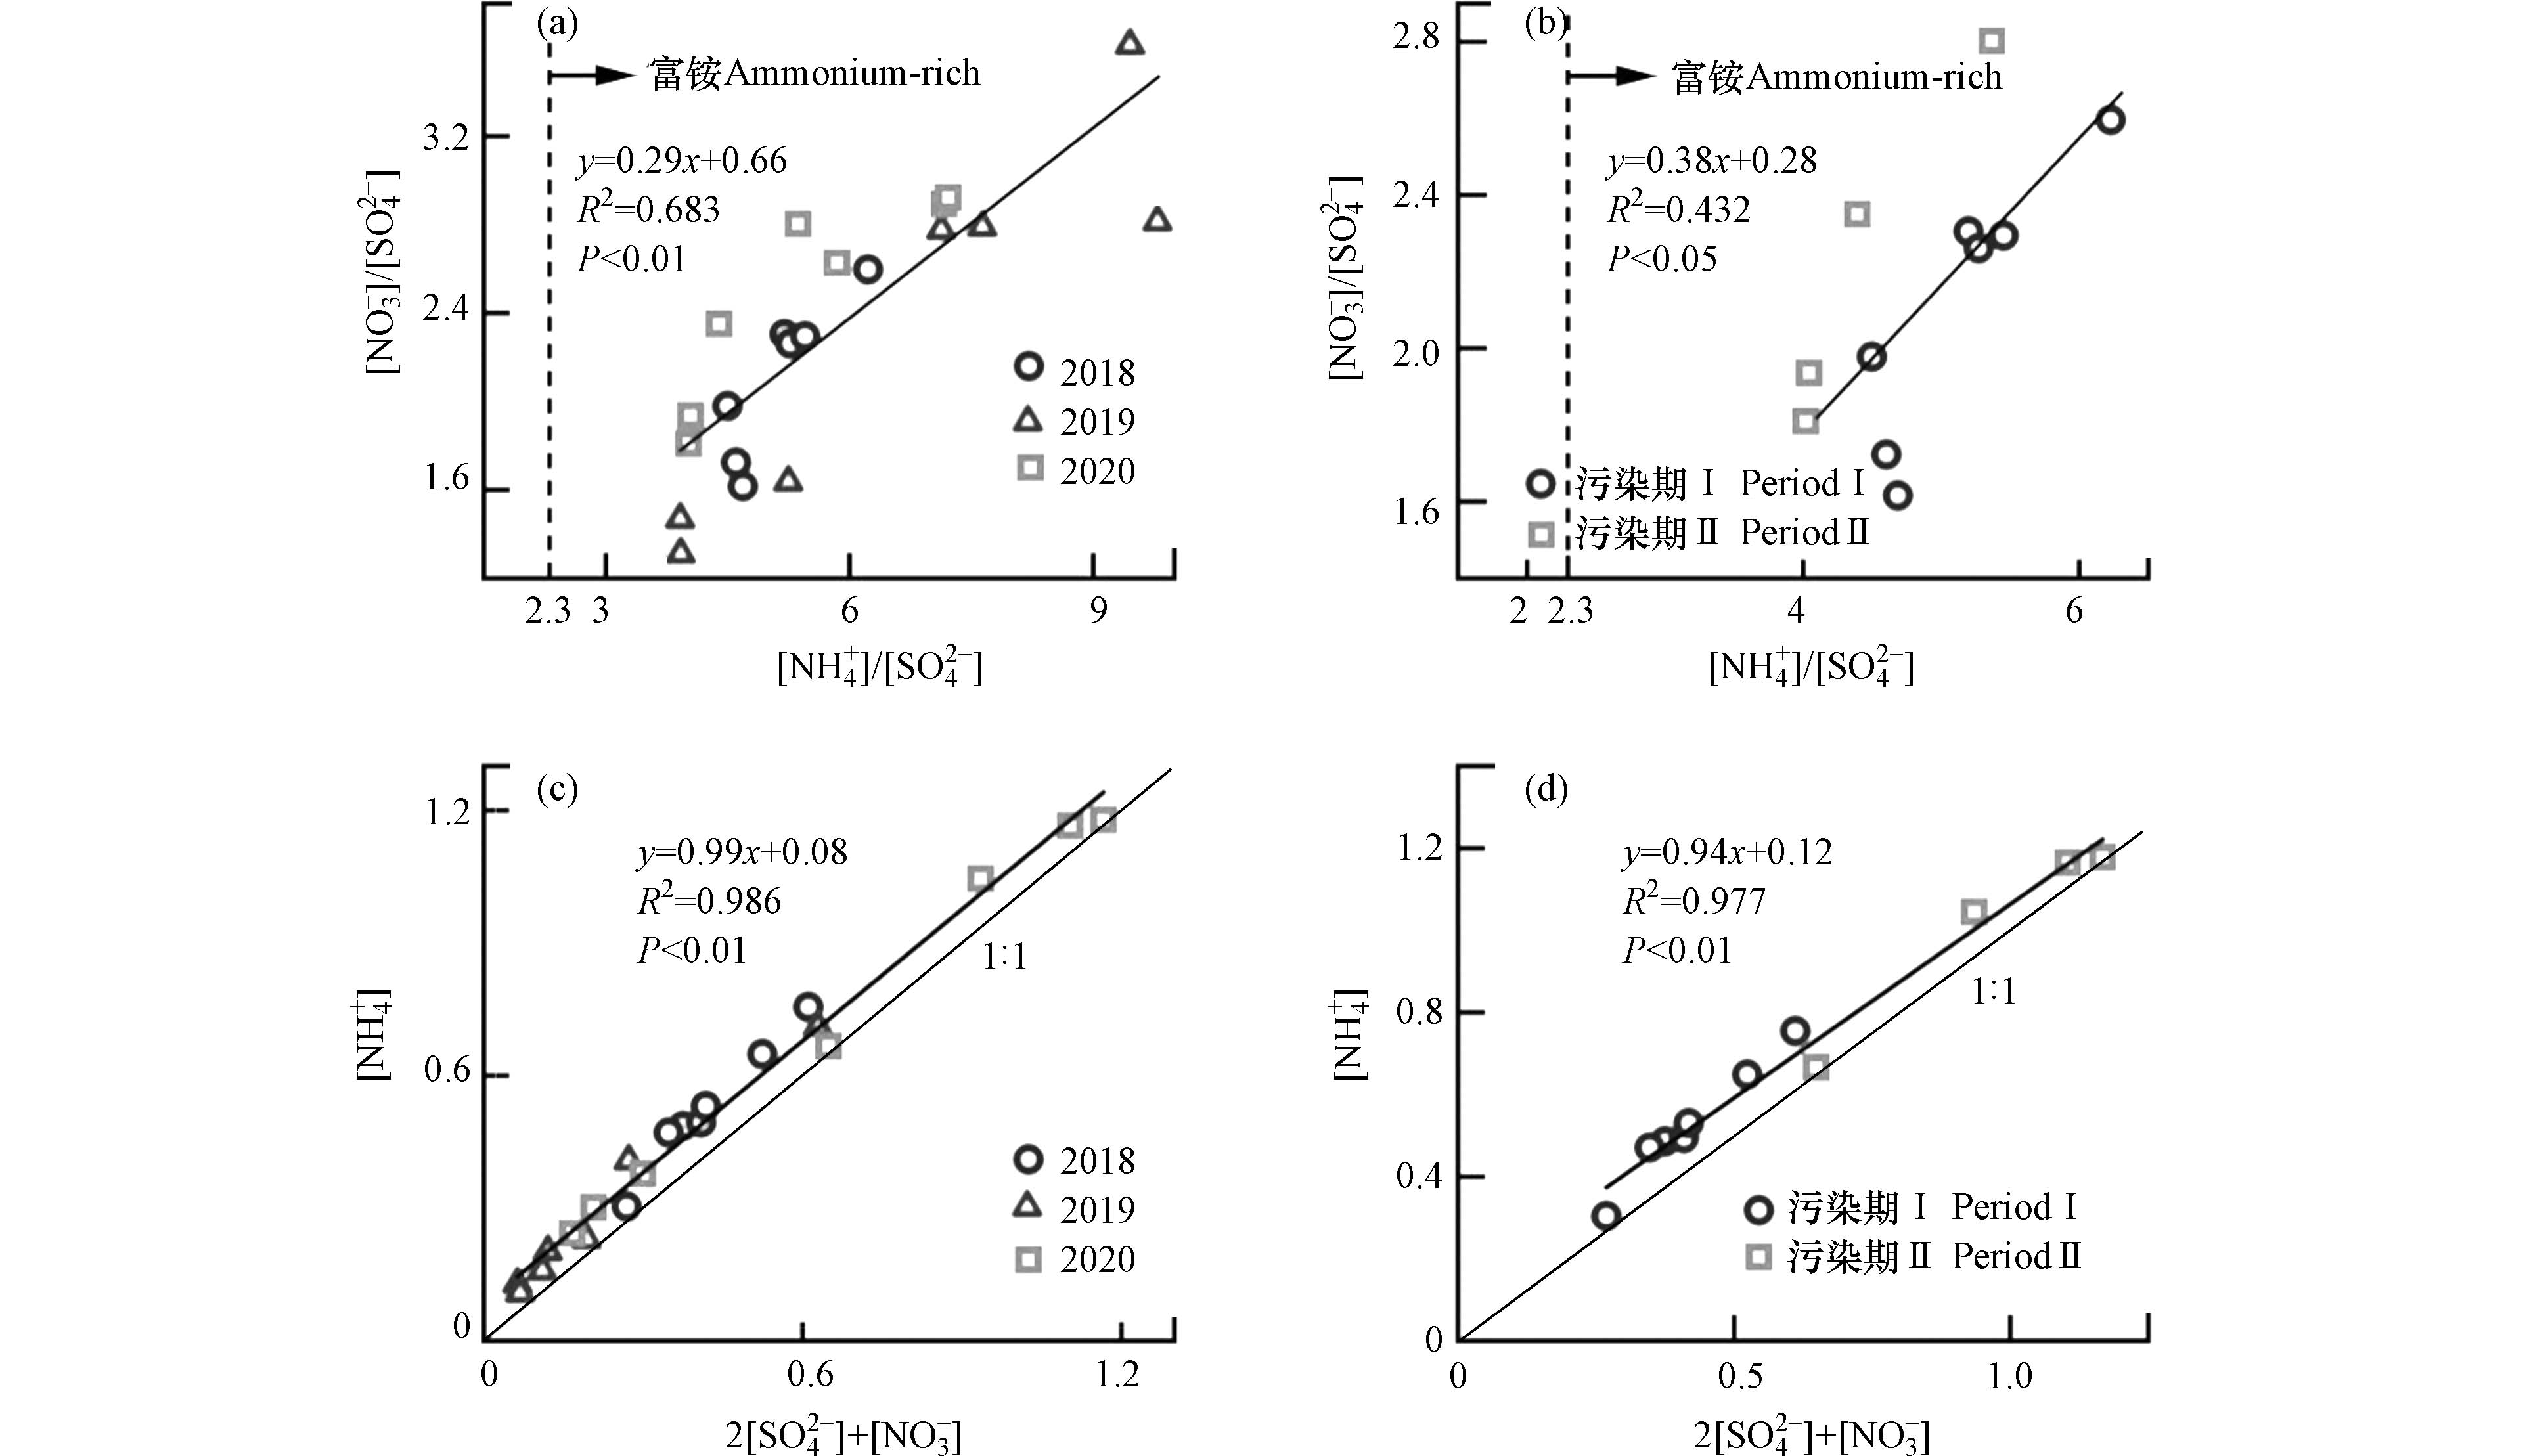
图 3 (a)2018—2020年春节假期NH4+/SO42−物质的量比与NO3−/SO42−物质的量比的函数;(b)两段污染期NH4+/SO42−物质的量比与NO3−/SO42−物质的量比的函数;(c)2018—2020年春节假期NH4+摩尔浓度与2倍SO42− + NO3−摩尔浓度的函数;(d)两段污染期NH4+摩尔浓度与2倍SO42−+NO3−摩尔浓度的函数;
Figure 3. (a) Function of [NH4+/SO42−] and [NO3−/SO42−] in 2018-2020 Spring Festival Holidays; (b) Function of [NH4+/SO42−] and [NO3−/SO42−] in 2 pollution periods; (c) The function of [NH4+] and 2[SO42−+NO3−] in 2018—2020 Spring Festival Holidays; (d) The function of [NH4+] and 2[SO42−+NO3−] in 2 pollution periods
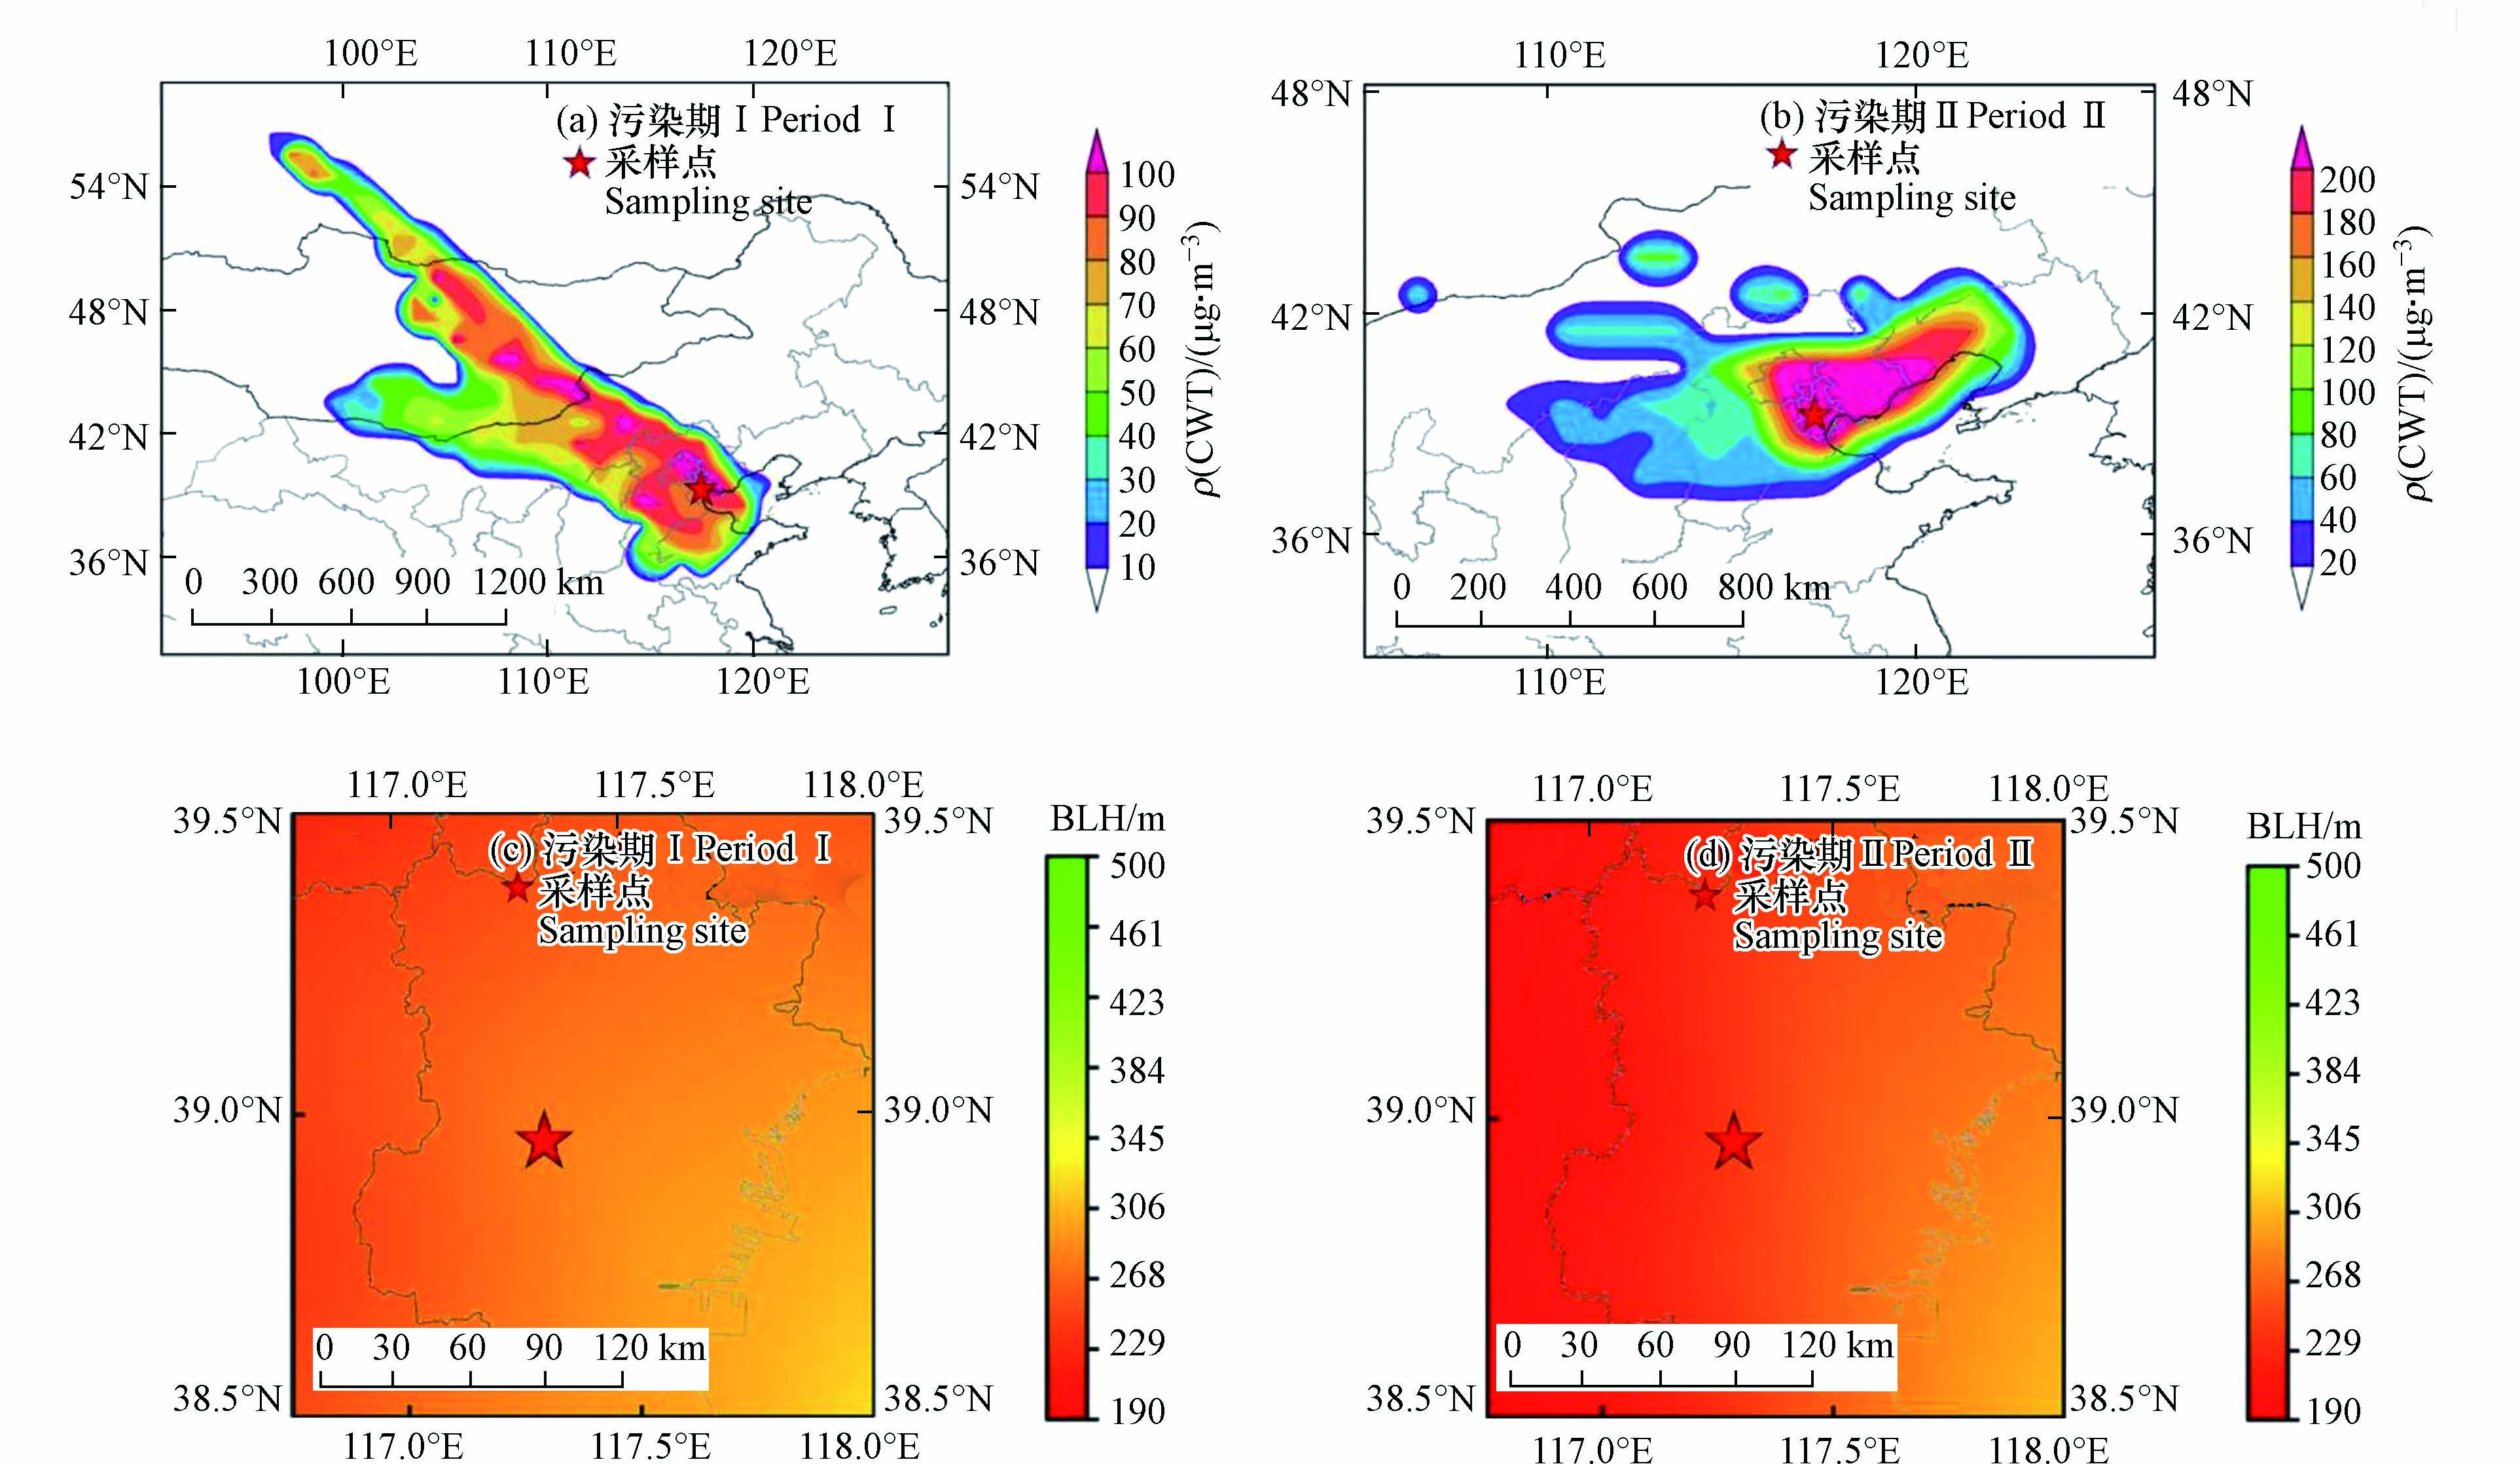
图 4 2次污染过程气团传输聚类分析(a—b)、大气边界层高度模拟(c—d)
Figure 4. Cluster analysis of air mass transport (a—b), atmospheric boundary layer height simulation (c—d) for 2 pollution periods
表 1 2018—2020年春节假期及2次污染期SO42−、NO3−、NH4+浓度及其相关参数(平均值±标准差)
Table 1. Concentration of SO42−, NO3−, NH4+ and their related parameters,(mean ± standard deviation) during Spring Festival holiday and 2 pollution periods from 2018 to 2020
项目
Parameter2018 (污染期 Ⅰ)
Pollution Period Ⅰ2019 2020 污染期 Ⅱ
Pollution Period ⅡSO42−/(μg·m−3) 9.96 ± 3.09 5.15 ± 5.70 14.51 ± 10.23 22.03 ± 5.69 NO3−/(μg·m−3) 13.29 ± 3.39 6.24 ± 5.21 21.34 ± 13.76 31.30 ± 8.18 NH4+/(μg·m−3) 9.49 ± 2.57 5.00 ± 3.87 12.80 ± 7.48 18.25 ± 4.31 SNA/(μg·m−3) 32.74 ± 8.74 16.39 ± 14.59 48.66 ± 31.17 71.57 ± 17.11 WSIIs/(μg·m−3) 43.40 ± 11.29 22.86 ± 21.60 59.07 ± 36.62 87.18 ± 14.40 SNA/WSIIs 0.77 ± 0.14 0.73 ± 0.04 0.82 ± 0.071 0.81±0.09  下载: 导出CSV
表 2 2018—2020年春节假期及2次污染期CO浓度、以及PM2.5/CO、SOR、NOR(平均值±标准差)
Table 2. CO concentration, PM2.5/CO, SOR and NOR (mean ± standard deviation) during Spring Festival holiday and 2 pollution periods from 2018 to 2020
项目
Parameter2018 (污染期 Ⅰ)
Pollution Period Ⅰ2019 2020 污染期 Ⅱ
Pollution Period ⅡCO/(μg·m−3) 1.43 ± 0.36 0.92 ± 0.60 1.53 ± 0.57 1.84 ± 0.54 PM2.5/CO 0.07 ± 0.02 0.05 ± 0.02 0.08 ± 0.04 0.11 ± 0.02 SOR 0.19 ± 0.09 0.18 ± 0.08 0.36 ± 0.18 0.49 ± 0.08 NOR 0.19 ± 0.04 0.16 ± 0.06 0.27 ± 0.10 0.34 ± 0.06
下载: 导出CSV
-
[1] PANG N N, GAO J, CHE F, et al. Cause of PM2.5 pollution during the 2016-2017 heating season in Beijing, Tianjin, and Langfang, China [J]. Journal of Environmental Sciences, 2020, 95: 201-209. doi: 10.1016/j.jes.2020.03.024 [2] ZHANG Y L, ZHU B, GAO J H, et al. The source apportionment of primary PM2.5 in an aerosol pollution event over Beijing-Tianjin-Hebei region using WRF-chem, China [J]. Aerosol and Air Quality Research, 2017, 17(12): 2966-2980. doi: 10.4209/aaqr.2016.10.0442 [3] ZHANG Q, QUAN J N, TIE X X, et al. Effects of meteorology and secondary particle formation on visibility during heavy haze events in Beijing, China [J]. Science of the Total Environment, 2015, 502: 578-584. doi: 10.1016/j.scitotenv.2014.09.079 [4] TAO J, GAO J, ZHANG L, et al. PM2.5 pollution in a megacity of southwest China: Source apportionment and implication [J]. Atmospheric Chemistry and Physics, 2014, 14(16): 8679-8699. doi: 10.5194/acp-14-8679-2014 [5] HUANG X J, ZHANG J K, LUO B, et al. Water-soluble ions in PM2.5 during spring haze and dust periods in Chengdu, China: Variations, nitrate formation and potential source areas [J]. Environmental Pollution, 2018, 243: 1740-1749. doi: 10.1016/j.envpol.2018.09.126 [6] LIU J, WU D, FAN S J, et al. A one-year, on-line, multi-site observational study on water-soluble inorganic ions in PM2.5 over the Pearl River Delta region, China [J]. Science of the Total Environment, 2017, 601/602: 1720-1732. doi: 10.1016/j.scitotenv.2017.06.039 [7] 于谨铖, 李建熹, 苏枞枞, 等. 沈阳市大气PM2.5中水溶性离子的季节变化特征 [J]. 环境化学, 2021, 40(12): 3733-3742. doi: 10.7524/j.issn.0254-6108.2021042701 YU J C, LI J X, SU Z Z, et al. Seasonal variation of water soluble ions in PM2.5 in Shenyang [J]. Environmental Chemistry, 2021, 40(12): 3733-3742(in Chinese). doi: 10.7524/j.issn.0254-6108.2021042701
[8] WU P, HUANG X J, ZHANG J K, et al. Characteristics and formation mechanisms of autumn haze pollution in Chengdu based on high time-resolved water-soluble ion analysis [J]. Environmental Science and Pollution Research International, 2019, 26(3): 2649-2661. doi: 10.1007/s11356-018-3630-6 [9] 姚青, 刘子锐, 韩素芹, 等. 天津冬季一次重污染过程颗粒物中水溶性离子粒径分布特征 [J]. 环境科学, 2017, 38(12): 4958-4967. doi: 10.13227/j.hjkx.201702097 YAO Q, LIU Z R, HAN S Q, et al. Characteristics of the size distribution of water-soluble ions during a heavy pollution episode in the winter in Tianjin [J]. Environmental Science, 2017, 38(12): 4958-4967(in Chinese). doi: 10.13227/j.hjkx.201702097
[10] 邵玄逸, 王晓琦, 钟嶷盛, 等. 京津冀典型城市冬季人为源减排与气象条件对PM2.5污染影响 [J]. 环境科学, 2021, 42(9): 4095-4103. SHAO X Y, WANG X Q, ZHONG Y S, et al. Impacts of anthropogenic emission reduction and meteorological conditions on PM2.5 pollution in typical cities of Beijing-Tianjin-Hebei in winter [J]. Environmental Science, 2021, 42(9): 4095-4103(in Chinese).
[11] WANG T Y, HUANG X, WANG Z L, et al. Secondary aerosol formation and its linkage with synoptic conditions during winter haze pollution over Eastern China [J]. Science of the Total Environment, 2020, 730: 138888. doi: 10.1016/j.scitotenv.2020.138888 [12] WANG X Q, WEI W, CHENG S Y, et al. Characteristics of PM2.5 and SNA components and meteorological factors impact on air pollution through 2013-2017 in Beijing, China [J]. Atmospheric Pollution Research, 2019, 10(6): 1976-1984. doi: 10.1016/j.apr.2019.09.004 [13] 赵鹏, 解静芳, 王淑楠, 等. 太原市采暖季PM2.5中水溶性无机离子污染特征及来源解析 [J]. 环境化学, 2021, 40(11): 3482-3490. doi: 10.7524/j.issn.0254-6108.2020070907 ZHAO P, XIE J F, WANG S N, et al. Pollution characteristics and source apportionment of water-soluble inorganic ions in PM2.5 in Taiyuan City during the heating period [J]. Environmental Chemistry, 2021, 40(11): 3482-3490(in Chinese). doi: 10.7524/j.issn.0254-6108.2020070907
[14] LUAN T, GUO X L, GUO L J, et al. Quantifying the relationship between PM2.5 concentration, visibility and planetary boundary layer height for long-lasting haze and fog–haze mixed events in Beijing [J]. Atmospheric Chemistry and Physics, 2018, 18(1): 203-225. doi: 10.5194/acp-18-203-2018 [15] FU G Q, XU W Y, YANG R F, et al. The distribution and trends of fog and haze in the North China Plain over the past 30 years [J]. Atmospheric Chemistry and Physics, 2014, 14(21): 11949-11958. doi: 10.5194/acp-14-11949-2014 [16] 杨志文, 吴琳, 元洁, 等. 2015年春节期间天津烟花爆竹燃放对空气质量的影响 [J]. 中国环境科学, 2017, 37(1): 69-75. YANG Z W, WU L, YUAN J, et al. Effect of fireworks on the air quality during the Spring Festival of 2015 in Tianjin City [J]. China Environmental Science, 2017, 37(1): 69-75(in Chinese).
[17] ZHANG T, CHE H Z, GONG Z Q, et al. The dominant mechanism of the explosive rise of PM2.5 after significant pollution emissions reduction in Beijing from 2017 to the COVID-19 pandemic in 2020 [J]. Atmospheric Pollution Research, 2021, 12(2): 272-281. doi: 10.1016/j.apr.2020.11.008 [18] 赵雪, 沈楠驰, 李令军, 等. COVID-19疫情期间京津冀大气污染物变化及影响因素分析 [J]. 环境科学, 2021, 42(3): 1205-1214. doi: 10.13227/j.hjkx.202007249 ZHAO X, SHEN N C, LI L J, et al. Analysis of changes and factors influencing air pollutants in the Beijing-Tianjin-Hebei region during the COVID-19 pandemic [J]. Environmental Science, 2021, 42(3): 1205-1214(in Chinese). doi: 10.13227/j.hjkx.202007249
[19] HUANG X, DING A J, GAO J, et al. Enhanced secondary pollution offset reduction of primary emissions during COVID-19 lockdown in China [J]. National Science Review, 2020, 8(2): nwaa137. [20] 逯世泽, 史旭荣, 薛文博, 等. 新冠肺炎疫情期间气象条件和排放变化对PM2.5的影响 [J]. 环境科学, 2021, 42(7): 3099-3106. LU S Z, SHI X R, XUE W B, et al. Impacts of meteorology and emission variations on PM2.5 concentration throughout the country during the 2020 epidemic period [J]. Environmental Science, 2021, 42(7): 3099-3106(in Chinese).
[21] DAI Q L, DING J, HOU L L, et al. Haze episodes before and during the COVID-19 shutdown in Tianjin, China: Contribution of fireworks and residential burning [J]. Environmental Pollution, 2021, 286: 117252. doi: 10.1016/j.envpol.2021.117252 [22] SHAO M, DAI Q L, YU Z J, et al. Responses in PM2.5 and its chemical components to typical unfavorable meteorological events in the suburban area of Tianjin, China [J]. Science of the Total Environment, 2021, 788: 147814. doi: 10.1016/j.scitotenv.2021.147814 [23] 王鑫龙, 李星, 杨兴川, 等. 天津市PM2.5水溶性无机离子污染特征与来源分析 [J]. 环境污染与防治, 2019, 41(10): 1223-1226. WANG X L, LI X, YANG X C, et al. The pollution characteristics and source analysis of PM2.5 water-soluble inorganic ions in Tianjin [J]. Environmental Pollution & Control, 2019, 41(10): 1223-1226(in Chinese).
[24] CAI S Y, WANG Y J, ZHAO B, et al. The impact of the “Air Pollution Prevention and Control Action Plan” on PM2.5 concentrations in Jing-Jin-Ji region during 2012-2020 [J]. Science of the Total Environment, 2017, 580: 197-209. doi: 10.1016/j.scitotenv.2016.11.188 [25] 丁净, 唐颖潇, 郝天依, 等. 天津市冬季空气湿度对PM2.5和能见度的影响 [J]. 环境科学, 2021, 42(11): 5143-5151. DING J, TANG Y X, HAO T Y, et al. Impact of air humidity on PM2.5 mass concentration and visibility during winter in Tianjin [J]. Environmental Science, 2021, 42(11): 5143-5151(in Chinese).
[26] 天津市生态环境局. 2021年天津市生态环境状况公报 2021[R]. 天津市生态环境局. 2022. Tianjin Ecology and Environment Bureau. Tianjin Ecology and Environment Statement 2021[R]. Tianjin Ecology and Environment Bureau. 2022(in Chinese).
[27] FENG X Q, LI Q K, TAO Y L, et al. Impact of Coal Replacing Project on atmospheric fine aerosol nitrate loading and formation pathways in urban Tianjin: Insights from chemical composition and 15N and 18O isotope ratios [J]. Science of the Total Environment, 2020, 708: 134797. doi: 10.1016/j.scitotenv.2019.134797 [28] WANG S B, YIN S S, ZHANG R Q, et al. Insight into the formation of secondary inorganic aerosol based on high-time-resolution data during haze episodes and snowfall periods in Zhengzhou, China [J]. Science of the Total Environment, 2019, 660: 47-56. doi: 10.1016/j.scitotenv.2018.12.465 [29] SU T N, LI Z Q, ZHENG Y T, et al. Abnormally shallow boundary layer associated with severe air pollution during the COVID-19 lockdown in China [J]. Geophysical Research Letters, 2020, 47(20): e2020GL090041. [30] 焦方成, 武雯. 浅谈MeteoInfo: 气象数据显示的新平台 [J]. 电脑知识与技术, 2014, 10(27): 6513-6514. JIAO F C, WU W. The new platform of MeteoInfo—meteorological data display [J]. Computer Knowledge and Technology, 2014, 10(27): 6513-6514(in Chinese).
[31] HSU Y K, HOLSEN T M, HOPKE P K. Comparison of hybrid receptor models to locate PCB sources in Chicago [J]. Atmospheric Environment, 2003, 37(4): 545-562. doi: 10.1016/S1352-2310(02)00886-5 [32] 王爱平, 朱彬, 银燕, 等. 黄山顶夏季气溶胶数浓度特征及其输送潜在源区 [J]. 中国环境科学, 2014, 34(4): 852-861. WANG A P, ZHU B, YIN Y, et al. Aerosol number concentration properties and potential sources areas transporting to the top of mountain Huangshan in summer [J]. China Environmental Science, 2014, 34(4): 852-861(in Chinese).
[33] POLISSAR A V, HOPKE P K, POIROT R L. Atmospheric aerosol over Vermont: Chemical composition and sources [J]. Environmental Science & Technology, 2001, 35(23): 4604-4621. [34] 樊丝慧. 北京地区污染天气大气边界层变化特征研究[D]. 南京: 南京信息工程大学, 2021. FAN S H. Characteristics of atmospheric boundary layer under polluted conditions over Beijing[D]. Nanjing: Nanjing University of Information Science & Technology, 2021(in Chinese).
[35] CHANG Y H, HUANG R J, GE X L, et al. Puzzling haze events in China during the coronavirus (COVID-19) shutdown [J]. Geophysical Research Letters, 2020, 47(12): e2020GL088533. [36] 伍潘. 成都市PM2.5水溶性无机离子及气态前体物污染特征分析[D]. 成都: 西南交通大学, 2019. WU P. Characterization of water soluble inorganic ions in PM2.5 and gaseous precursors[D]. Chengdu: Southwest Jiaotong University, 2019(in Chinese).
[37] 徐虹, 张晓勇, 毕晓辉, 等. 中国PM2.5中水溶性硫酸盐和硝酸盐的时空变化特征 [J]. 南开大学学报(自然科学版), 2013, 46(6): 32-40. XU H, ZHANG X Y, BI X H, et al. Spatial and seasonal distribution characteristics of sulfate and nitrate in PM2.5 of China [J]. Acta Scientiarum Naturalium Universitatis Nankaiensis, 2013, 46(6): 32-40(in Chinese).
[38] 王自发, 徐洪磊, 贺克斌, 等. 京津冀及周边地区再现重污染 五位专家解答污染成因 [EB/OL]. [2020-02-11]. 北京: 人民网-人民日报, WANG Z F, XU H L, HE K B, et al. Heavy pollution reappears in Beijing-Tianjin-Hebei and surrounding areas: five experts answer the causes of pollution [EB/OL]. [2020-02-11]. Beijing: Peoples Network - People Daily,
[39] XIAO H, XIAO H Y, ZHANG Z Y, et al. Chemical characteristics of major inorganic ions in PM2.5 based on year-long observations in Guiyang, southwest China—implications for formation pathways and the influences of regional transport [J]. Atmosphere, 2020, 11(8): 847. doi: 10.3390/atmos11080847 [40] TAO Y, YE X N, MA Z, et al. Insights into different nitrate formation mechanisms from seasonal variations of secondary inorganic aerosols in Shanghai [J]. Atmospheric Environment, 2016, 145: 1-9. doi: 10.1016/j.atmosenv.2016.09.012 [41] HUANG X, QIU R, CHAN C K, et al. Evidence of high PM2.5 strong acidity in ammonia-rich atmosphere of Guangzhou, China: Transition in pathways of ambient ammonia to form aerosol ammonium at[NH4+]/[SO42−]= 1.5 [J]. Atmospheric Research, 2011, 99(3/4): 488-495. [42] WANG H B, TIAN M, CHEN Y, et al. Seasonal characteristics, formation mechanisms and source origins of PM2.5 in two megacities in Sichuan Basin, China [J]. Atmospheric Chemistry and Physics, 2018, 18(2): 865-881. doi: 10.5194/acp-18-865-2018 [43] CHENG Y F, ZHENG G J, WEI C, et al. Reactive nitrogen chemistry in aerosol water as a source of sulfate during haze events in China [J]. Science Advances, 2016, 2(12): e1601530. doi: 10.1126/sciadv.1601530 [44] HUANG R J, ZHANG Y L, BOZZETTI C, et al. High secondary aerosol contribution to particulate pollution during haze events in China [J]. Nature, 2014, 514(7521): 218-222. doi: 10.1038/nature13774 [45] 姬艺珍, 郭伟, 胡正华, 等. 太原市PM2.5积累特征及重污染天气成因分析 [J]. 环境科学学报, 2021, 41(3): 853-862. JI Y Z, GUO W, HU Z H, et al. Accumulation characteristics of PM2.5 and the causes of serious pollution weather in Taiyuan City, China [J]. Acta Scientiae Circumstantiae, 2021, 41(3): 853-862(in Chinese).
[46] ZAMORA M L, PENG J F, HU M, et al. Wintertime aerosol properties in Beijing [J]. Atmospheric Chemistry and Physics, 2019, 19(22): 14329-14338. doi: 10.5194/acp-19-14329-2019 [47] ZHANG Y L, CAO F. Fine particulate matter (PM2.5) in China at a city level [J]. Scientific Reports, 2015, 5: 14884. doi: 10.1038/srep14884 [48] LI S W, CHANG M H, LI H M, et al. Chemical compositions and source apportionment of PM2.5 during clear and hazy days: Seasonal changes and impacts of Youth Olympic Games [J]. Chemosphere, 2020, 256: 127163. doi: 10.1016/j.chemosphere.2020.127163 [49] LIN Y C, ZHANG Y L, FAN M Y, et al. Heterogeneous formation of particulate nitrate under ammonium-rich regimes during the high-PM2.5 events in Nanjing, China [J]. Atmospheric Chemistry and Physics, 2020, 20(6): 3999-4011. doi: 10.5194/acp-20-3999-2020 [50] YANG X W, CHENG S Y, LI J B, et al. Characterization of chemical composition in PM2.5 in Beijing before, during, and after a large-scale international event [J]. Aerosol and Air Quality Research, 2017, 17(4): 896-907. doi: 10.4209/aaqr.2016.07.0321 [51] 陶月乐, 李亲凯, 张俊, 等. 成都市大气颗粒物粒径分布及水溶性离子组成的季节变化特征 [J]. 环境科学, 2017, 38(10): 4034-4043. doi: 10.13227/j.hjkx.201702175 TAO Y L, LI Q K, ZHANG J, et al. Seasonal variations in particle size distribution and water-soluble ion composition of atmospheric particles in Chengdu [J]. Environmental Science, 2017, 38(10): 4034-4043(in Chinese). doi: 10.13227/j.hjkx.201702175
[52] 武高峰, 王丽丽, 董洁, 等. 国庆前后北京城区PM2.5组分污染及来源特征分析 [J]. 环境化学, 2021, 40(12): 3721-3732. doi: 10.7524/j.issn.0254-6108.2020072702 WU G F, WANG L L, DONG J, et al. Pollution and source characteristics of PM2.5 components in Beijing urban area around National Day [J]. Environmental Chemistry, 2021, 40(12): 3721-3732(in Chinese). doi: 10.7524/j.issn.0254-6108.2020072702
[53] PAN Y Y, LUO L, XIAO H W, et al. A one-year comprehensive characteristics of water soluble inorganic ions in PM2.5 from a typical mountainous city [J]. Atmospheric Pollution Research, 2020, 11(11): 1883-1890. doi: 10.1016/j.apr.2020.08.006 [54] HUANG L, SUN J J, JIN L, et al. Strategies to reduce PM2.5 and O3 together during late summer and early fall in San Joaquin Valley, California [J]. Atmospheric Research, 2021, 258: 105633. doi: 10.1016/j.atmosres.2021.105633 [55] GAO J, WEI Y T, SHI G L, et al. Roles of RH, aerosol pH and sources in concentrations of secondary inorganic aerosols, during different pollution periods [J]. Atmospheric Environment, 2020, 241: 117770. doi: 10.1016/j.atmosenv.2020.117770 -
 点击查看大图
计量
- 文章访问数: 1712
- HTML全文浏览数: 1712
- PDF下载数: 52
- 施引文献: 0
