-
我国西北农村地区人口密度低,经济水平相对落后,该区域属严重缺水的干旱地区,缺水情况逐年加剧。降雨冲刷条件、集雨卫生条件的差异使得水窖整体水质呈现微污染状态[1],浊度、高锰酸盐指数、氨氮等指标均超过了《生活饮用水卫生标准》(GB 5749-2006),对该地区人民用水安全产生了一定的威胁。因此,对雨雪水资源化回收利用和水窖水水质提升,是改善西北村镇缺水现状的迫切之需。
强化混凝包括科学选择混凝剂、提高混凝剂投量、适当投加助凝剂、调节pH等手段[2],近年来,强化混凝技术在处理生活污水、印染废水、江河湖水等方面已有诸多应用。伍彬等[3]利用混凝剂、次氯酸钠对高氨氮、高浑浊度河道水进行小试实验,结果表明,当NaClO投加量为530 mg·L−1、PAC投加量为200 mg·L−1、PAM投加量为15 mg·L−1时,在最优实验条件下预氧化-混凝处理水样后较常规混凝沉淀处理水样时氨氮去除率提升77.1%,总磷去除率提升12.7%。张国珍[4]采用臭氧-曝气生物滤池(biological aerated filter, BAF)组合工艺处理微污染窖水发现:原水经臭氧预氧化后类腐殖质、类色氨酸物质含量分别下降65%、18%,表明臭氧预氧化强化了后续生物系统的处理效果,能提升出水水质。闵芮等[5]采用预臭氧强化电絮凝联用超滤工艺处理微污染窖水,组合工艺终端出水浑浊度、高锰酸盐指数、UV254、氨氮去除率分别达到100%、98.0%、100%、90.3%,大幅降低了微污染窖水的三致风险。
目前对微污染窖水的研究多为单纯考察混凝剂的筛选实验,郭译文等[6]以村镇窖水为研究对象,运用正交实验法考察PAC、PAS、PFS、PAFC 4种混凝剂的处理效果,结果为PAC和PAFC效果优于PAS和PFS;夏玮等[7]以公园微污染源水为研究对象,考察了AS、PAC、FeCl3、PFC 4种混凝剂的处理效果,再分别与PAM、ASI(活化硅酸)复配使用,结果表明,PAC与ASI复配使用对源水的浊度和有机物的去除效果好,ASI复配时形成的网链状絮体结构更稳定,助凝效果更佳。筛选实验能够筛选出最佳组合,但在投加量方面难以给出最优数值,只能在一个较为准确的范围给出大概的整数值。如果能利用软件分析出最优参数,就能够节约药剂,带来最优的经济效益。响应曲面优化设计法(respond surface methodology, RSM)能够对混凝工艺进行优化,其建立的复杂多维空间曲面接近实际情况,相较于常用的正交回归分析模型,二次曲面响应法回归模型具有实验次数少、回归方程精度高、预测性能好的优势[8],在模拟和系统动力学领域得到广泛应用。本研究以混凝剂投加量、助凝剂投加量、pH为自变量,在单因素实验的基础上,采用响应曲法设计优化实验、建立模型、寻找实验指标与各影响因子间的定量规律,找出各因子水平的最佳组合,在多元线性回归的基础上主动收集数据,通过建立二次多项式和响应面模型,确定最佳工艺参数,并为西北村镇地区非常规水源的净化提供技术参考。
-
本实验以甘肃省庆阳市环县木钵镇二合塬村和北郭源村周边雨窖窖水水质为模拟研究对象,模拟水质指标如表1所示。
-
高岭土,腐殖酸(HA,富里酸(FA)≥90%),聚合氯化铝(PAC,固含量≥27%,盐基度为45%~96%),聚合氯化铁(PFC,纯度为40%~90%,水不溶物≤3%),聚丙烯酰胺(PAM,固含量≥90%,水解度≤30%),聚二甲基二丙烯酰胺(PDMDAAC,分子质量为40~50×104 Da,质量浓度20%,特征粘度为800~1 000 (25 °C)),以上药品均为分析纯;氯化铵、磷酸二氢钾均为优级纯;所有药品均购于国药试剂有限公司。
-
1)实验水样的配置。实验水样用去离子水和自来水1:1配制,而后加入一定量的高岭土、腐殖酸、氨氮、磷储备液,pH调为8;储备液、混凝剂使用液均由超纯水配制。
2)混凝过程。混凝过程于六联磁力搅拌器上进行。混凝实验的具体参数结合前期所做实验设置:以300 r·min−1快搅1 min,再以80 r·min−1慢搅10 min,结束后静置30 min,取烧杯液面下2~3 cm处水样。
3)响应曲面设计过程。根据前期实验确定水力条件为次要因素,混凝剂投加量、助凝剂投加量、试验用水pH为主要影响因素,以软件Design-Expert 13为运行平台,根据Box-Becken Design(BBD)中心组合设计原理,设计并进行响应面实验,其实验结果通过ANOVA功能进行方差分析[9]。
4)分析方法。ζ电位采用电位分析仪(Malvern Zetasizer Nano ZS90,英国)测定;三维荧光强度采用三维荧光光谱仪(Hitachi,F-7000,日本)测定,采用FRI法对荧光区域进行分区并且通过Matlab进行半定量分析[10],其他水质指标的测定参考《水和废水监测分析方法 (第四版)》[11]。
-
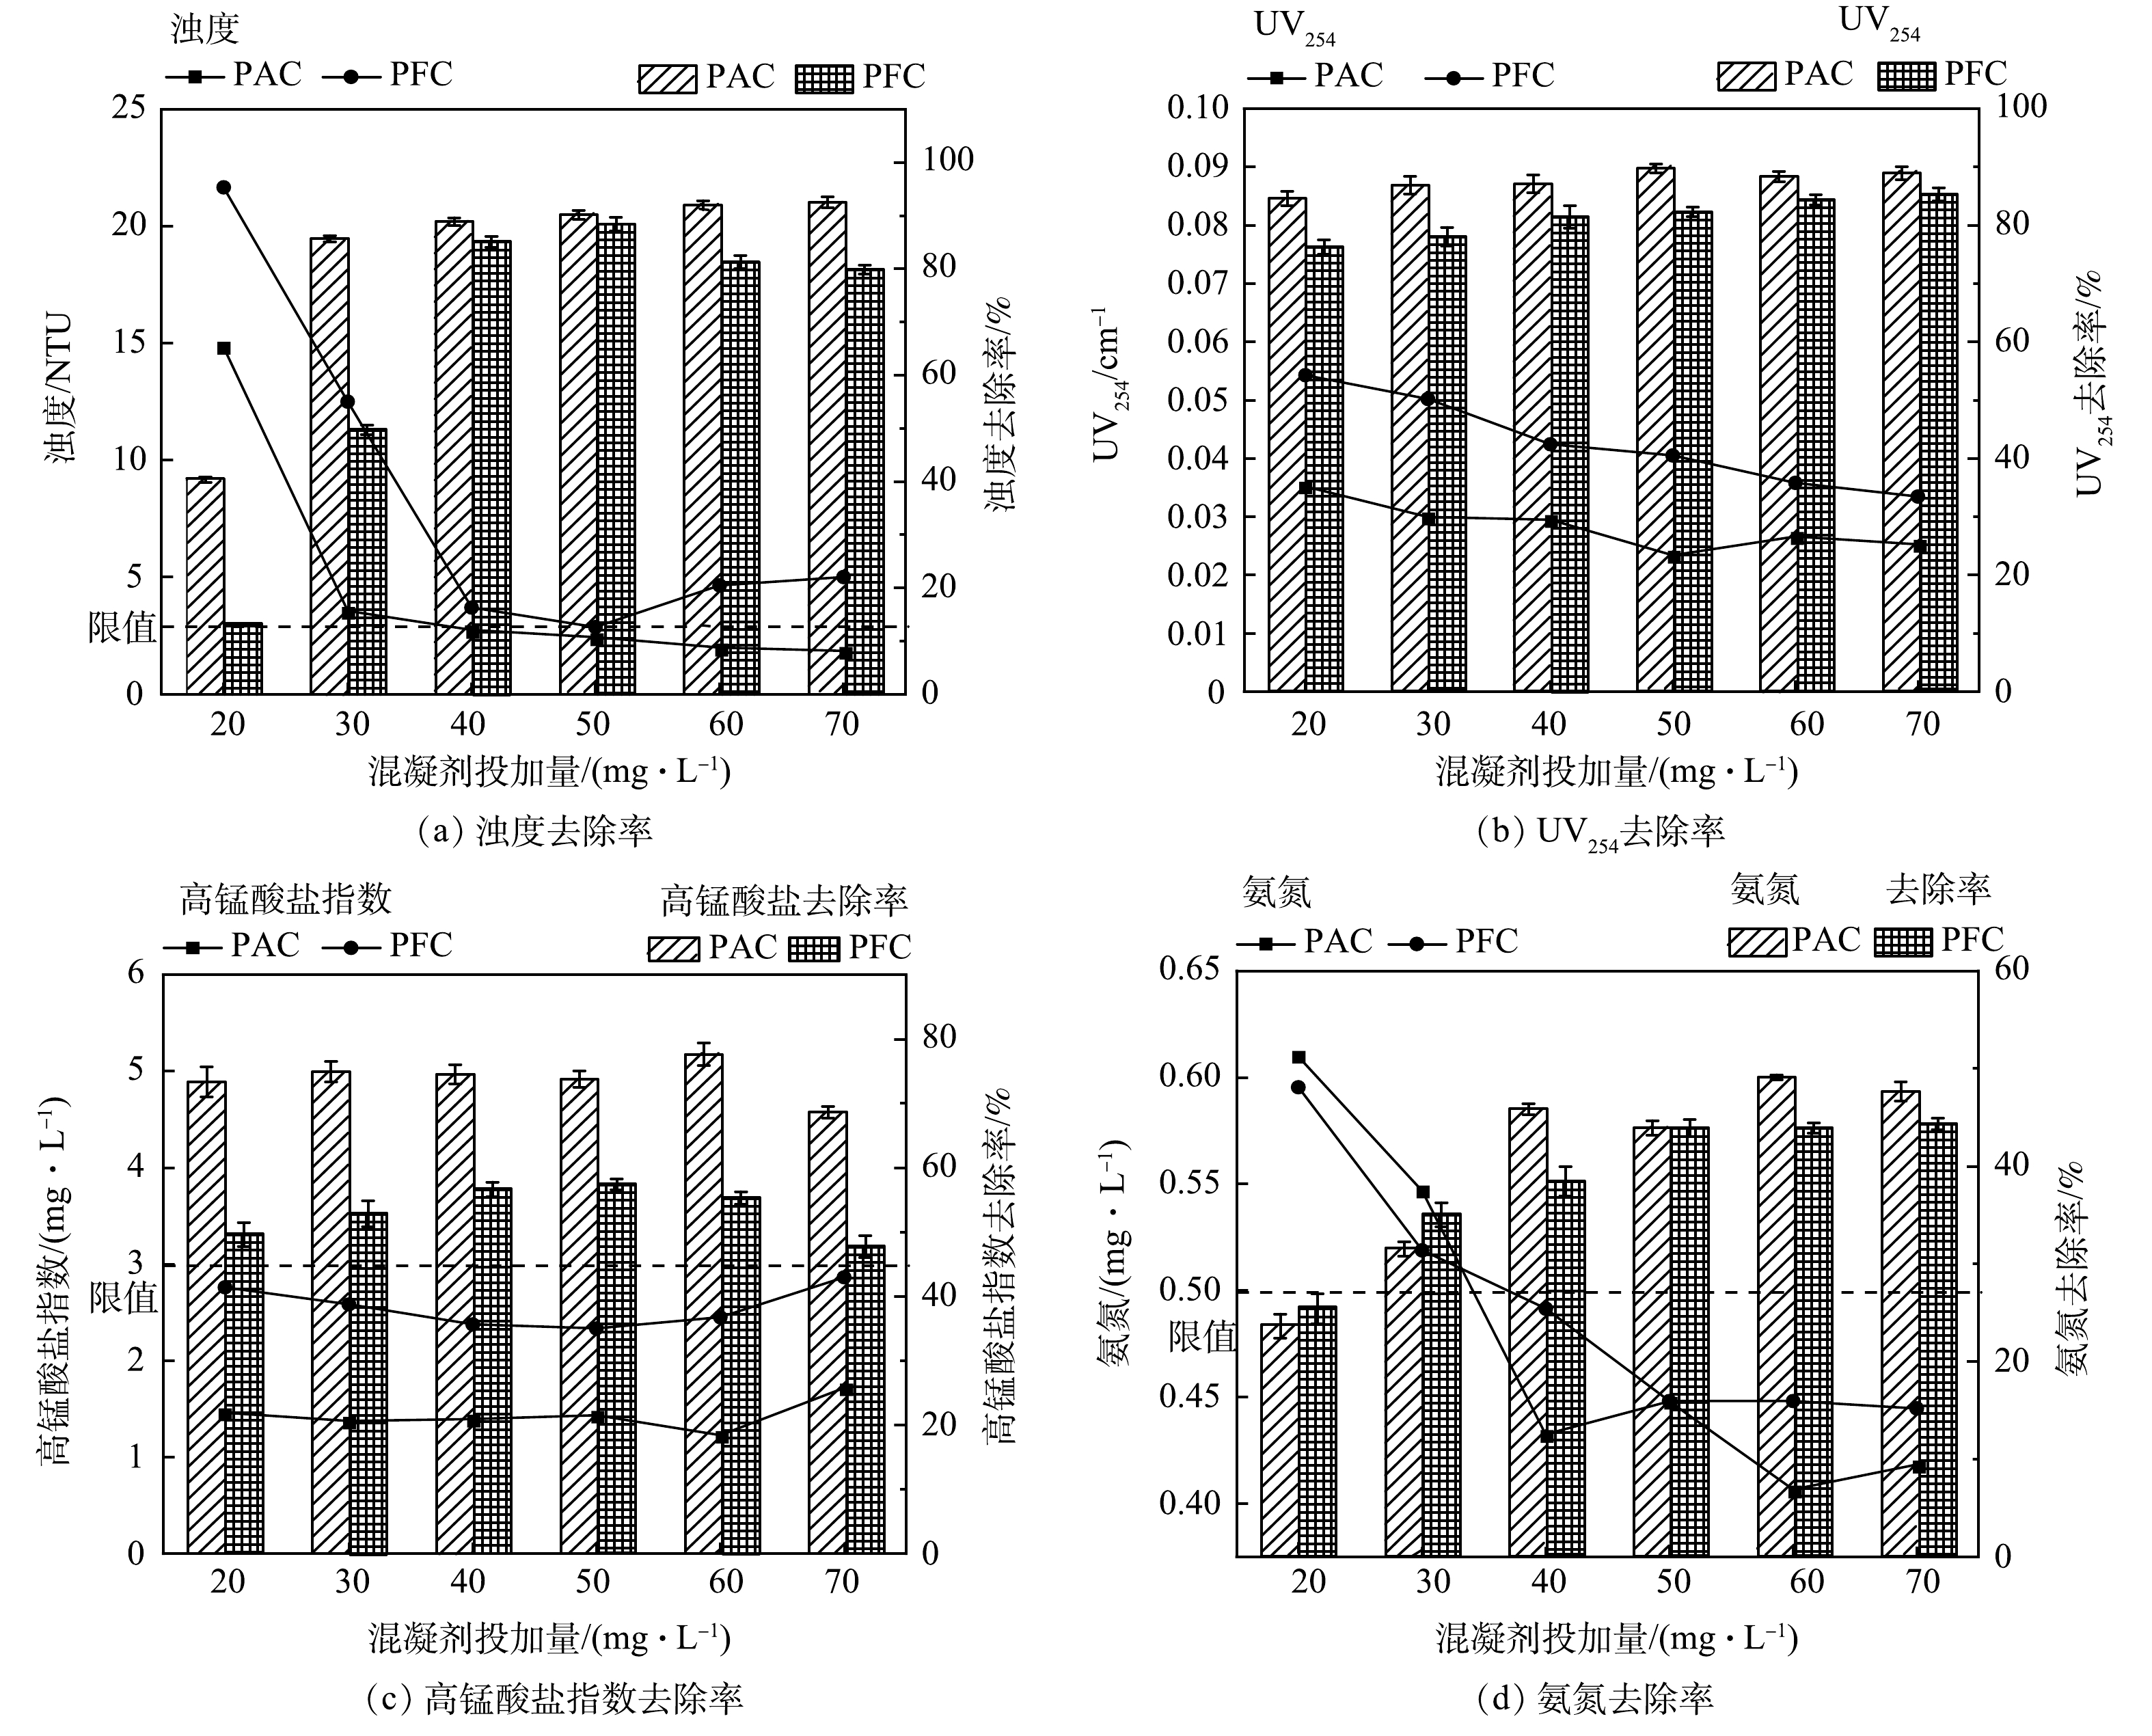
为探究混凝剂投加量对混凝效果的影响,考察了PAC、PFC投加量为20~70 mg·L−1,水样pH=8条件下浊度、UV254、高锰酸盐指数、氨氮的去除率,结果见图1。由图1可以看出,使用PAC为混凝剂时,随着投量增加,浊度去除率先大幅升高后趋于平缓,氨氮去除率先升高后稳定,UV254、高锰酸盐指数去除率变化不明显,在投加量为40 mg·L−1时其对浊度的最大去除率为89.1%。类似地,当使用PFC为混凝剂时,随着投量增加,浊度去除率先大幅升高后小幅降低,最大达到85.4%;高锰酸盐指数去除率先升后降,在投加量为50 mg·L−1时最大去除率为57.6%。混凝剂在低剂量条件下效果不佳的原因是电中和能力受到抑制;混凝剂在高剂量下效果不佳的原因是胶粒吸附了过量的金属离子,体系显正电性,颗粒难以聚集,混凝效果变差。图1反映出UV254去除率比高锰酸盐指数去除率较高,这是由于混凝工艺的电性中和作用对腐殖酸类芳香族化合物有一定去除效果[12],而对能被高锰酸钾氧化的还原性物质的去除作用存在局限性。
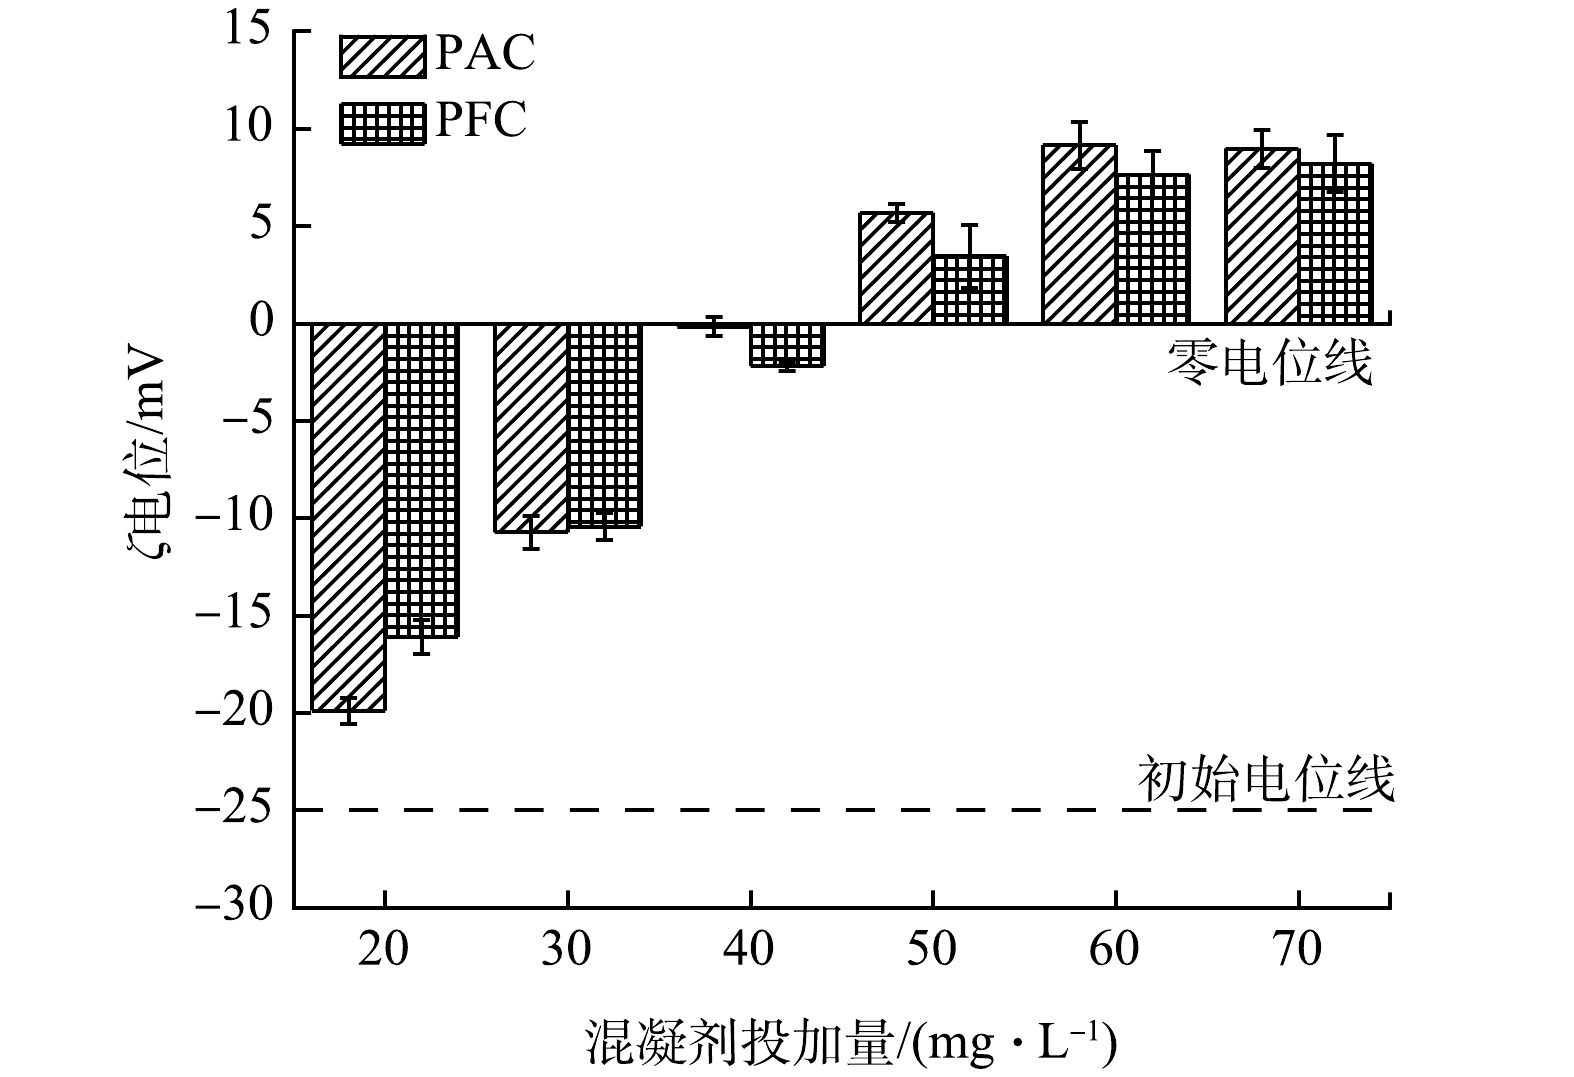
由图2可以看出,水体ζ电位的绝对值随着混凝剂投加量的增加呈现先降后升的走势。已知高岭土-腐殖酸体系模拟窖水呈现负电性,在加入带有正电性的PAC、PFC后,其络合态金属离子会压缩胶粒双电层,与胶粒上的负电荷中和,导致ζ电位降低,胶粒之间的排斥作用减弱,吸附桥接形成的絮体与投入的混凝剂达到一个平衡状态;当PAC、PFC投量过多后,吸附桥接作用减弱,水体呈正电性;当PAC、PFC投加量为40~50 mg·L−1时,ζ电位最接近零电位,这与前文提及的PAC为40 mg·L−1、PFC为50 mg·L−1处混凝效果显著一致。
-
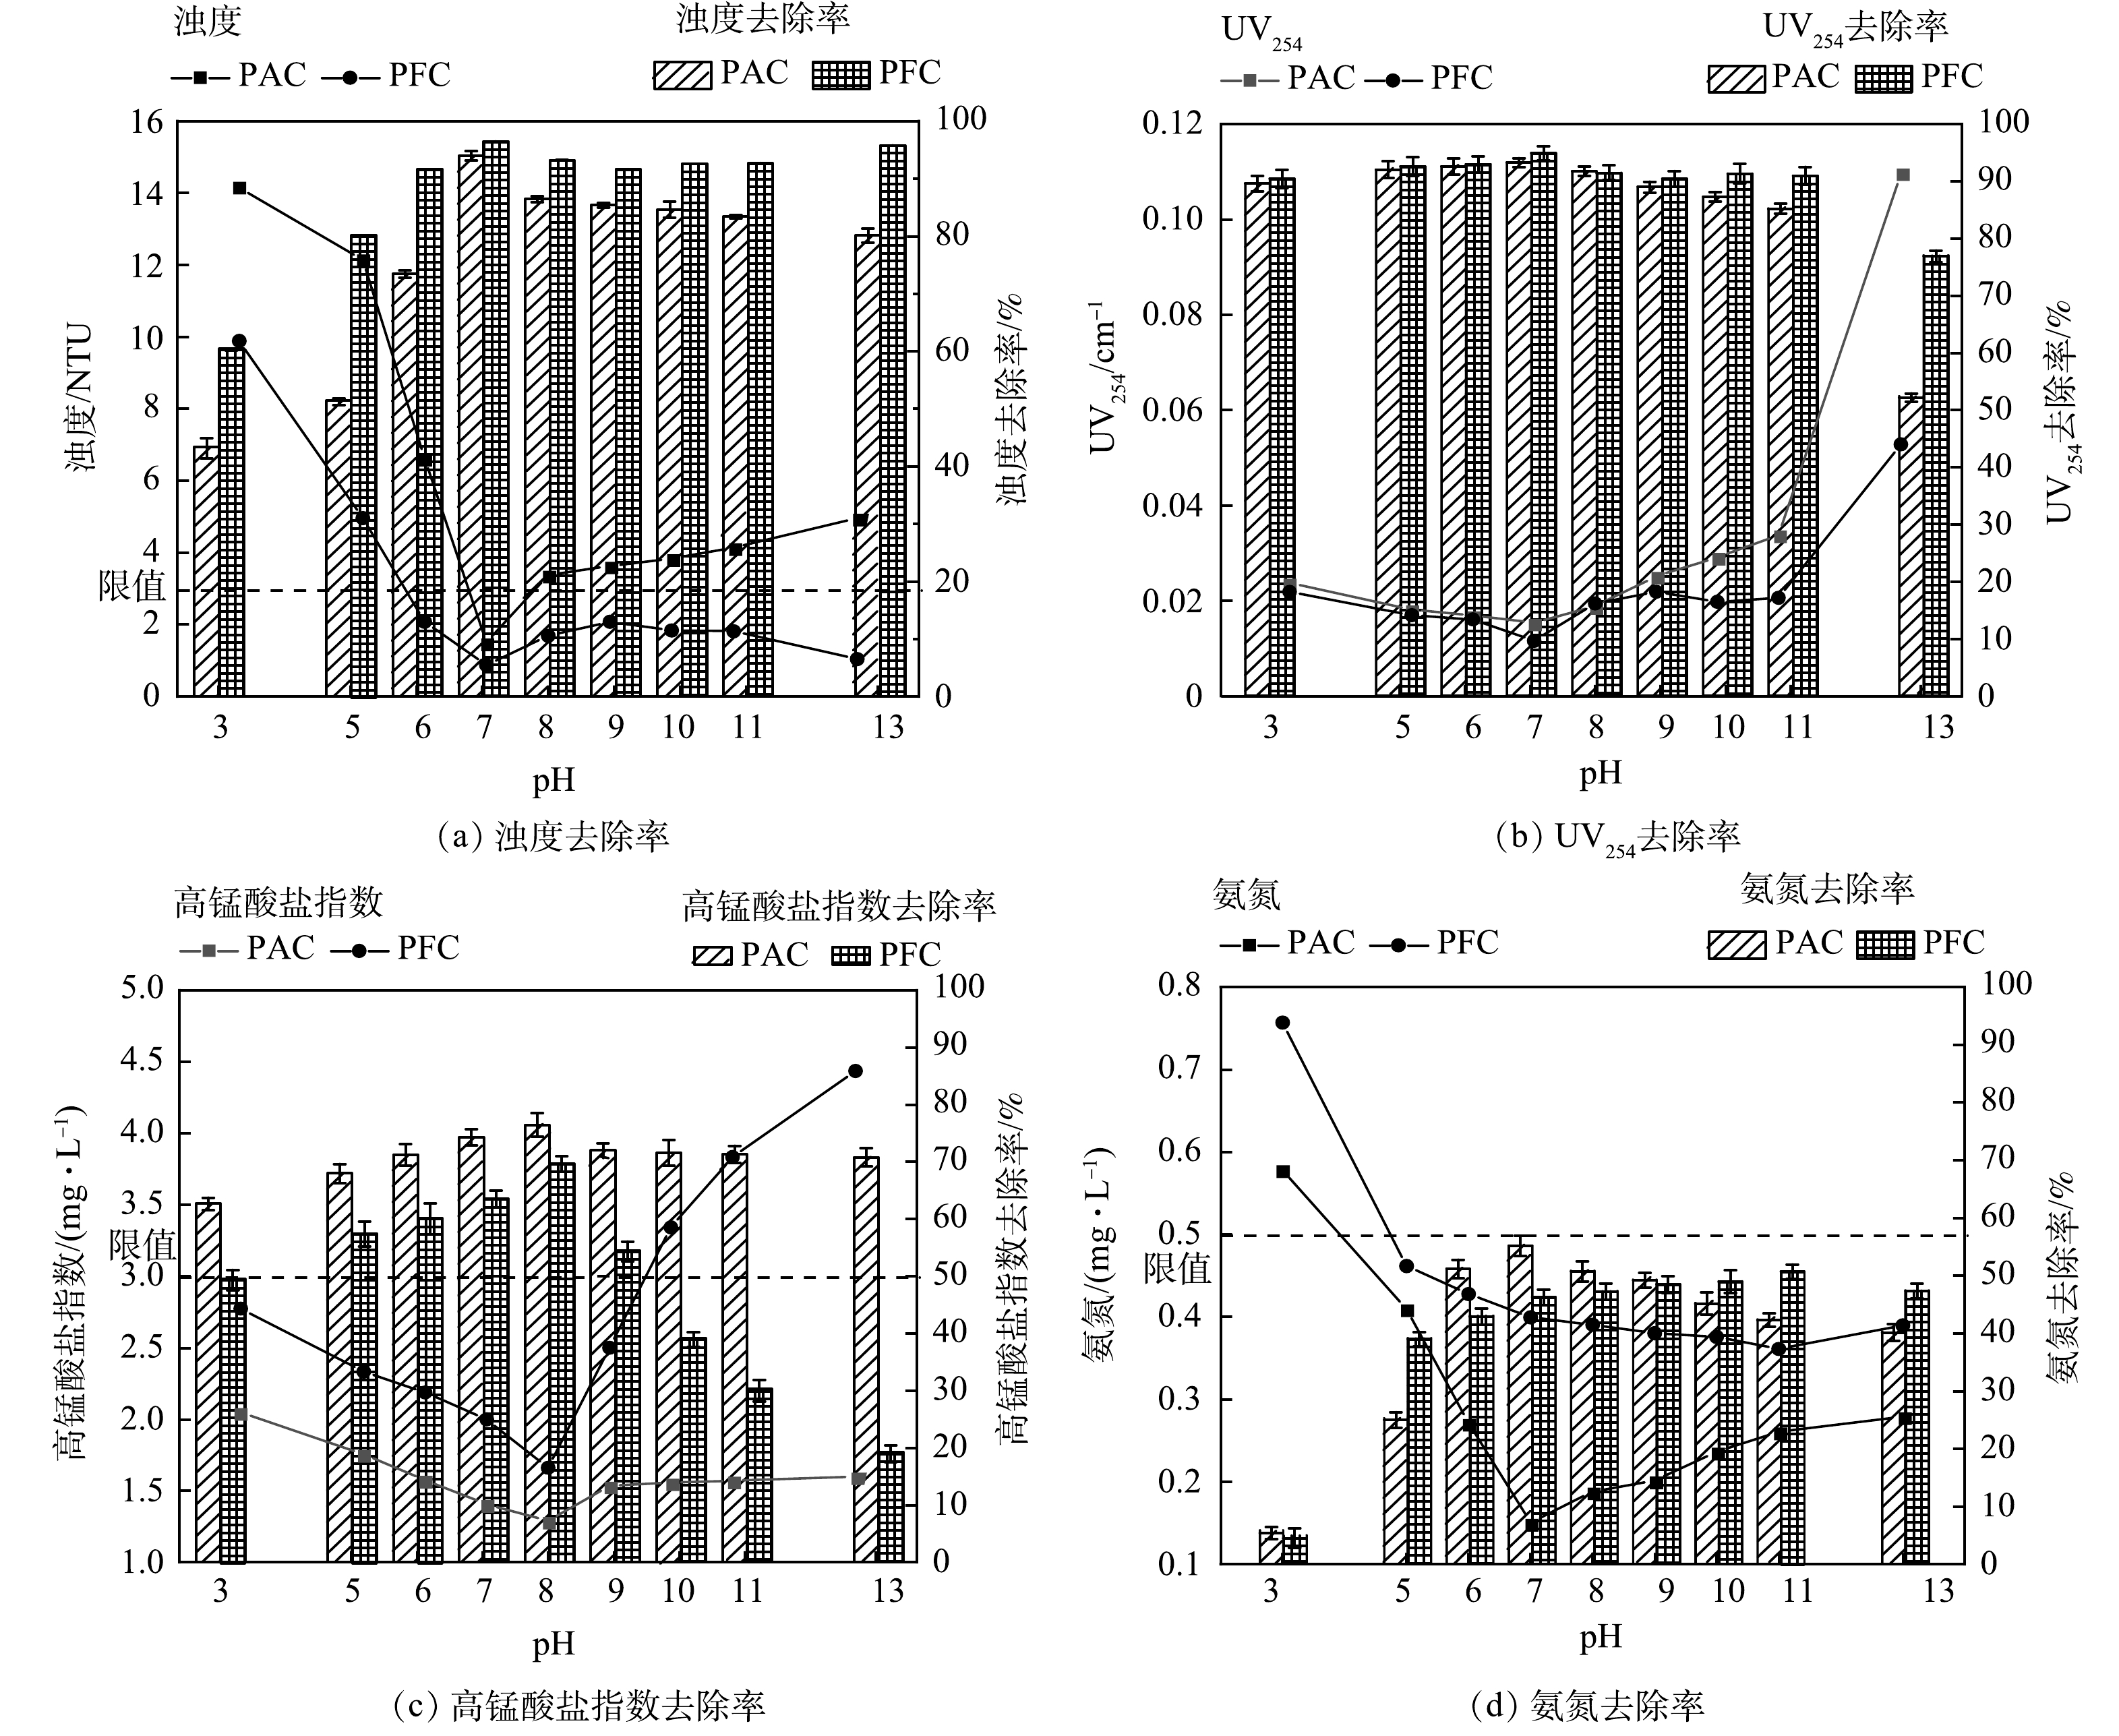
为探究原水在不同pH环境下对混凝效果的影响,在pH=3~13,混凝剂投加量为40 mg·L−1条件下,浊度、UV254、高锰酸盐指数、氨氮去除率的变化情况见图3。由图3可见,pH对混凝效果影响较为明显。随着pH升高,浊度、高锰酸盐指数、氨氮呈现先升后降的走势,UV254只在pH>11时明显降低;在pH=7~9时,总体混凝效果较好。这是因为PAC水解会生成具有两性的氢氧化铝,在低pH条件下,其溶于水以Al3+形式存在,无法进行吸附架桥和颗粒胶体结合,混凝效果不佳;在中性条件,其溶于水以[Al(OH)3(H2O)3]形式存在[13],能生成微小胶体,吸附粘结水中杂质并将其卷带,混凝效果较好;在碱性条件下,其溶于水以[Al(OH)4(H2O)2]−、[Al(OH)2(H2O)8]4+形式存在,这类低电荷高聚物凝胶会使得混凝效果变差。PFC适用pH的范围较PAC更宽,在低pH条件下,PFC水解后主要以各种高电荷低聚合度络合离子的形式存在,过量的正电荷会使微粒再稳定,混凝效果一般;在pH=7~9时,PFC中Fe3+水解以[Fe(OH)]2+、[Fe(OH)2]+ 等低电荷多核络离子或氢氧化物凝胶的形式存在,ζ电位在零值附近,表明此时易脱稳微粒能通过吸附架桥、卷扫作用聚集沉淀;当pH继续升高时,PFC水解产物所带电荷减少,ζ电位绝对值增大,混凝效果变差。
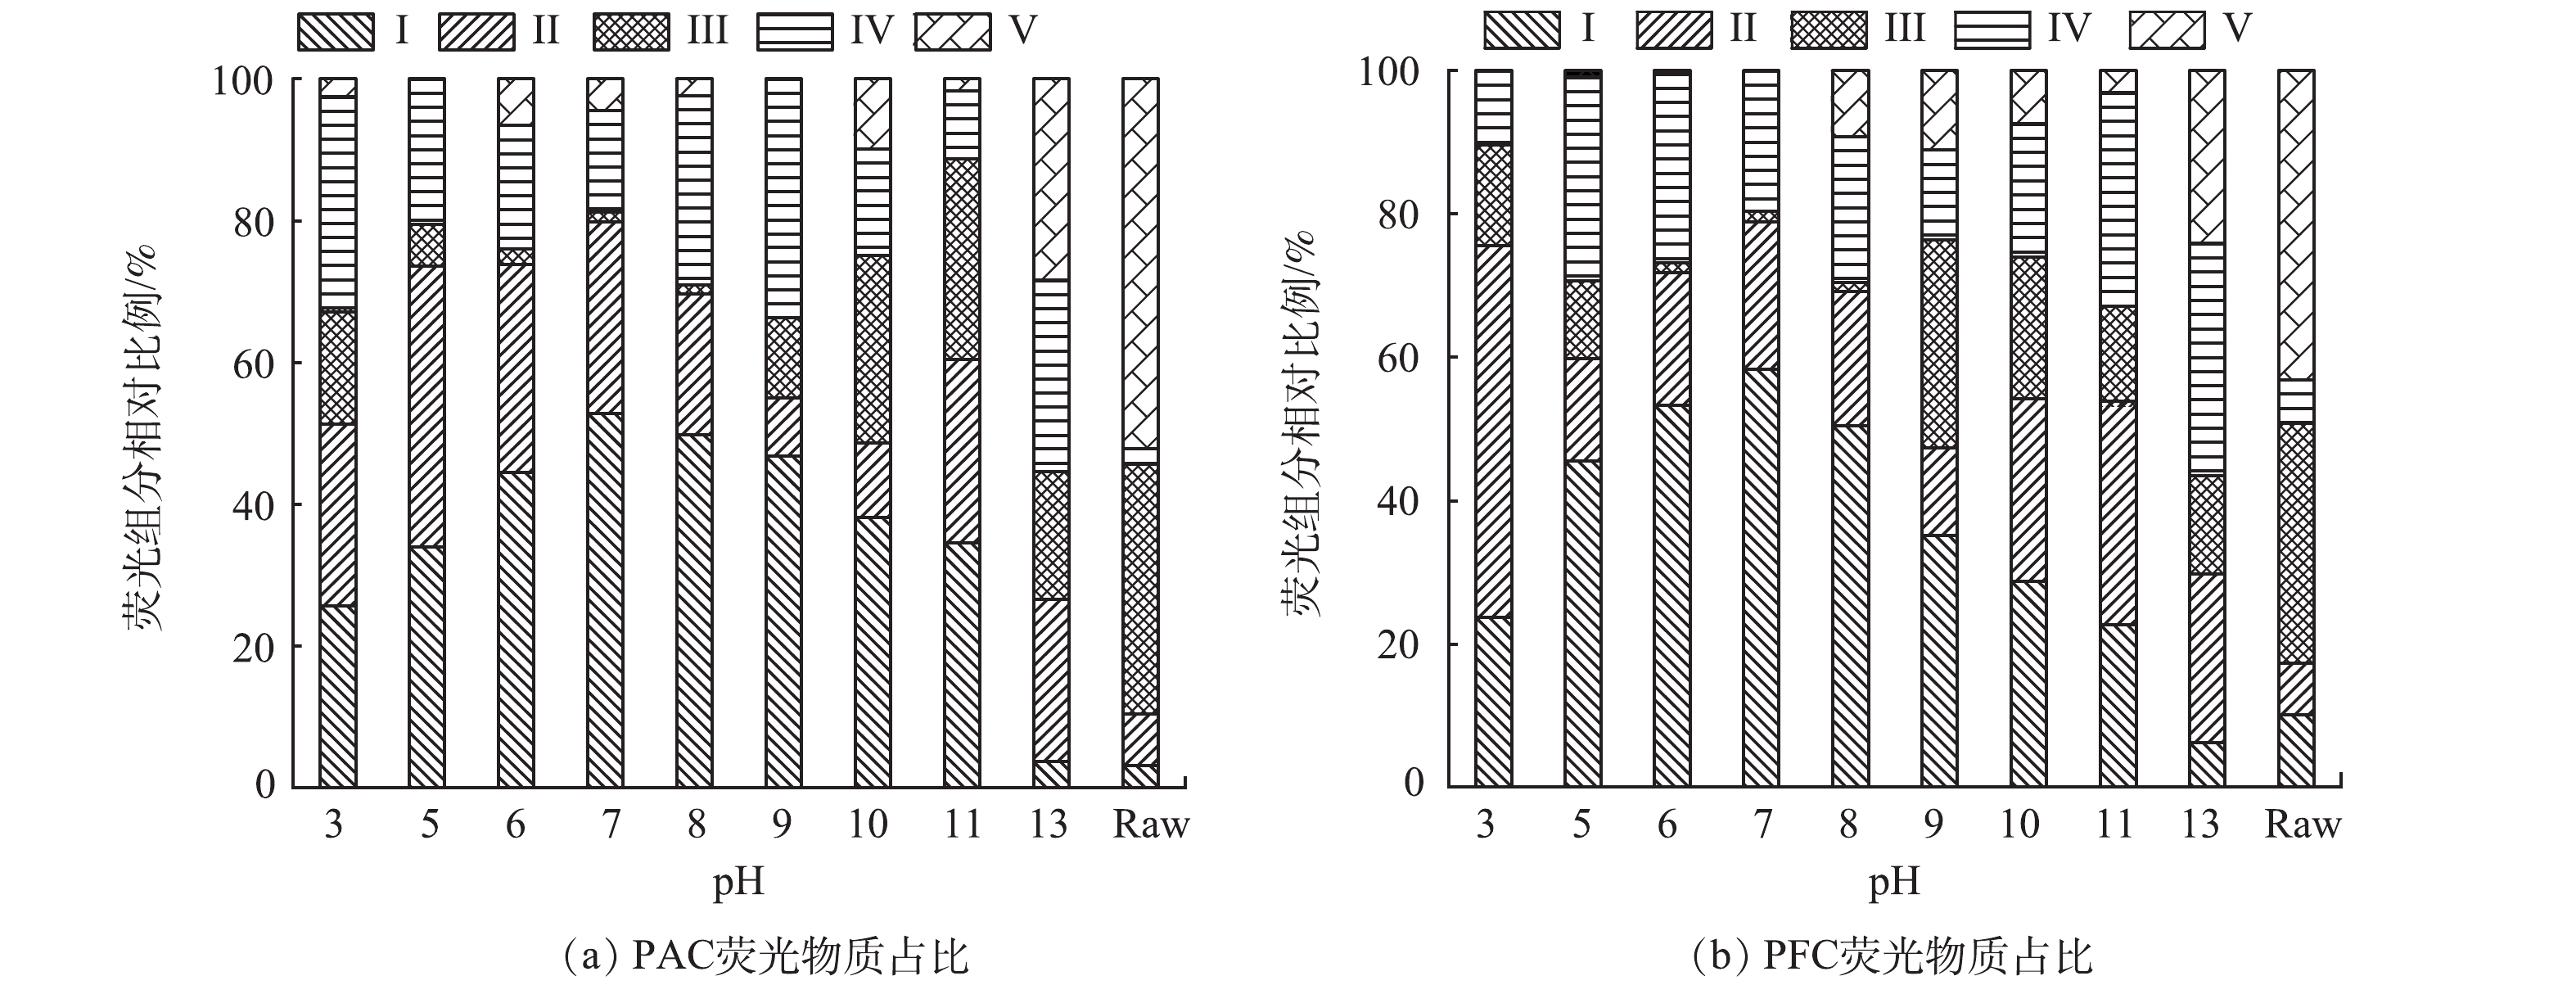
图4反映了在不同pH条件下使用混凝剂后,水体中不同荧光组分的占比情况。当PAC、PFC分别在pH=7~9、pH=6~8的条件下使用时,混凝后水体中类富里酸和类腐殖酸物质占比之和较其他pH条件下明显更小,两类物质占比之和较原水最大分别降低了83.7%和75.1%。
-
为探究助凝剂种类、投量对混凝效果的影响,在pH=8的条件下分别考察了PAM投加量(0.25~1.00 mg·L−1),PDMDAAC(简称为PDM)投加量(0.5%~2.0%)对水中浊度、UV254、高锰酸盐指数、氨氮的去除率的影响。
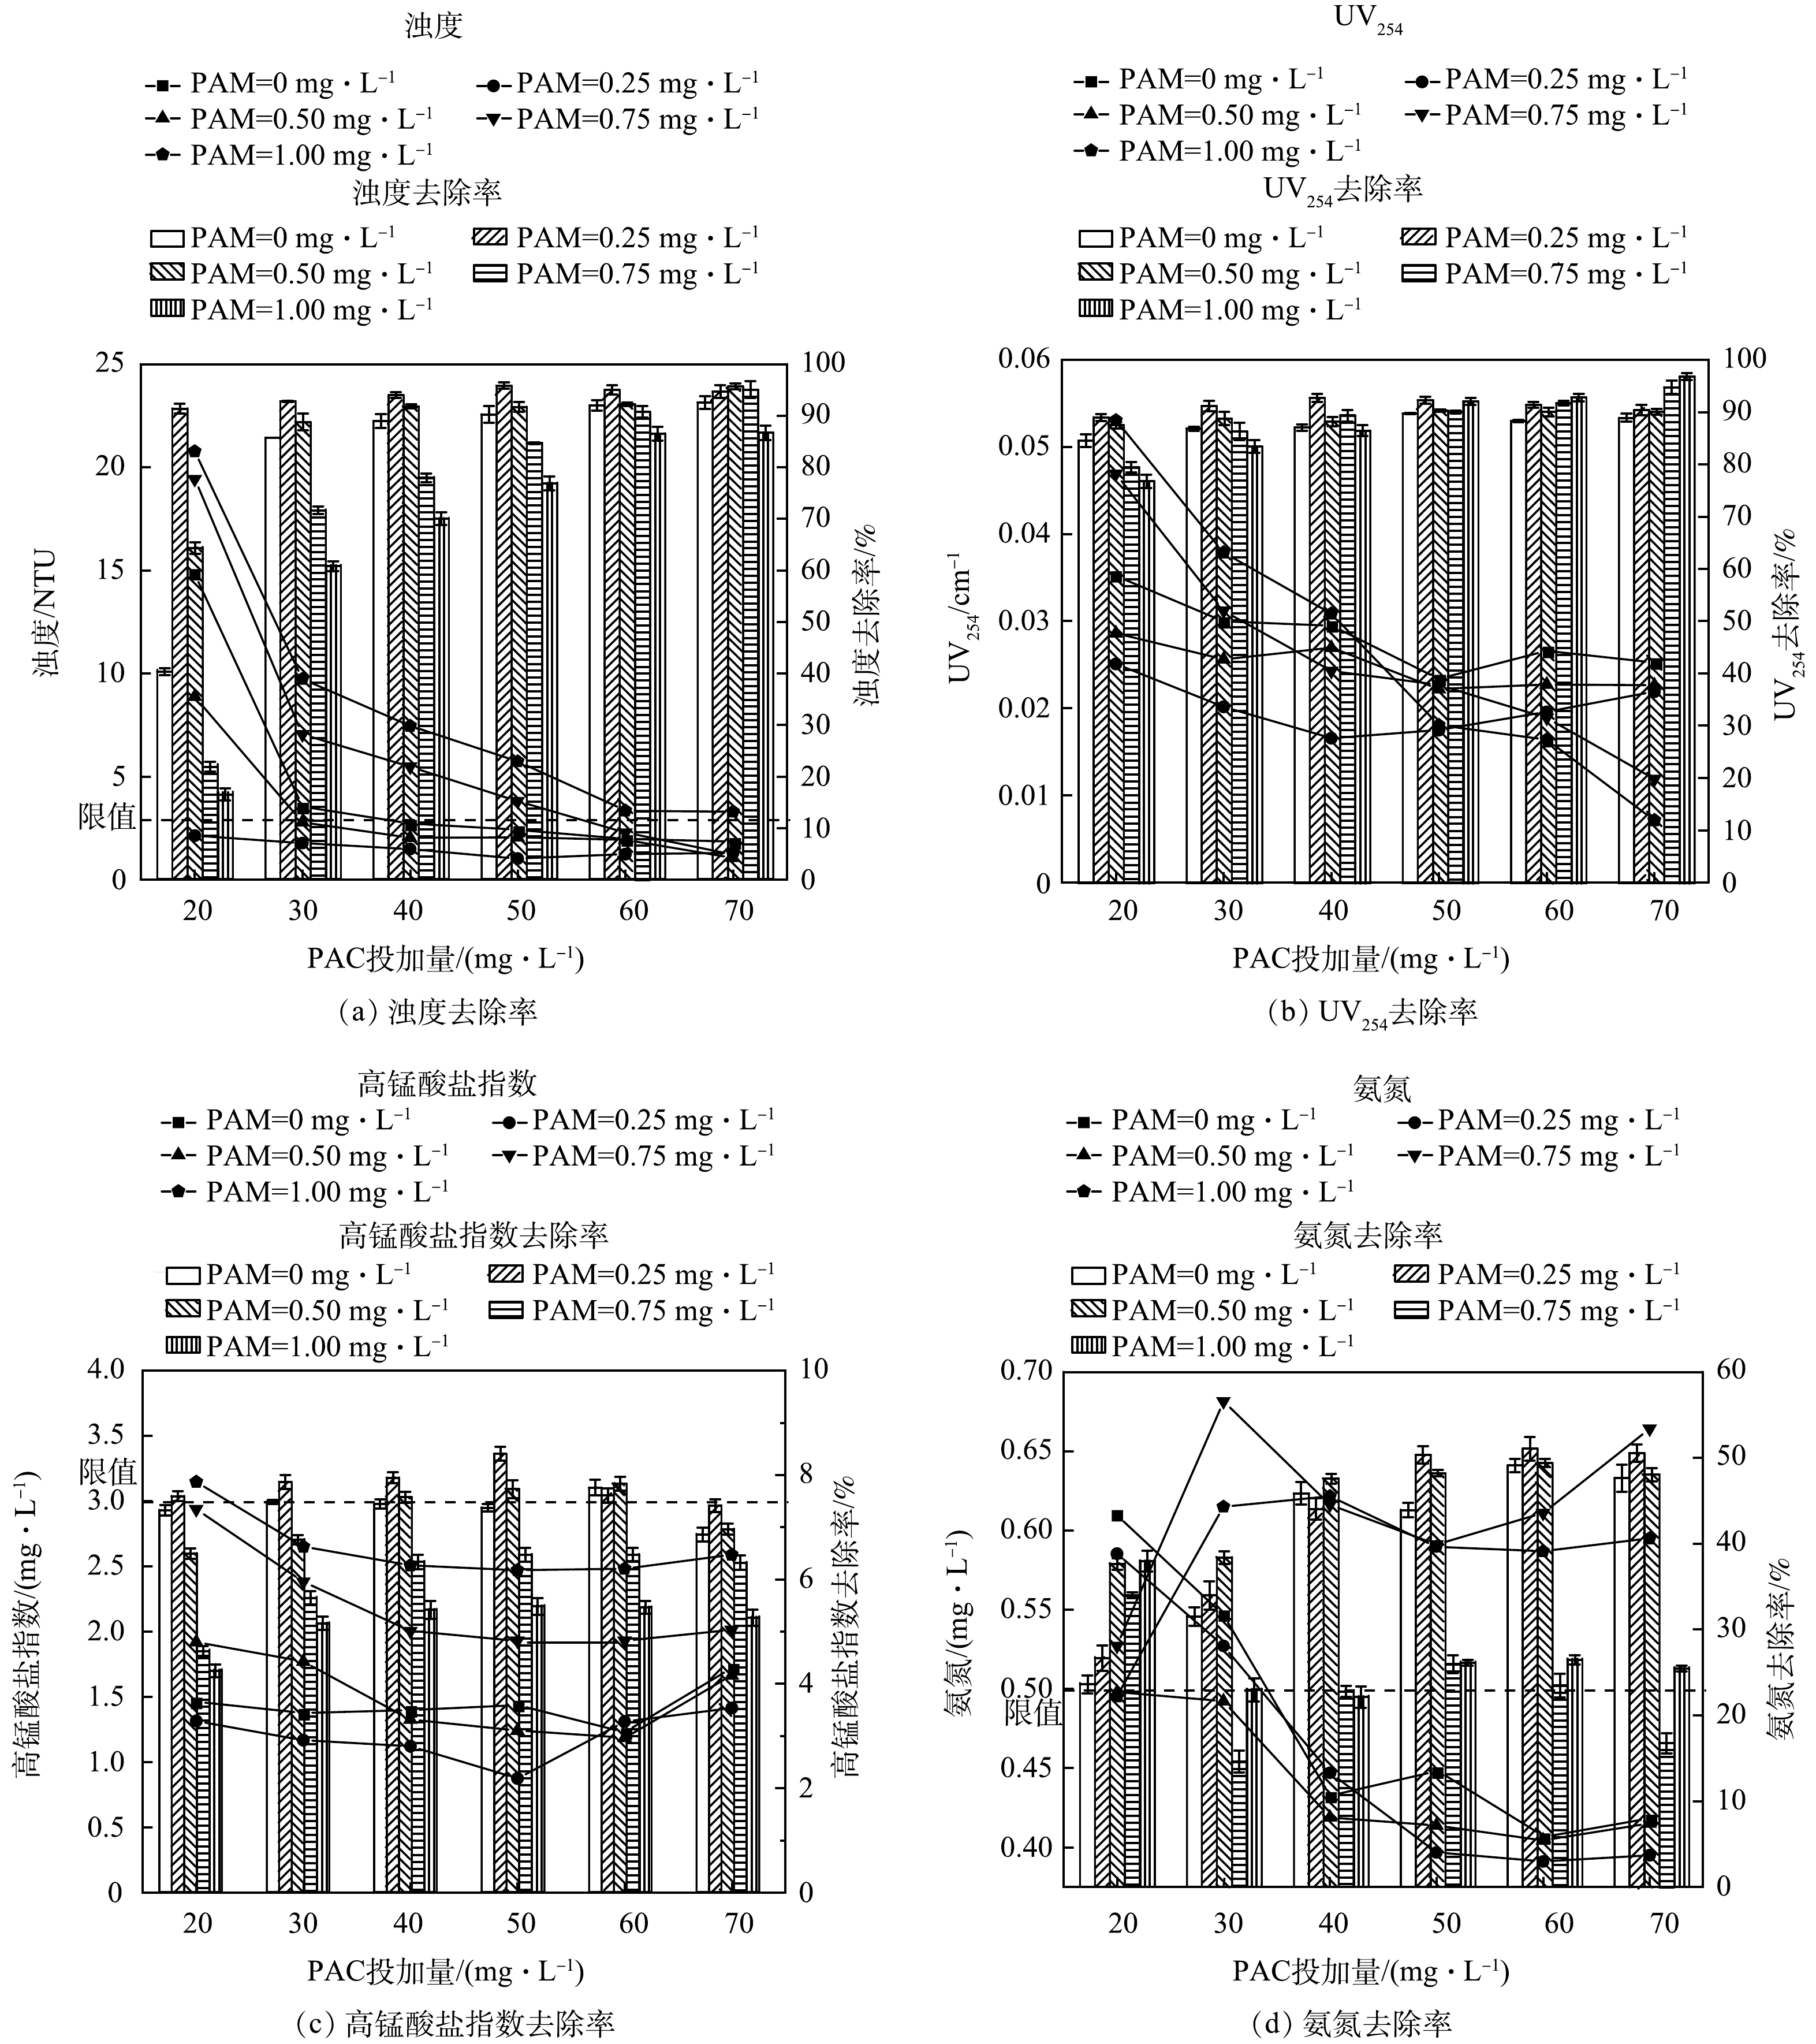
1) PAC+PAM组合的混凝效果。图5反映了不同投加量的PAC与PAM联用的混凝效果。可以看到,低投加量的PAM混凝效果优于单独投加PAC,高投加量的PAM混凝效果比单独投加PAC要差,当PAC与0.25 mg·L−1 PAM组合使用时,其浊度、高锰酸盐指数、UV254、氨氮的去除率最大分别为91.9%、84.1%、92.8%、50.4%。这是因为PAM所带的阳离子能够帮助发挥电性中和作用,使胶体颗粒更易吸附,并且较高的分子质量也大大提升了桥接作用,让胶体颗粒成为更大絮凝体。当PAM质量浓度一定时,随着PAC质量浓度的增加,污染物去除率总体上呈现先增后减的走势,当PAC质量浓度为50 mg·L−1,低剂量PAM与PAC复配效果较好;高剂量PAM与PAC复配效果较差原因在于过量PAM导致的胶体颗粒再稳定以及大分子之间卷扫桥接的相互抑制,无法完全发挥架桥作用。
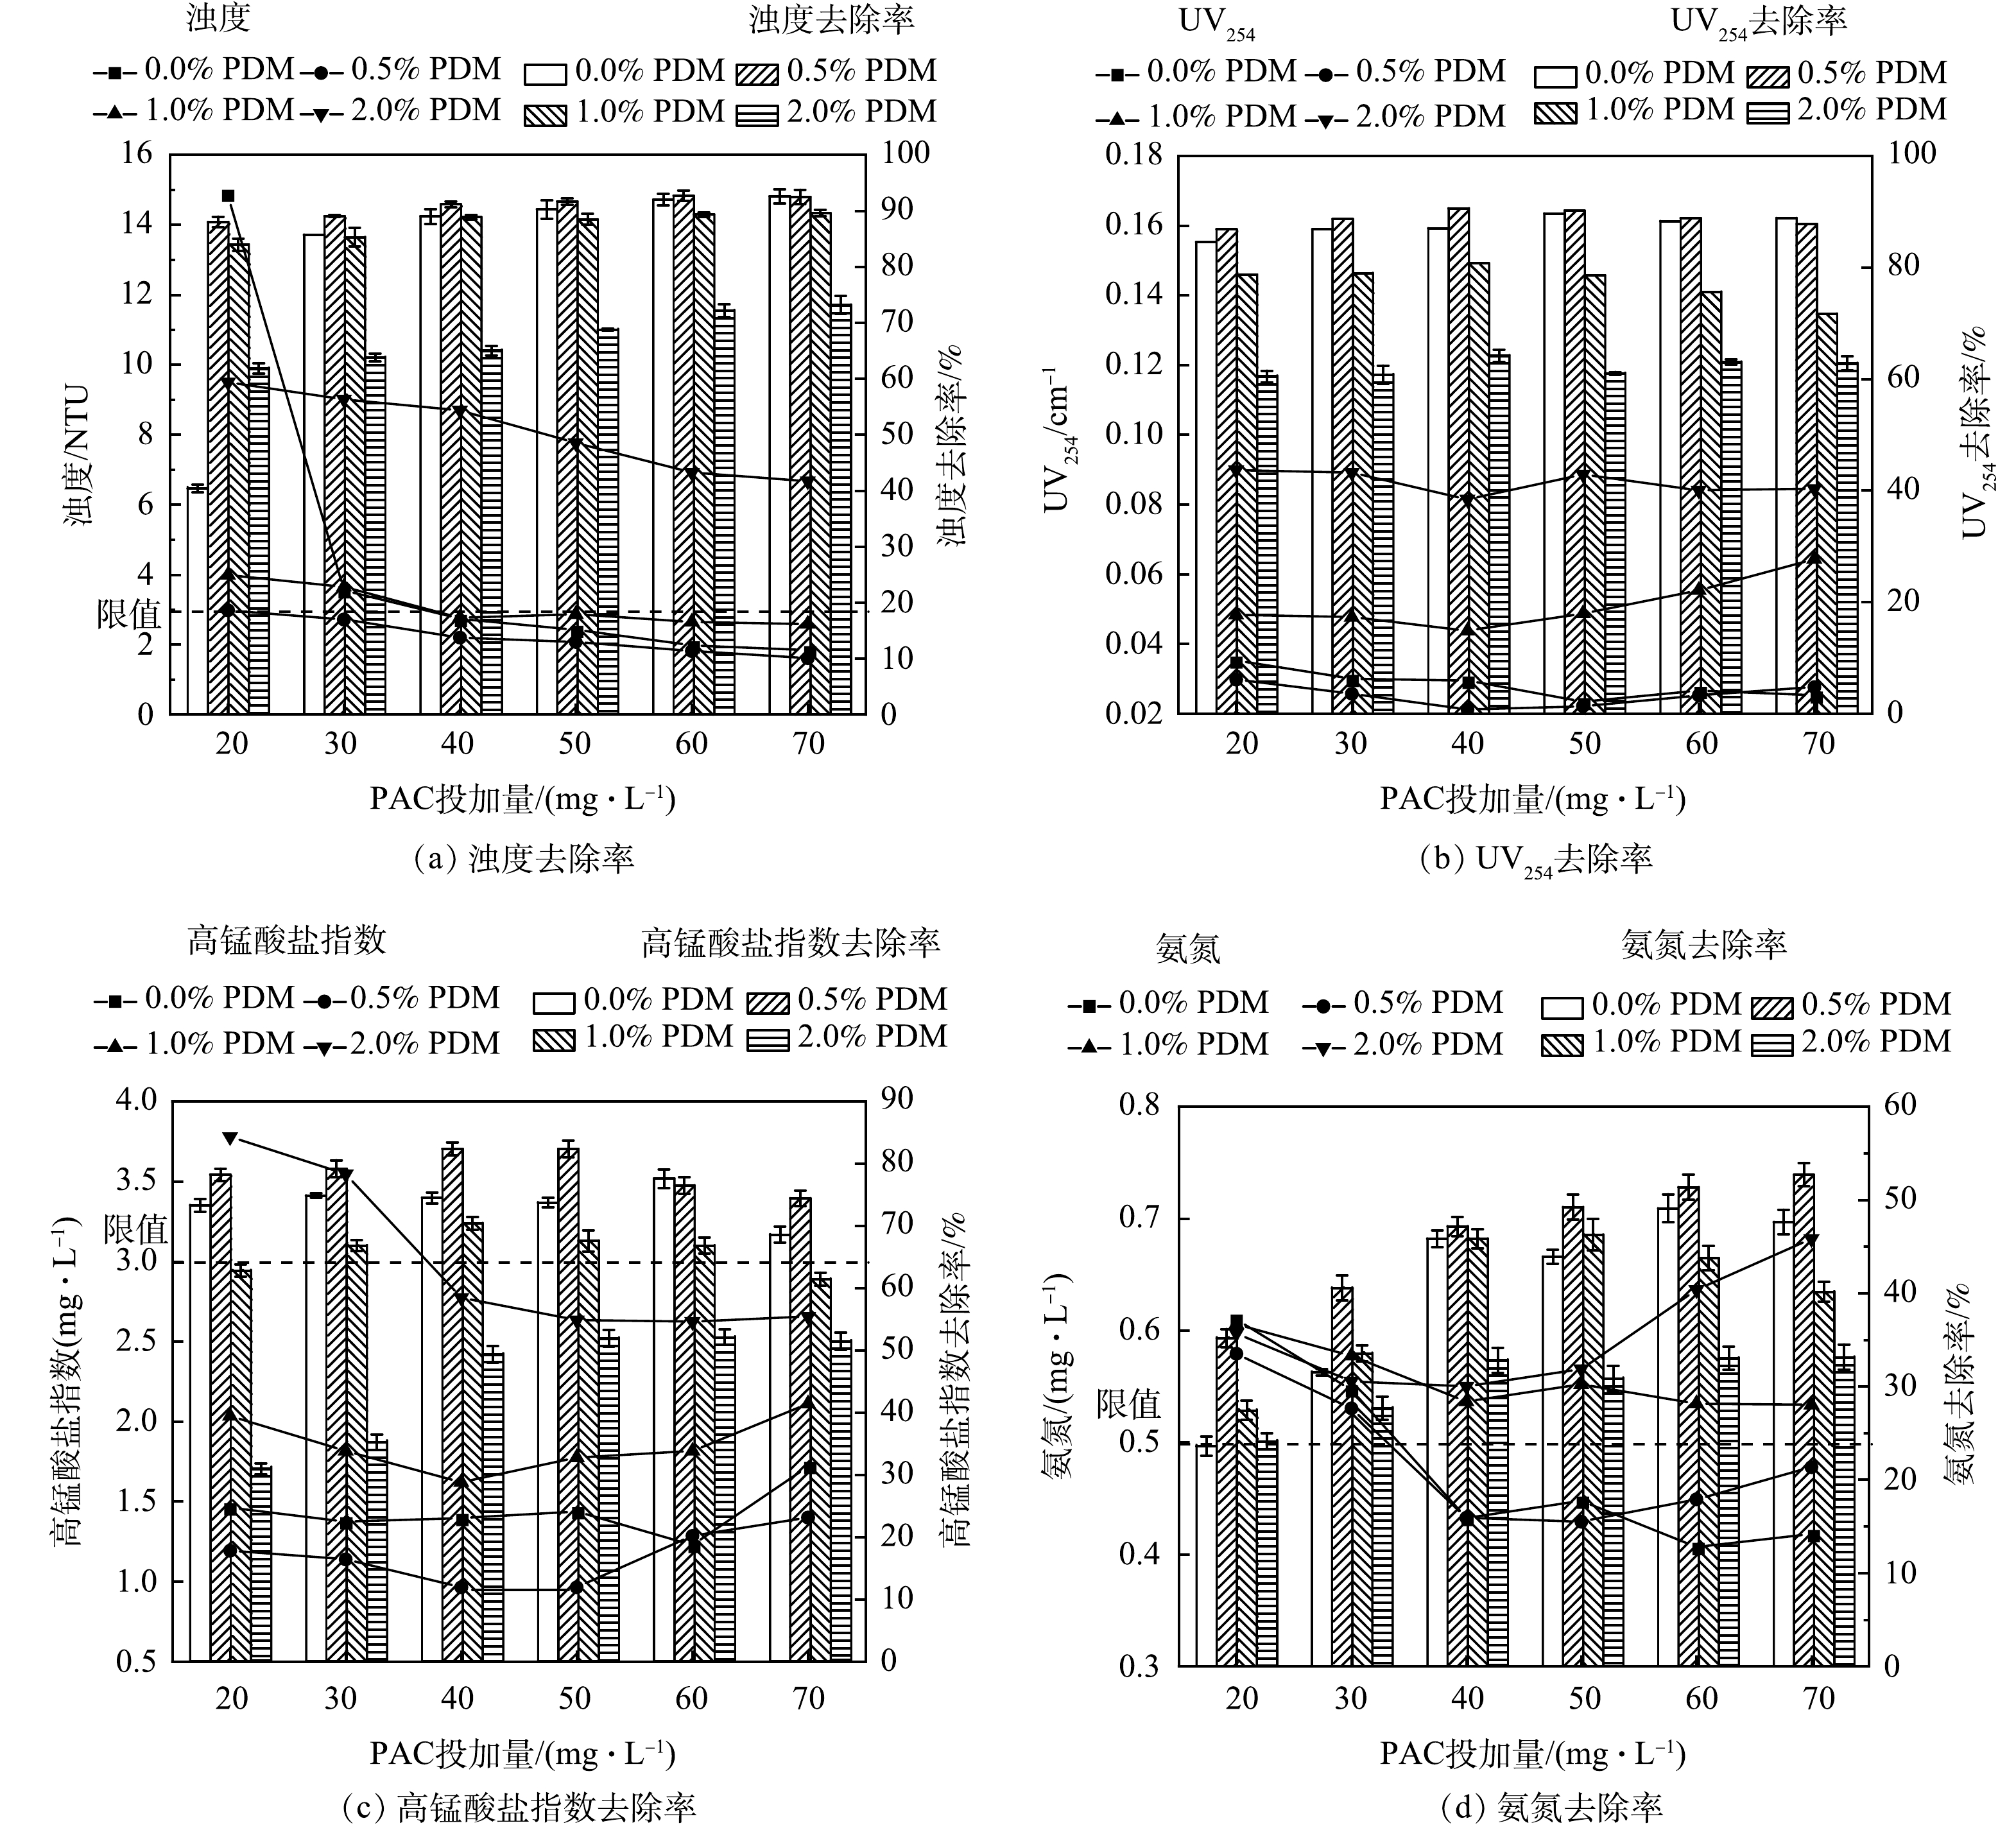
2) PAC+PDM组合的混凝效果。图6反映了不同投加量的PAC与PDM联用对水质的处理效果。当PAC与0.5%PDM联用时,其浊度、高锰酸盐指数、UV254、氨氮的去除率最大分别为92.6%、90.8%、82.5%、52.8%,与单独投加PAC相比,提升幅度不大。这是因为低剂量的PDM长链所能提供的的吸附位点有限[14]。PDM投加比例越大,效果反而越差。这是因为当PDM含量过高时,过多的阳离子导致胶体间排斥能增大难以凝聚并沉淀。鉴于PDM的有效投药范围窄,且市面上PDM多为液体产品,价格高,相比较而言,PAC+PAM效果优于PAC+PDM,所以最终选择PAC+PAM组合进行后续响应曲面研究。
-
采用Box-Behnken设计17个实验点,分别以混凝剂投量(X1)、助凝剂投量(X2)、pH(X3)为自变量,以出水水质浊度去除率(Y1)、UV254去除率(Y2)、高锰酸盐指数去除率(Y3)、氨氮去除率(Y4)为因变量,进行3因素3水平的响应曲面设计。表2为实验因素及水平,表3为实验结果,表4、表5为响应模型分析结果,选用Design Expert统计软件进行多元回归拟合。
由表4~5可知,在高锰酸盐指数去除模型中,P<0.000 1,说明模型显著,且在该模型中X1的P<0.000 1,说明在高锰酸盐指数去除中混凝剂投加量起决定作用,其次是助凝剂投加量和pH。
表6为4个响应模型的可信度分析结果。由表6可知,4个模型的变异系数和信噪比均满足要求;浊度和高锰酸盐指数模型的信噪比远大于4,表面模型具有较小的噪音,真实度高,其
$ {R}^{2} $ 和$ {R}_{\mathrm{a}\mathrm{d}\mathrm{j}}^{2} $ 值也表明回归方程对混凝实验拟合性良好,具有良好的回归性,拟合程度高。总之,用上述4个模型来评价各因素间的交互作用及对去除率的影响是合理、可信的。图7~10依次为不同因素交互影响浊度、UV254、高锰酸盐指数、氨氮的响应曲面图。图7(a)等高线为椭圆状,说明PAC投加量与PAM投加量的交互作用显著;图8(b)中等高线形状偏圆,说明PAM投加量与pH的交互作用不明显;浊度去除率随着助凝剂投加量与pH的增加先升高后降低,原因在于过多的PAM会导致胶体颗粒的再稳定以及会抑制大分子间的架桥作用,进而影响混凝效果。图7(b)、图7(c)中pH的坡度变化较大,表明pH对浊度的去除效果影响较大,原因是不同的pH会影响混凝剂水解产物形态、胶体物质的化学特性。
图8(a) 、图8(b)、图8(c)等高线形状偏圆,表明各因素之间交互作用并不明显。可以看出,UV254去除率的影响权重依次为PAM投加量、PAC投加量、pH。图9(b)、图9(c)等高线为椭圆状,表明PAM投加量分别与PAC投加量、pH的交互作用显著[17]。由图9(b)可以看出,整个曲面变化幅度大。表明PAC投加量对高锰酸盐指数去除率影响显著,去除率呈现先升后降的走势。原因是投入过多的高分子混凝剂会在胶体颗粒表面形成保护膜,电性中和作用被抑制,胶体电荷变为同号,产生胶体保护现象。
图10(c)坡面较陡,说明pH对氨氮的去除影响显著;在偏碱性的条件下,氨氮主要以NH3的形式存在,对氨氮的去除主要是靠吸附作用,由于同时PAM在偏碱性条件下发挥长链优势,形成的大分子物质对胶粒具有较强的吸附作用。
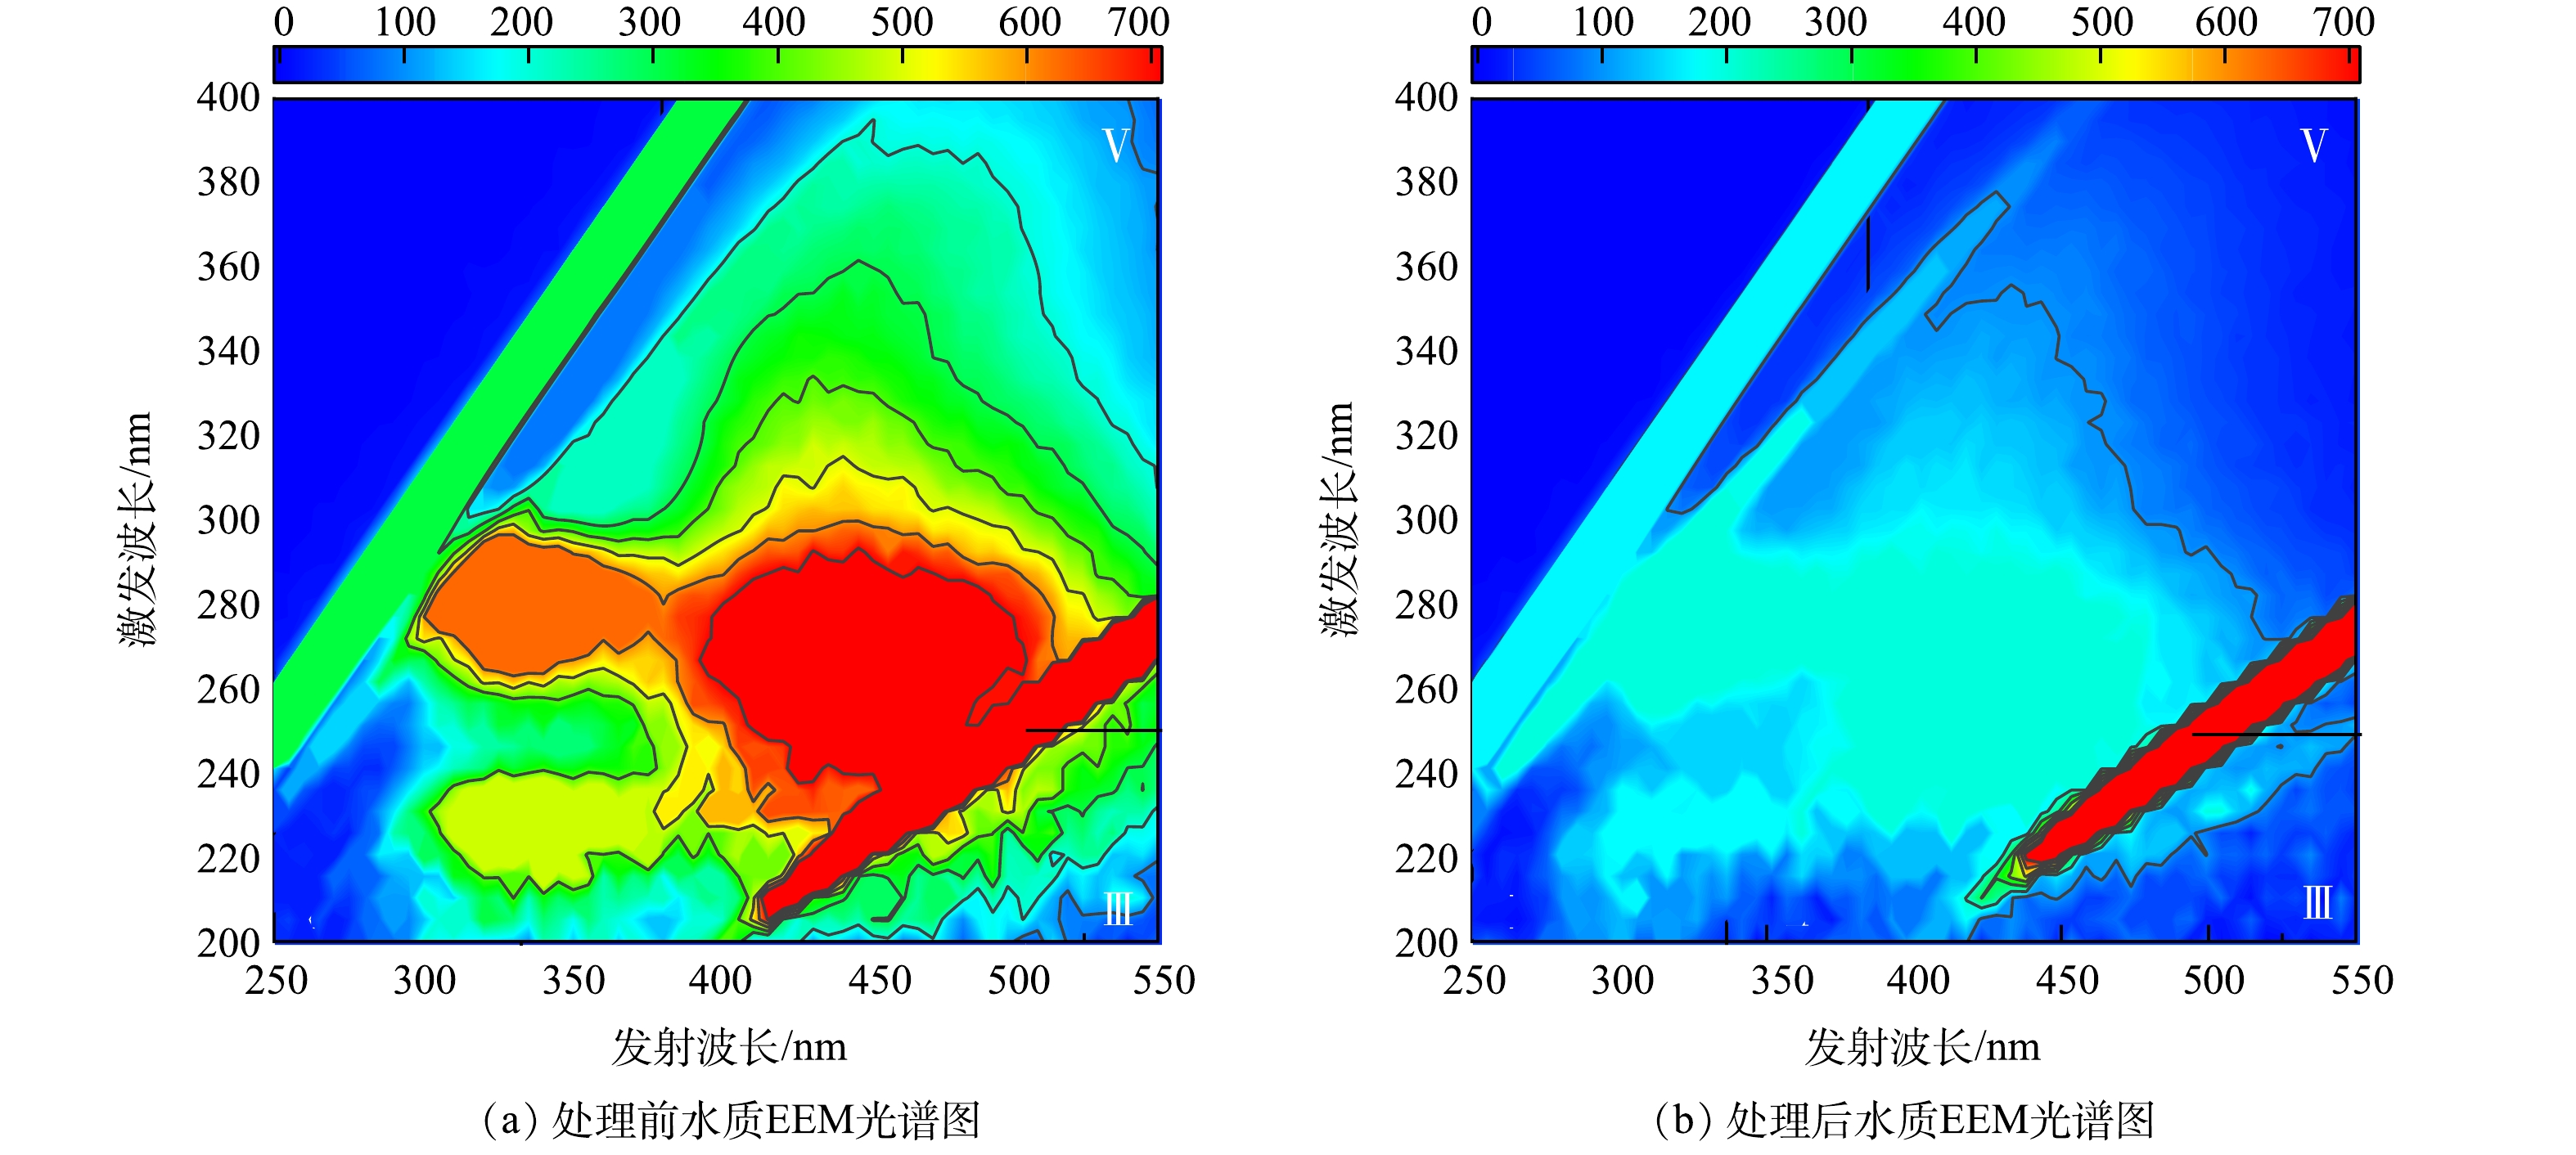
根据响应面的分析结果,得到模型预测最优条件:PAC投加量为52.08 mg·L−1,PAM投加量为0.32 mg·L−1,pH为8.03。通过3次重复性实验验证所得结果,实际浊度去除率为95.8%,高锰酸盐指数去除率为81.1%,氨氮去除率为48.6%,其相对误差分别为1.38%、2.72%、2.33%,拟合度良好。这说明响应曲面法优化混凝条件是可行的,且浊度、高锰酸盐指数、氨氮最终能降低到1.06 NTU、1.13 mg·L−1、0.41 mg·L−1。此外,上清液ζ电位为0.76 mV,接近零电位,表明在该最优条件下,强化混凝完全发挥了电中和能力。由图11可见,代表类富里酸和类腐殖酸的Ⅲ区和Ⅴ区域荧光强度明显减弱,表明有机物的去除程度大。
-
1)在强化混凝的单因素实验中,PAC/PFC投加量、PAM投加量、pH为主要影响因素。通过实验结果对比分析,从效能和经济性分析,PAC优于PFC,PAM优于PDM, 因此,PAC+PAM联用效果优于PAC+PDM。
2)对于浊度的去除率影响显著性为pH>助凝剂投加量>混凝剂投加量;对于有机物的去除率影响显著性为助凝剂投加量<混凝剂投加量<pH;对于氨氮的去除率影响显著性为混凝剂投加量<pH<助凝剂投加量。
3)当PAC投加量为52.08 mg·L−1,PAM投加量为0.32 mg·L−1,pH为8.03时,微污染窖水浊度、高锰酸盐指数、氨氮去除率分别为95.8%、81.1%、48.6%。采用Box-Behnken实验设计方法能增加实验结果的可靠性,优化混凝参数,并能减少实验次数。
响应面法优化混凝处理西北农村水窖水
Coagulation optimization with response surface method for northwest rural area cellar water treatment
-
摘要: 针对西北地区水窖水低温低浊且微污染的水质特点,采用混凝工艺实现水质提升。通过研究混凝剂投量、助凝剂投量、pH等单因素对浊度、高锰酸盐指数、UV254、氨氮去除率的影响,并利用Design-Expert软件对实验数据进行处理,得到二次响应曲面模型各因素间相互作用对响应值的影响,以及其最佳水平。结果表明:采用PAC+PAM的组合处理窖水时,最佳工艺参数PAC投加量为52.08 mg·L−1,PAM投加量为0.32 mg·L−1,pH为8.03时,微污染窖水浊度、高锰酸盐指数、氨氮去除率分别为95.8%、81.1%、48.6%。且在浊度、高锰酸盐指数、氨氮模型中,各因变量的影响程度依次为:pH>助凝剂投加量>混凝剂投加量;助凝剂投加量>混凝剂投加量>pH;混凝剂投加量>pH>助凝剂投加量。通过模型可信度分析证明:响应曲面法用于优化混凝工艺处理水窖水的可行性和有效性,同时也为雨雪水等非常规水源水质的净化提供了技术参考。Abstract: Aiming at the characteristics of low temperature, low turbidity and slight pollution, the water quality of cellar water in northwest China is improved by coagulation process. The influence of coagulant dosage, coagulant aid dosage, pH and other single factors on turbidity, permanganate index, UV254 and ammonia nitrogen removal rate were studied, and the experimental data were processed by using Design-Expert software, then the influence of interaction between various factors of the quadratic response surface model on the response value and its optimal level were obtained. The results showed that when PAC+PAM was used to treat the cellar water, the optimal process parameters were determined as 52.08 mg·L−1 PAC and 0.32 mg·L−1 PAM, and pH 8.03, the turbidity, permanganate index and ammonia nitrogen removal rates in the micro-polluted cellar water were 95.8%, 81.1% and 48.6%, respectively. In turbidity, permanganate index and ammonia nitrogen model, the influence degree of each dependent variable was successively as follows: pH > coagulant dosage > coagulant dosage; Coagulant dosage > coagulant dosage > pH; Coagulant dosage > pH > coagulant aid dosage. The reliability analysis of the model proved that the response surface method (RSM) was feasible and effective in optimizing the coagulation process to treat the cellar water, and also provides a technical reference for the purification of rain, snow water and other unconventional water sources.
-
Key words:
- cellar water /
- micropollution /
- coagulation /
- response surface method /
- unconventional water source
-

-
表 1 模拟窖水水质
Table 1. Simulated cellar water quality
水质参数 pH 浊度/NTU 高锰酸盐指数/
(mg·L−1)UV254/cm−1 氨氮/(mg·L−1) ζ电位/mV 指标值 8.00±0.50 (25.00±5.00) (5.50±0.20) (0.230±0.10) (0.80±0.20) (−25.00±5.00) 标准值 6.5~8.5 ≤3[注] ≤3 — ≤0.5 — 注:水质指标标准值参考《生活饮用水卫生标准》(GB 5749-2006);小型集中式供水和分散式供水因水源与净水技术受限时,浑浊度指标限制按3 NTU执行。 表 2 响应面实验因素及水平设计
Table 2. Factors and levels design of response surface experiments
变量 因素 PAC投加量(X1)/(mg·L−1) PAM投加量(X2)/(mg·L−1) pH(X3) −1 40 0 7 0 50 0.25 8 1 60 0.50 9 表 3 响应实验结果
Table 3. Response surface experimental result
实验序号 X1 X2 X3 Y1 Y2 Y3 Y4 1 40 0 8 89.07 87.18 74.62 45.95 2 60 0 8 92.08 88.45 77.69 49.19 3 40 0.5 8 91.88 88.29 75.92 47.66 4 60 0.5 8 92.28 90.13 78.46 49.46 5 40 0.25 7 85.58 90.13 76.54 46.22 6 60 0.25 7 87.40 91.18 81.08 47.84 7 40 0.25 9 90.18 86.71 78.54 42.97 8 60 0.25 9 92.28 88.29 80.62 45.68 9 50 0 7 85.86 88.18 79.92 45.23 10 50 0.5 7 92.84 88.81 81.69 46.94 11 50 0 9 91.83 87.81 80.69 47.30 12 50 0.5 9 92.36 91.44 82.62 44.95 13 50 0.25 8 96.85 92.57 84.92 49.81 14 50 0.25 8 95.11 91.51 84.82 50.81 15 50 0.25 8 95.75 92.76 85.22 51.03 16 50 0.25 8 95.21 93.22 85.62 50.45 17 50 0.25 8 95.97 94.98 84.12 50.07 表 4 二次回归方程的方差分析-A
Table 4. Analysis of variance of quadratic regression equation-A
来源 自由度 平方和 均方和 浊度 UV254 CODMn 氨氮 浊度 UV254 CODMn 氨氮 模型 9 179.69 75.63 190.78 84.11 19.97 8.40 21.20 9.35 X1 1 6.71 4.09 18.70 10.97 6.71 4.09 18.70 10.97 X2 1 13.84 6.20 4.16 0.228 3 13.84 6.20 4.16 0.228 3 X3 1 27.98 2.04 1.30 3.53 27.98 2.04 1.30 3.53 X1X2 1 1.70 0.084 1 0.072 5 0.519 4 1.70 0.084 1 0.072 5 0.519 4 X1X3 1 0.020 0 0.067 9 1.51 0.292 2 0.020 0 0.067 9 1.51 0.292 2 X2X3 1 10.42 2.25 0.005 9 4.11 10.42 2.25 0.005 9 4.11 X2 1 1 41.91 21.10 111.86 8.24 41.91 21.10 111.86 8.24 X2 2 1 7.05 21.46 40.88 3.97 7.05 21.46 40.88 3.97 X2 3 1 59.62 12.06 1.50 47.50 59.62 12.06 1.50 47.50 残差 7 6.51 15.86 1.68 5.71 0.929 9 2.27 0.240 3 0.815 1 失拟项 3 4.55 9.47 0.454 1 4.69 1.52 3.16 0.151 4 1.56 纯误差 4 1.96 6.40 1.23 1.01 0.489 9 1.60 0.307 0 0.253 2 总离差 16 186.20 91.50 192.46 89.82 表 5 二次回归方程的方差分析-B
Table 5. Analysis of variance of quadratic regression equation-B
来源 F值 P值 浊度 UV254 CODMn 氨氮 浊度 UV254 CODMn 氨氮 模型 21.47 3.71 88.21 11.47 0.000 3 0.049 0 < 0.000 1 0.002 0 X1 7.22 1.81 77.81 13.46 0.031 2 0.220 9 < 0.000 1 0.008 0 X2 14.88 2.74 17.31 0.280 0 0.006 2 0.142 1 0.004 2 0.613 0 X3 30.09 0.901 1 5.43 4.33 0.000 9 0.374 1 0.052 6 0.075 9 X1X2 1.83 0.037 1 0.301 6 0.637 2 0.218 6 0.852 8 0.599 9 0.450 9 X1X3 0.021 6 0.029 9 6.30 0.358 4 0.887 4 0.867 5 0.040 4 0.568 2 X2X3 11.21 0.992 9 0.024 6 5.04 0.012 3 0.352 2 0.879 7 0.059 6 X2 1 45.07 9.31 465.48 10.11 0.000 3 0.018 5 < 0.000 1 0.015 5 X2 2 7.58 9.47 170.10 4.87 0.028 3 0.017 9 < 0.000 1 0.063 0 X2 3 64.11 5.32 6.24 58.27 < 0.000 1 0.054 4 0.041 2 0.000 1 失拟项 3.10 1.97 0.493 1 6.18 0.151 8 0.260 1 0.706 1 0.055 5 纯误差 21.47 3.71 88.21 11.47 总离差 7.22 1.81 77.81 89.82 表 6 响应模型可信度分析
Table 6. Credibility analysis of response model
-
[1] 刘建林, 张国珍, 杨浩, 等. 不同材质水窖储水水质及其变化规律实验研究[J]. 干旱区资源与环境, 2012, 26(3): 101-104. [2] 李潇潇, 张跃军, 赵晓蕾, 等. PAC/PDMDAAC复合混凝剂用于冬季太湖水强化混凝工艺中试放大研究[J]. 应用基础与工程科学学报, 2016, 24(1): 157-167. [3] 伍彬, 李一平, 王海英, 等. 预氧化-混凝处理高浑浊度高氨氮水的试验研究[J]. 净水技术, 2022, 41(S1): 28-33. [4] 张国珍, 尹振珑, 武福平. 臭氧强化BAF工艺处理微污染窖水[J]. 环境工程学报, 2017, 11(6): 3405-3411. [5] 闵芮, 马凯, 任豪, 等. 混凝-氯/紫外高级氧化与双膜工艺联用处理微污染窖水[J]. 兰州交通大学学报, 2022, 41(4): 89-95. [6] 郭译文, 武福平, 张国珍. 微污染窖水处理中混凝剂筛选的实验研究[J]. 绿色科技, 2018, 6(3): 5-8. [7] 夏玮, 张蕊, 吴根宇, 等. 微污染源水的混凝处理及絮体粒径研究[J]. 土木与环境工程学报(中英文), 2020, 42(4): 185-193. [8] 王刚, 王馨, 宋小三, 等. 响应曲面法中BBD和CCD在优化巯基乙酰化壳聚糖制备条件中的比较[J]. 环境工程学报, 2018, 12(9): 2502-2511. [9] 信晓飞, 张晋霞, 冯洪均. 响应曲面法优化含锌尘泥选择性浸出工艺[J]. 矿产综合利用, 2021(2): 146-151. [10] 高连敬, 杜尔登, 崔旭峰, 等. 三维荧光结合荧光区域积分法评估净水厂有机物去除效果[J]. 给水排水, 2012, 48(10): 51-56. [11] 国家环境保护总局. 水和废水监测分析方法[M]. 4版. 北京: 中国环境科学出版社, 2002. [12] 王珊, 张克峰, 任杰. 低温低浊进水条件下壳聚糖助滤效果研究[J]. 工业水处理, 2019, 39(2): 58-61. [13] 袁辉洲, 柯水洲, 涂家勇, 等. pH对聚合铝形态分布与混凝效果的影响[J]. 工业水处理, 2016, 36(4): 50-53. doi: 10.11894/1005-829x.2016.36(4).012 [14] 谭丽泉, 胡相红, 余梅, 等. 聚二甲基二烯丙基氯化铵改性油页岩灰渣吸附水中Cr(Ⅵ)[J]. 水处理技术, 2018, 44(10): 71-74. doi: 10.16796/j.cnki.1000-3770.2018.10.015 [15] OLUKOWI O M, XIE Y, ZHOU Z, et al. Performance improvement and mechanism of composite PAC/PDMDAAC coagulant via enhanced coagulation coupled with rapid sand filtration in the treatment of micro-polluted surface water[J]. Journal of Environmental Chemical Engineering, 2022, 10(5): 108450. doi: 10.1016/j.jece.2022.108450 [16] KUTLUAY S, ECE M Ş, ŞAHİN Ö. Synthesis of magnetic Fe3O4/AC nanoparticles and its application for the removal of gas-phase toluene by adsorption process[J]. International Journal of Chemistry and Technology, 2020, 4(2): 146-155. doi: 10.32571/ijct.755732 [17] LI P, ZHOU L, MOU Y, et al. Extraction optimization of polysaccharide from Zanthoxylum bungeanum using RSM and its antioxidant activity[J]. International Journal of Biological Macromolecules, 2015, 72: 19-27. doi: 10.1016/j.ijbiomac.2014.07.057 -


 下载:
下载:
