-
流域面源污染威胁着水环境安全[1],因其具有随机性、滞后性、广泛性和难监测性[2]等特点,使得其治理逐渐成为水环境保护与水资源利用中的重点和难点[3]。对于种植和畜禽养殖污染、农村生活污染等,可首选资源化利用,并结合水肥一体化、测土配方施肥、粪污水肥料化利用技术等农业技术措施和低影响开发技术措施,最大限度地从源头减少面源污染的排放。因此,面源污染控制的关键和热点逐渐集中在减少污染物入河方面的研究[4-7]。位于水陆群落交错区的河流生态缓冲带(后简称“缓冲带”)可截留阻控面源污染物向水体中迁移,是控制面源污染和改善水环境的有效措施之一[8-11]。在缓冲带的设计和建设过程中,应充分考虑河流沿岸面源污染的空间差异性,结合污染物入河负荷等级做出有针对性的、切实可行的植物修复方案,最大程度地发挥其生态效益、社会效益和经济效益[6]。目前,国内外学者的研究多聚焦于缓冲带的结构特征、植被配置、阻控机理及截污能力等方面[11-15],而考虑河流沿岸面源污染空间差异性的缓冲带重点区域识别研究尚鲜见报道。
结合面源污染空间差异识别缓冲带重点区域,是有效控制面源污染和改善河流水环境的重要途径。其中,模型模拟是流域面源污染负荷估算的主流手段,国内外学者多采用SWAT模型[16]、输出系数模型[17]、AnnAGNPS模型[18]、HSPF模型[19]等开展面源污染负荷估算研究,但不同模型的适用条件会受到流域特征和输入数据的限制[20]。遥感分布式面源污染评估模型(diffuse pollution estimation with remote sensing,DPeRS)在模型架构、运行条件和模拟指标等方面具有较大的管理应用优势[21]。DPeRS模型以栅格像元为模拟单元,与SWAT模型的水文响应单元(hydrological response unit,HRU)相比,在确保模型模拟精度的前提下大幅提升了流域面源污染模拟的空间分辨率[22],实现了像元尺度的面源污染负荷空间可视化,直观体现了面源污染重点防控区。
本研究以浦阳江流域(浦江县段)作为研究区,采用DPeRS面源污染评估模型对流域总氮(TN)、总磷(TP)、氨氮(NH4+-N) 和化学需氧量(COD)等面源污染指标的排放负荷进行了空间估算,分析了流域面源污染的空间分布特征,结合空间入河系数估算了浦阳江流域面源污染入河量,并采用面向对象的方法提取了水域岸线和缓冲带土地覆盖类型,以汇水区为单元,结合面源污染估算结果识别了浦阳江流域缓冲带重点区,以期为管理部门和相关机构有针对性地设计及建设缓冲带防护工程提供参考。
-
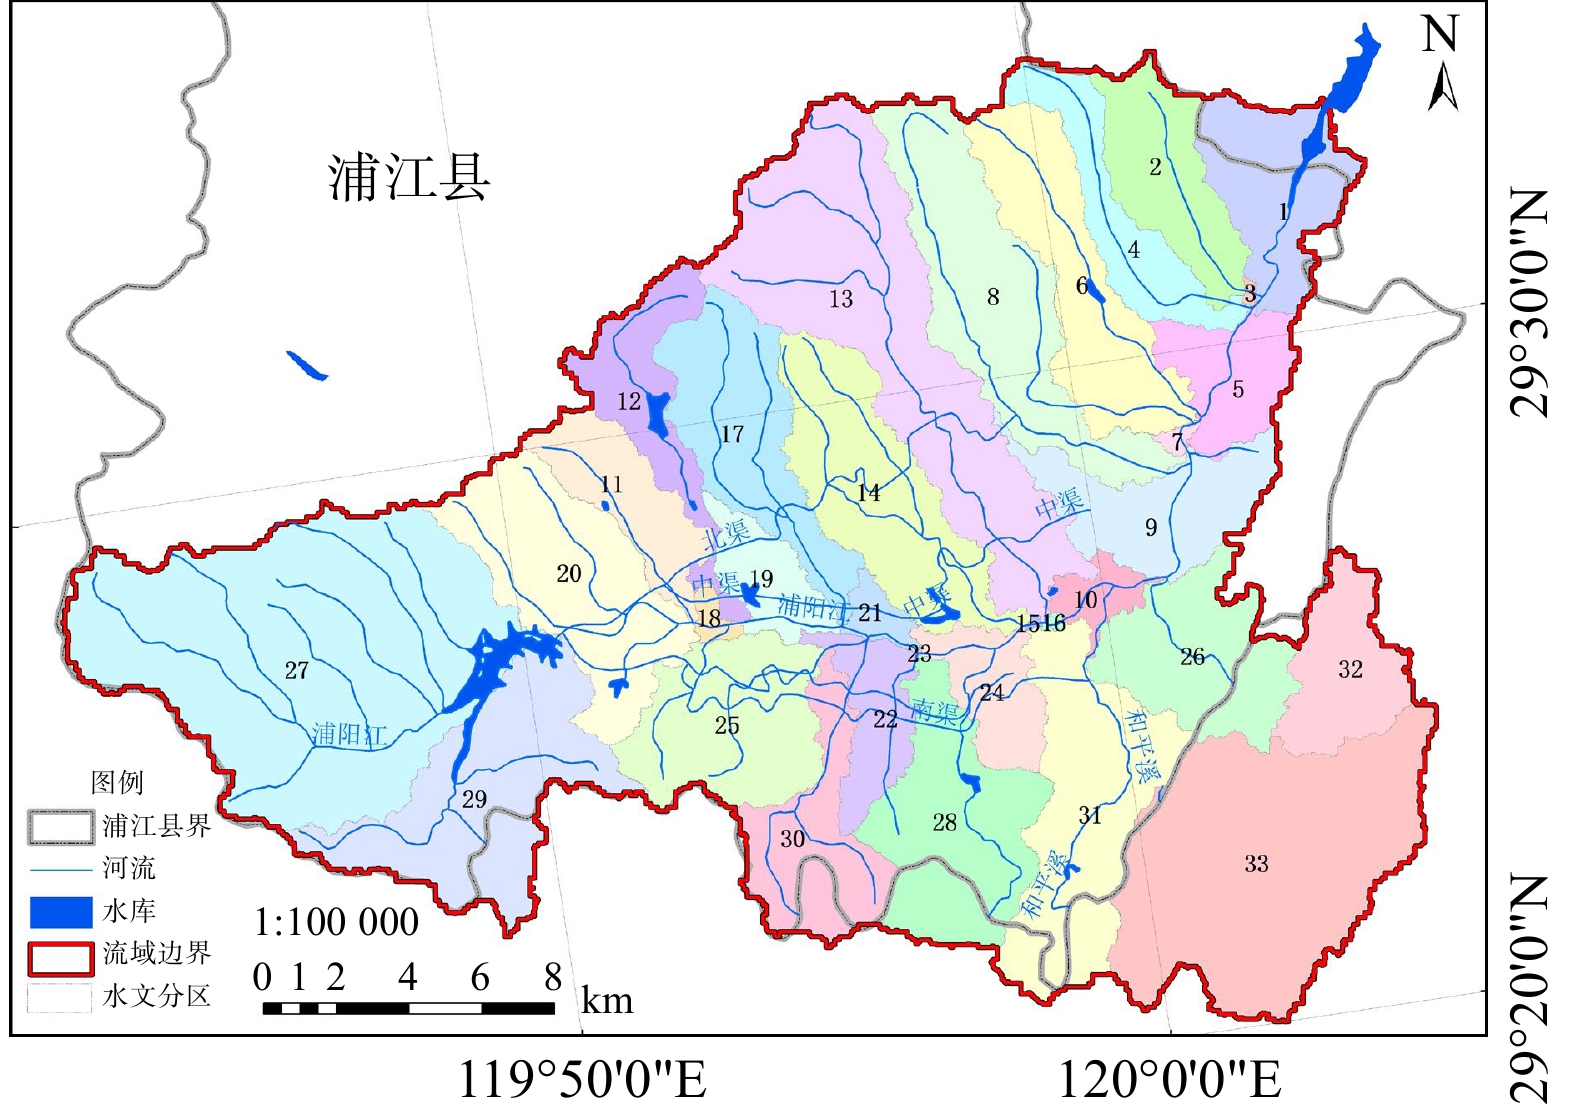
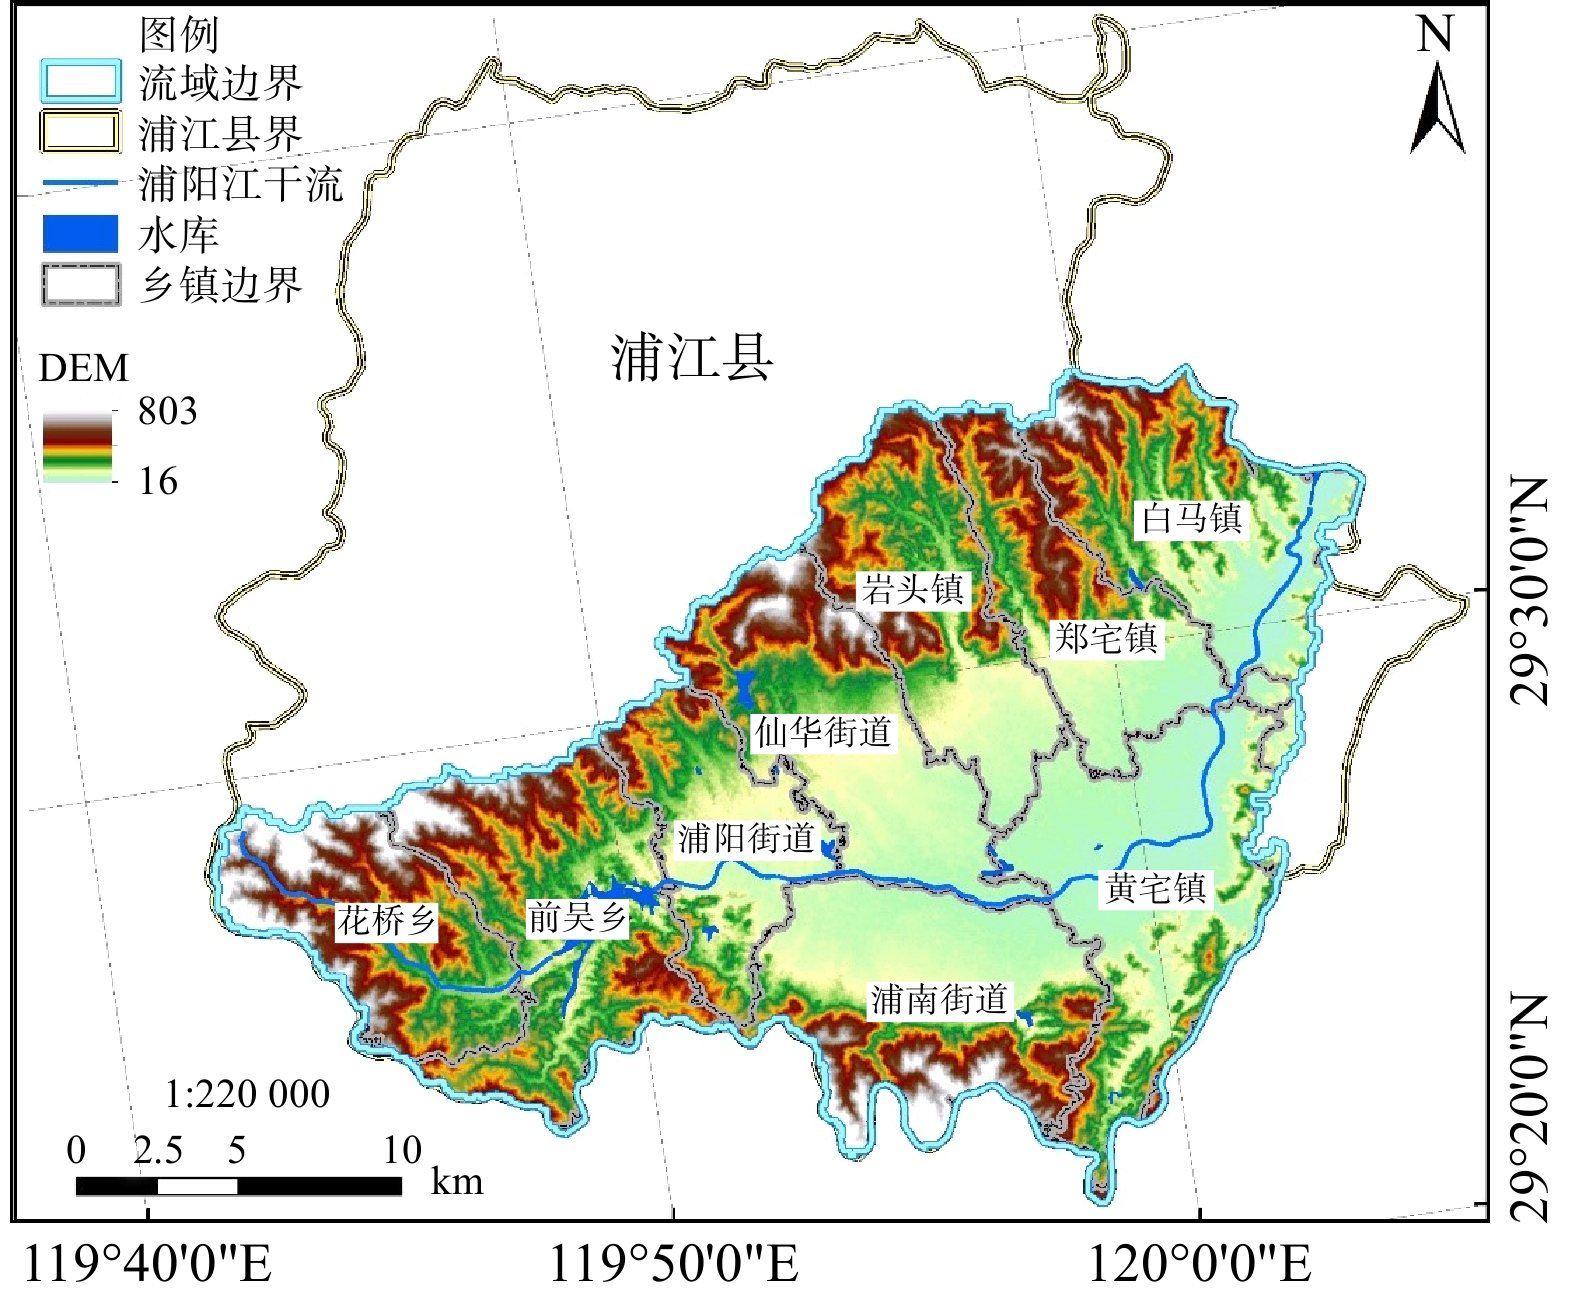
浦江县位于浙江省金华市,县域面积920 km2,属亚热带季风气候区。该县地势西北高、东南低;地形以低山丘陵为主,占总面积81.66%,河谷盆地仅占18.34%;年平均气温16.8 ℃;年平均降水量1 470.4 mm。浦江县雨量充沛,但季节分布不均匀。其中,春夏两季(3—9月)降水量占全年76%,梅汛期降水量(5—7月上旬)可达484.8 mm,接近全年的1/3。该地区年平均相对湿度79%,年平均蒸发量为1 306.3 mm。浦阳江为浦江县最大水系,属钱塘江一级支流,发源于浦江县花桥乡高塘村天灵岩南麓,经白马镇塘里村流出浦江县境,后流入诸暨市的安华水库,至杭州市萧山区闻家堰汇入钱塘江,主干流长49.61 km,干支流总长度312.44 km,流域面积492.62 km2。浦江县浦阳江流域地理位置见图1。
浦江县浦阳江流域境内土壤类型主要包括红壤、黄壤、水稻土、紫色土和粗骨土等。红壤为县域地带性土壤,广泛分布于山地、丘陵和缓坡岗地;黄壤为垂直地带性土壤,分布于海拔600 m以上山地;在红壤和黄壤分布的地带镶嵌有紫色土和粗骨土等初育土壤;水稻土分布于水热条件较优的浦江盆地和山间谷地。浦江县种植的作物主要有水稻、油料、棉花、蔬菜等,茶果类主要有葡萄、梨、柑桔、茶叶等,畜禽主要以猪、羊和禽类为主。
-
采用DPeRS面源污染模型[22]开展浦阳江流域(浦江县段)面源污染解析与负荷估算,结合河岸缓冲带现状遥感解译结果、地形和汇水区分布,进一步识别浦阳江河岸缓冲带重点区。
1)基于ArcGIS的河网子流域提取方法。本研究采用ArcGIS的水文分析模块进行汇水区提取。基于流域DEM数据,在软件中进行自动汇点填洼,通过地理坡度、坡向计算,生成完整的流域河网水系;结合河流分布数据,进行汇流累积计算,生成流域内主要河道及相应的河流结点;参考流域水文历史数据资料,对河流结点进行筛选优化(增补或剔除),并结合遥感影像图、断面信息等,形成满足研究需求的汇水区。
2)基于遥感技术的面源污染负荷模型方法。DPeRS模型是基于二元结构原理构建的遥感分布模型,空间计算单元为影像栅格,模型参数考虑流域水文特征、土地利用和土壤特征等综合确定,可实现流域面源污染负荷的像元尺度估算。该模型可概括为农田径流、畜禽养殖、农村生活、城镇生活和水土流失5个类型,溶解态和颗粒态2种元素形态,模拟指标包括TN、TP、
${\rm{NH}}_4^{+} $ -N和COD。DPeRS模型系统包括农田氮磷平衡量估算模块、植被覆盖度反演模块、溶解态面源污染负荷估算模块、颗粒态面源污染负荷估算模块和面源污染入河量估算模块[20-24],模型核心算法见表1,参数说明见表2。3)基于面向对象的水域岸线提取和缓冲带土地覆盖类型的分类方法。本研究基于高分二号(GF-2)影像数据,借助归一化水体指数(normalized differential water index,NDWI),使用面向对象的方法对影像进行分割,结合河流水面的影像特征,提取河流水面;进一步使用边缘检测的方法,得出河岸线初步范围,再进行填充与平滑,得到河岸线分布,设置合适的缓冲区数值(考虑到200 m范围内河岸带的直接影响作用较大,向河岸两侧各扩展200 m),以构建缓冲带。利用GF-2/PMS融合后的1 m分辨率多光谱遥感数据,采用面向对象方法,结合典型地物的纹理特征和光谱信息,设定最优特征阈值,对缓冲带内的土地覆盖类别进行逐一提取,具体包括耕地、林地、草地、道路、房屋、水体等类别。其中,面向对象方法的关键是模块化分割,本研究采用K-means聚类的分割方法。
-
DPeRS模型的输入数据具体包括浦阳江流域(浦江县段)的遥感数据(土地利用和月植被覆盖度分布)、月降水量空间数据、土壤空间数据(土壤类型及氮磷含量)、地形数据(坡度坡长)和农田氮磷平衡数据等。所有数据均统一转换为空间分辨率为10 m的栅格数据,具体数据来源和处理方法见表3。对2018年浦阳江流域(浦江县段)GF-2/PMS影像(1 m全色、4 m多光谱)进行几何纠正、数据融合等预处理后,采用面向对象的方法,进行浦阳江水域岸线提取和缓冲带土地覆盖类型划分。
为保证模型模拟结果的精度,避免有条带的遥感数据参与数据处理,要求遥感影像云层覆盖不超过10%,遥感数据几何位置配准精度在一个像元之内。核算农田氮磷平衡量的农业统计指标数据通过查阅《浦江年鉴2018》,结合实地调查和问访,进行数据填写和校核,以保证数据精度。
-
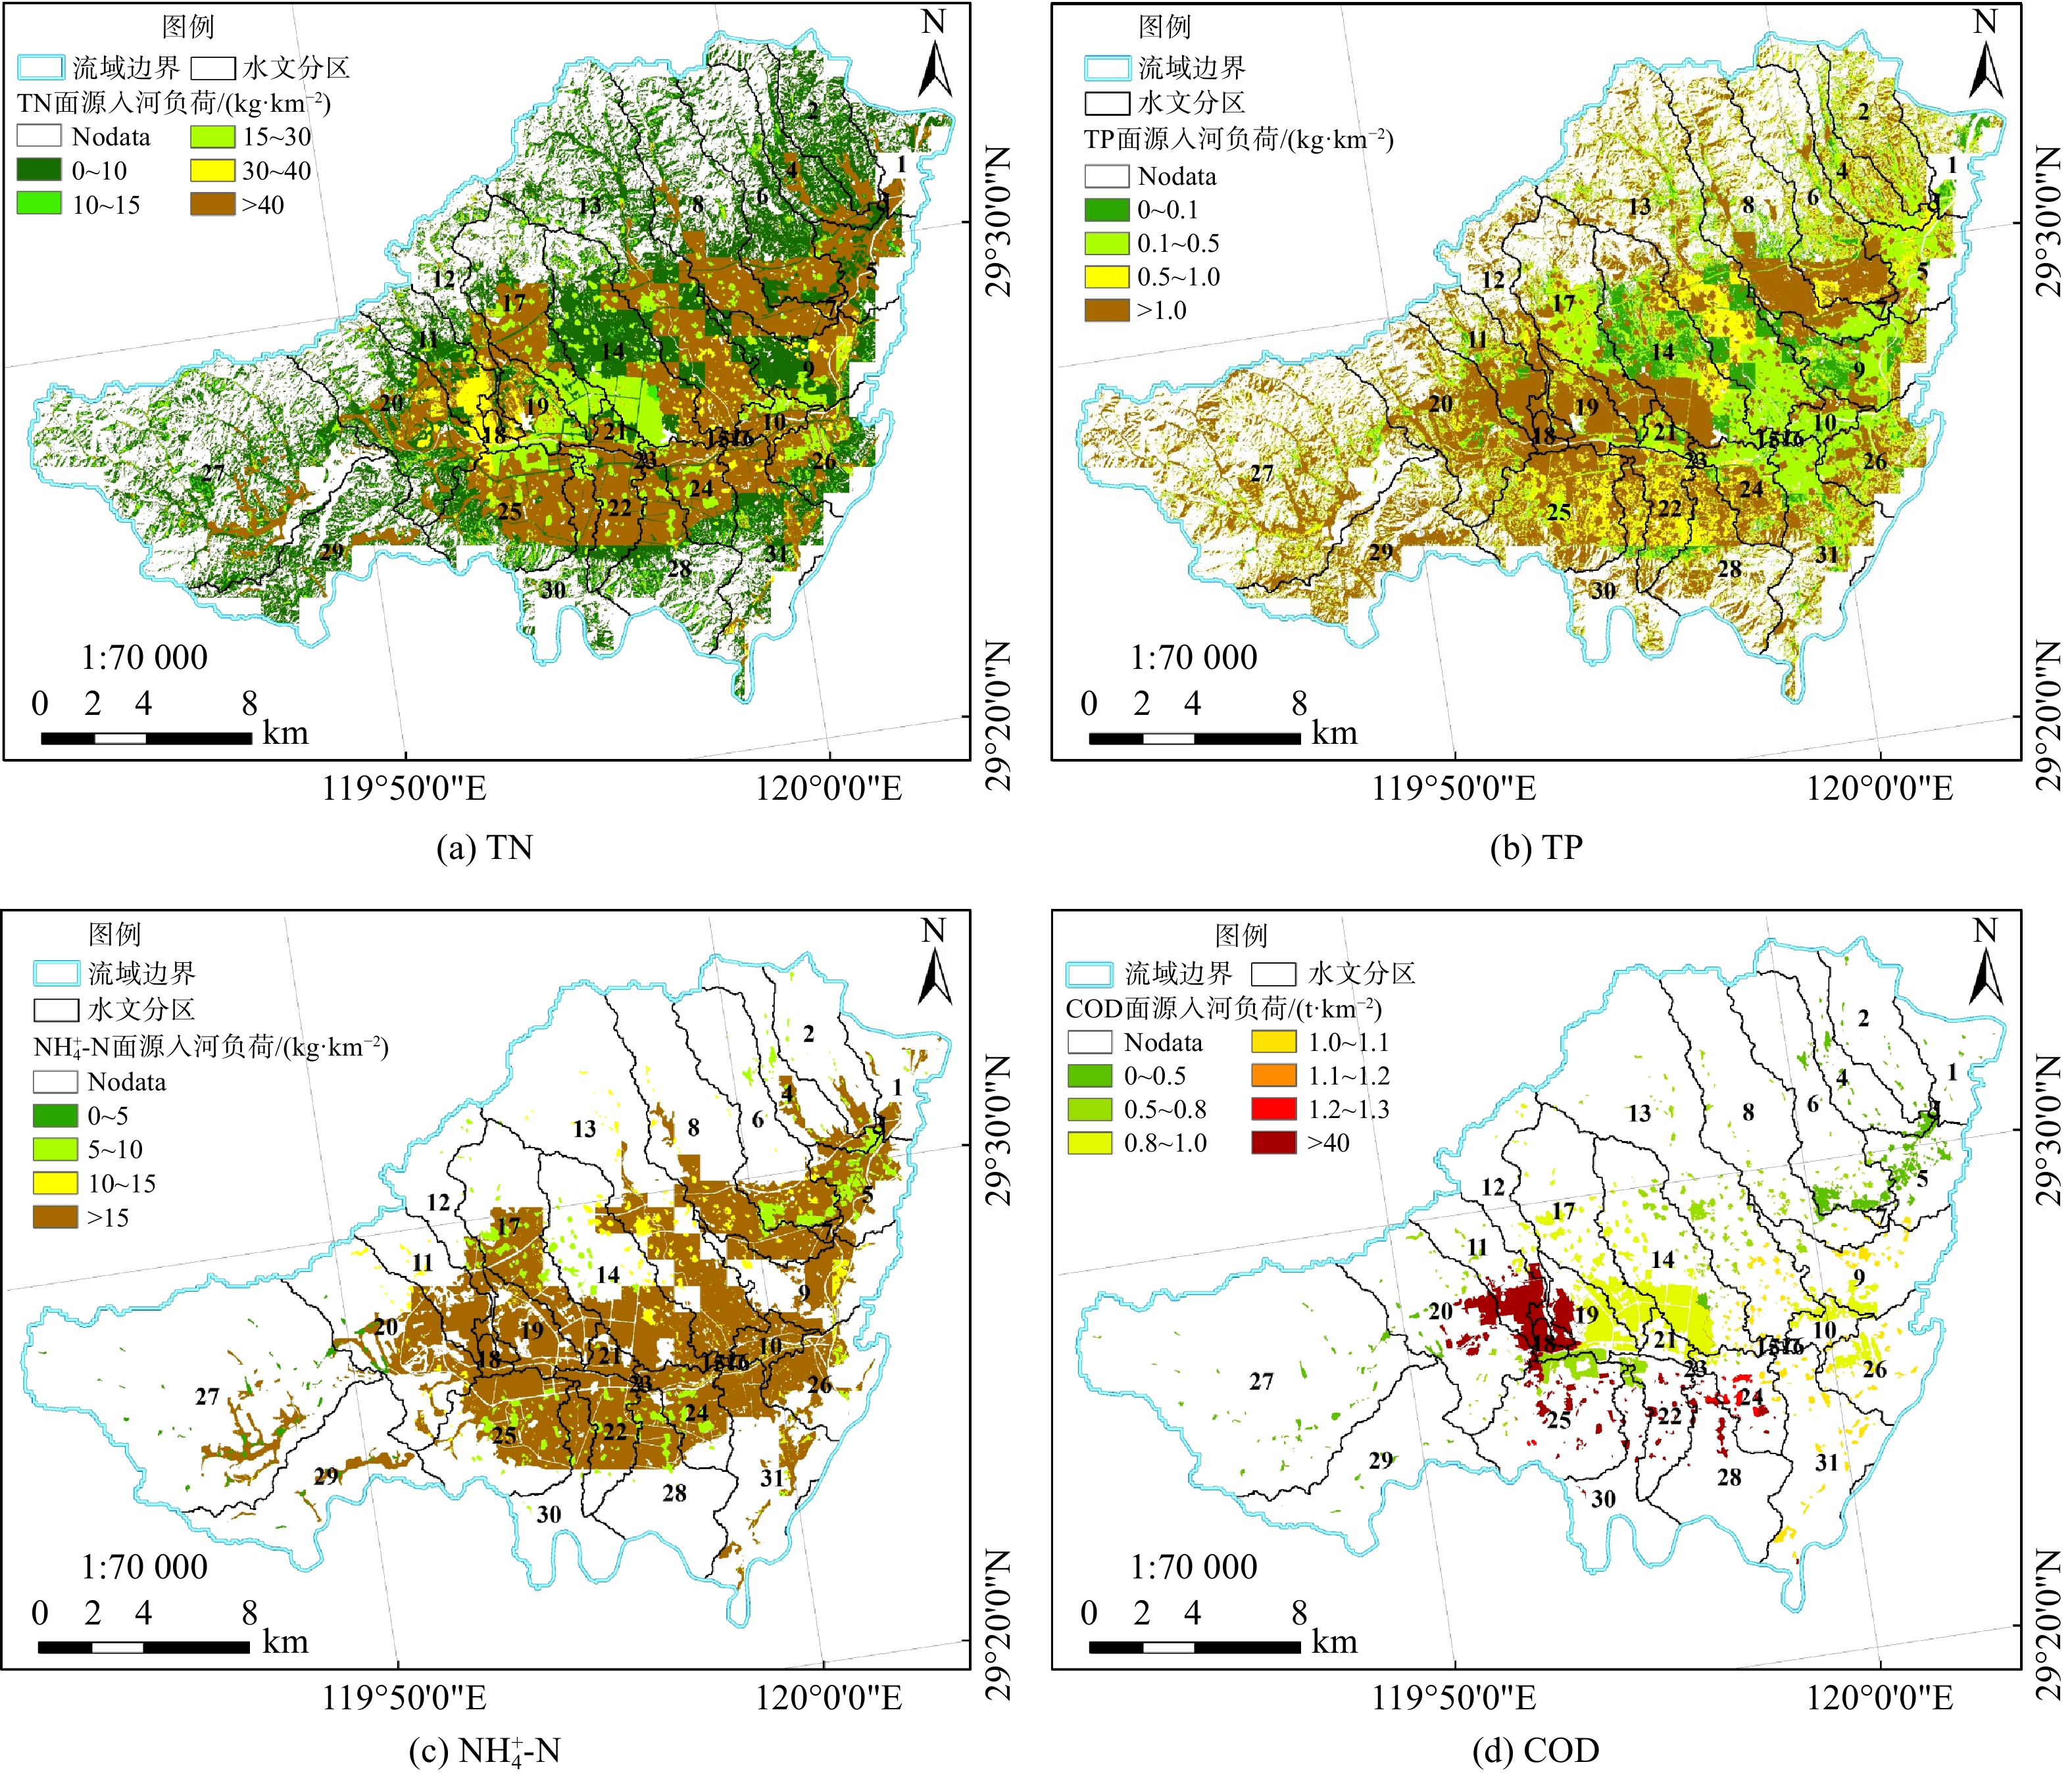
采用DPeRS模型对浦阳江流域(浦江县段)2018年面源污染排放负荷进行了空间估算,结果见图2。浦阳江流域(浦江县段)的中部和中北部地区面源污染排放负荷较高。其中,TN和
${\rm{NH}}_4^{+} $ -N高负荷区主要分布在农田地带,郑宅镇最为突出;TP高负荷区主要集中在浦阳和仙华街道,花桥乡和前吴乡零散分布;COD高负荷区集中分布于城区的浦阳街道和浦南街道。2018年,浦阳江流域各项面源污染指标(TN、TP、${\rm{NH}}_4^{+} $ -N和COD)的排放负荷分别为0.08、0.002、0.03和0.17 t·km−2,排放量分别为37.52、0.89、15.34和80.07 t。 -
采用ArcGIS水文分析模块提取的浦阳江流域汇水区分布如图3所示。全流域共划分了33个汇水区,浦江县境内共计31个汇水区。基于浦阳江流域(浦江县段)2018年各指标面源污染排放负荷和空间入河系数,采用DPeRS模型入河模块,核算了2018年浦阳江流域面源污染入河负荷,叠合汇水区后的空间分布状况如图4所示。面源污染入河负荷高值区主要集中于中下游地区。2018年浦阳江流域面源污染4个指标(TN、TP、
${\rm{NH}}_4^{+} $ -N和COD)的入河负荷分别为0.04、0.001、0.015和0.08 t·km−2,入河量分别为18.12、0.48、7.34和38.30 t。 -
对2018年浦阳江流域(浦江县段)农田径流、畜禽养殖、农村生活、城镇生活和水土流失5种污染源的面源污染产排量进行了空间统计分析,结果见表4。对于TN和
${\rm{NH}}_4^{+} $ -N指标,农田径流是主要面源污染源,分别占总污染量的90.7%和87.4%;对于TP指标,水土流失是首要面源污染源,占总污染量56.6%,其次是农田径流;对于COD指标,城镇生活是主要面源污染源,占总污染量的64.1%。 -
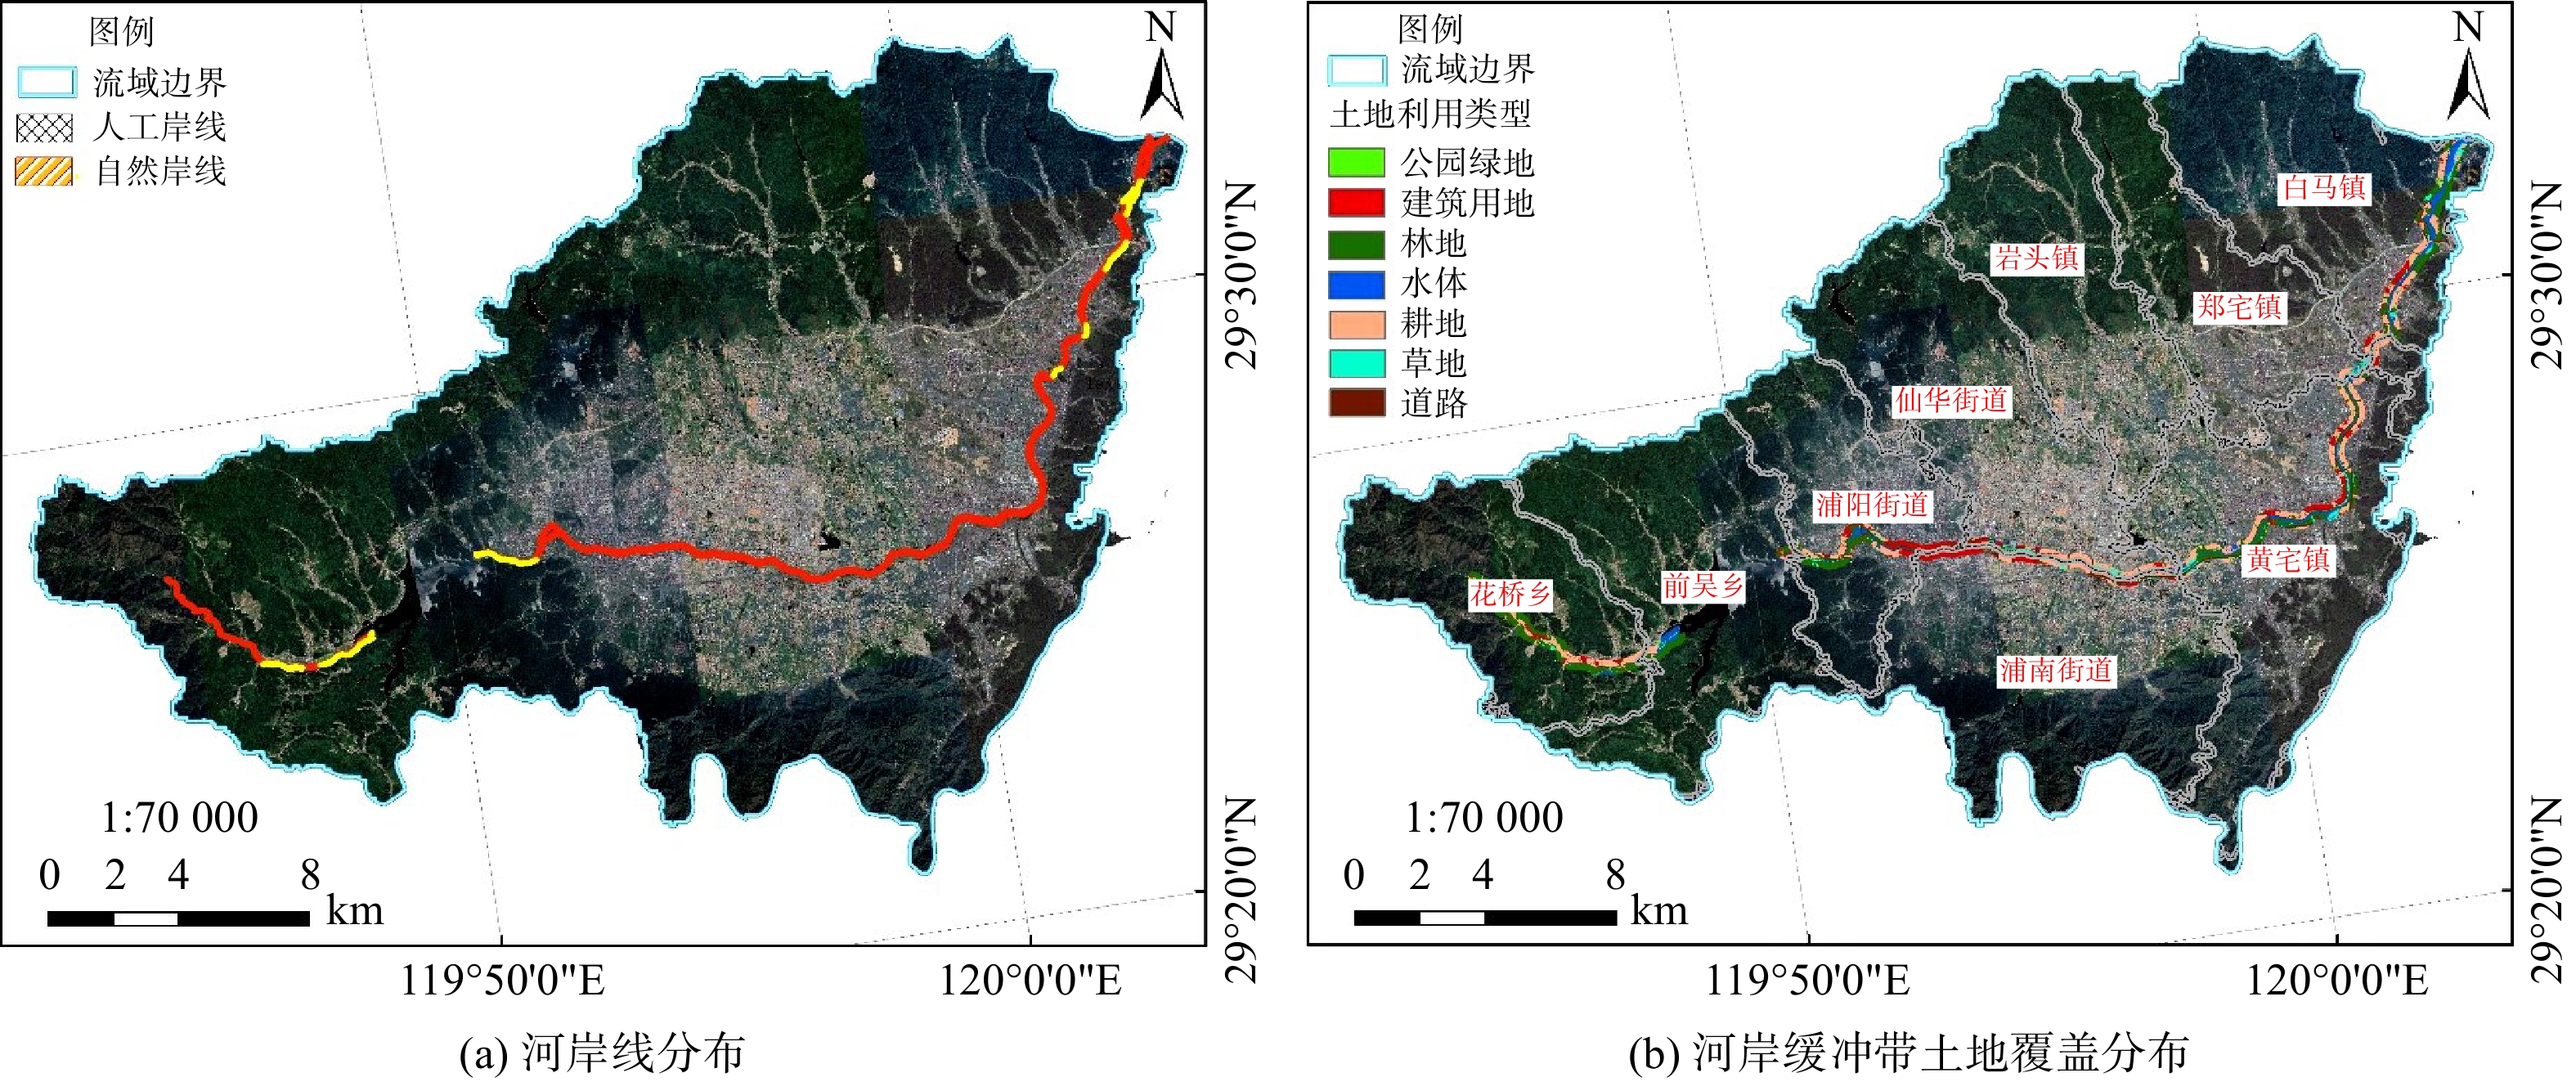
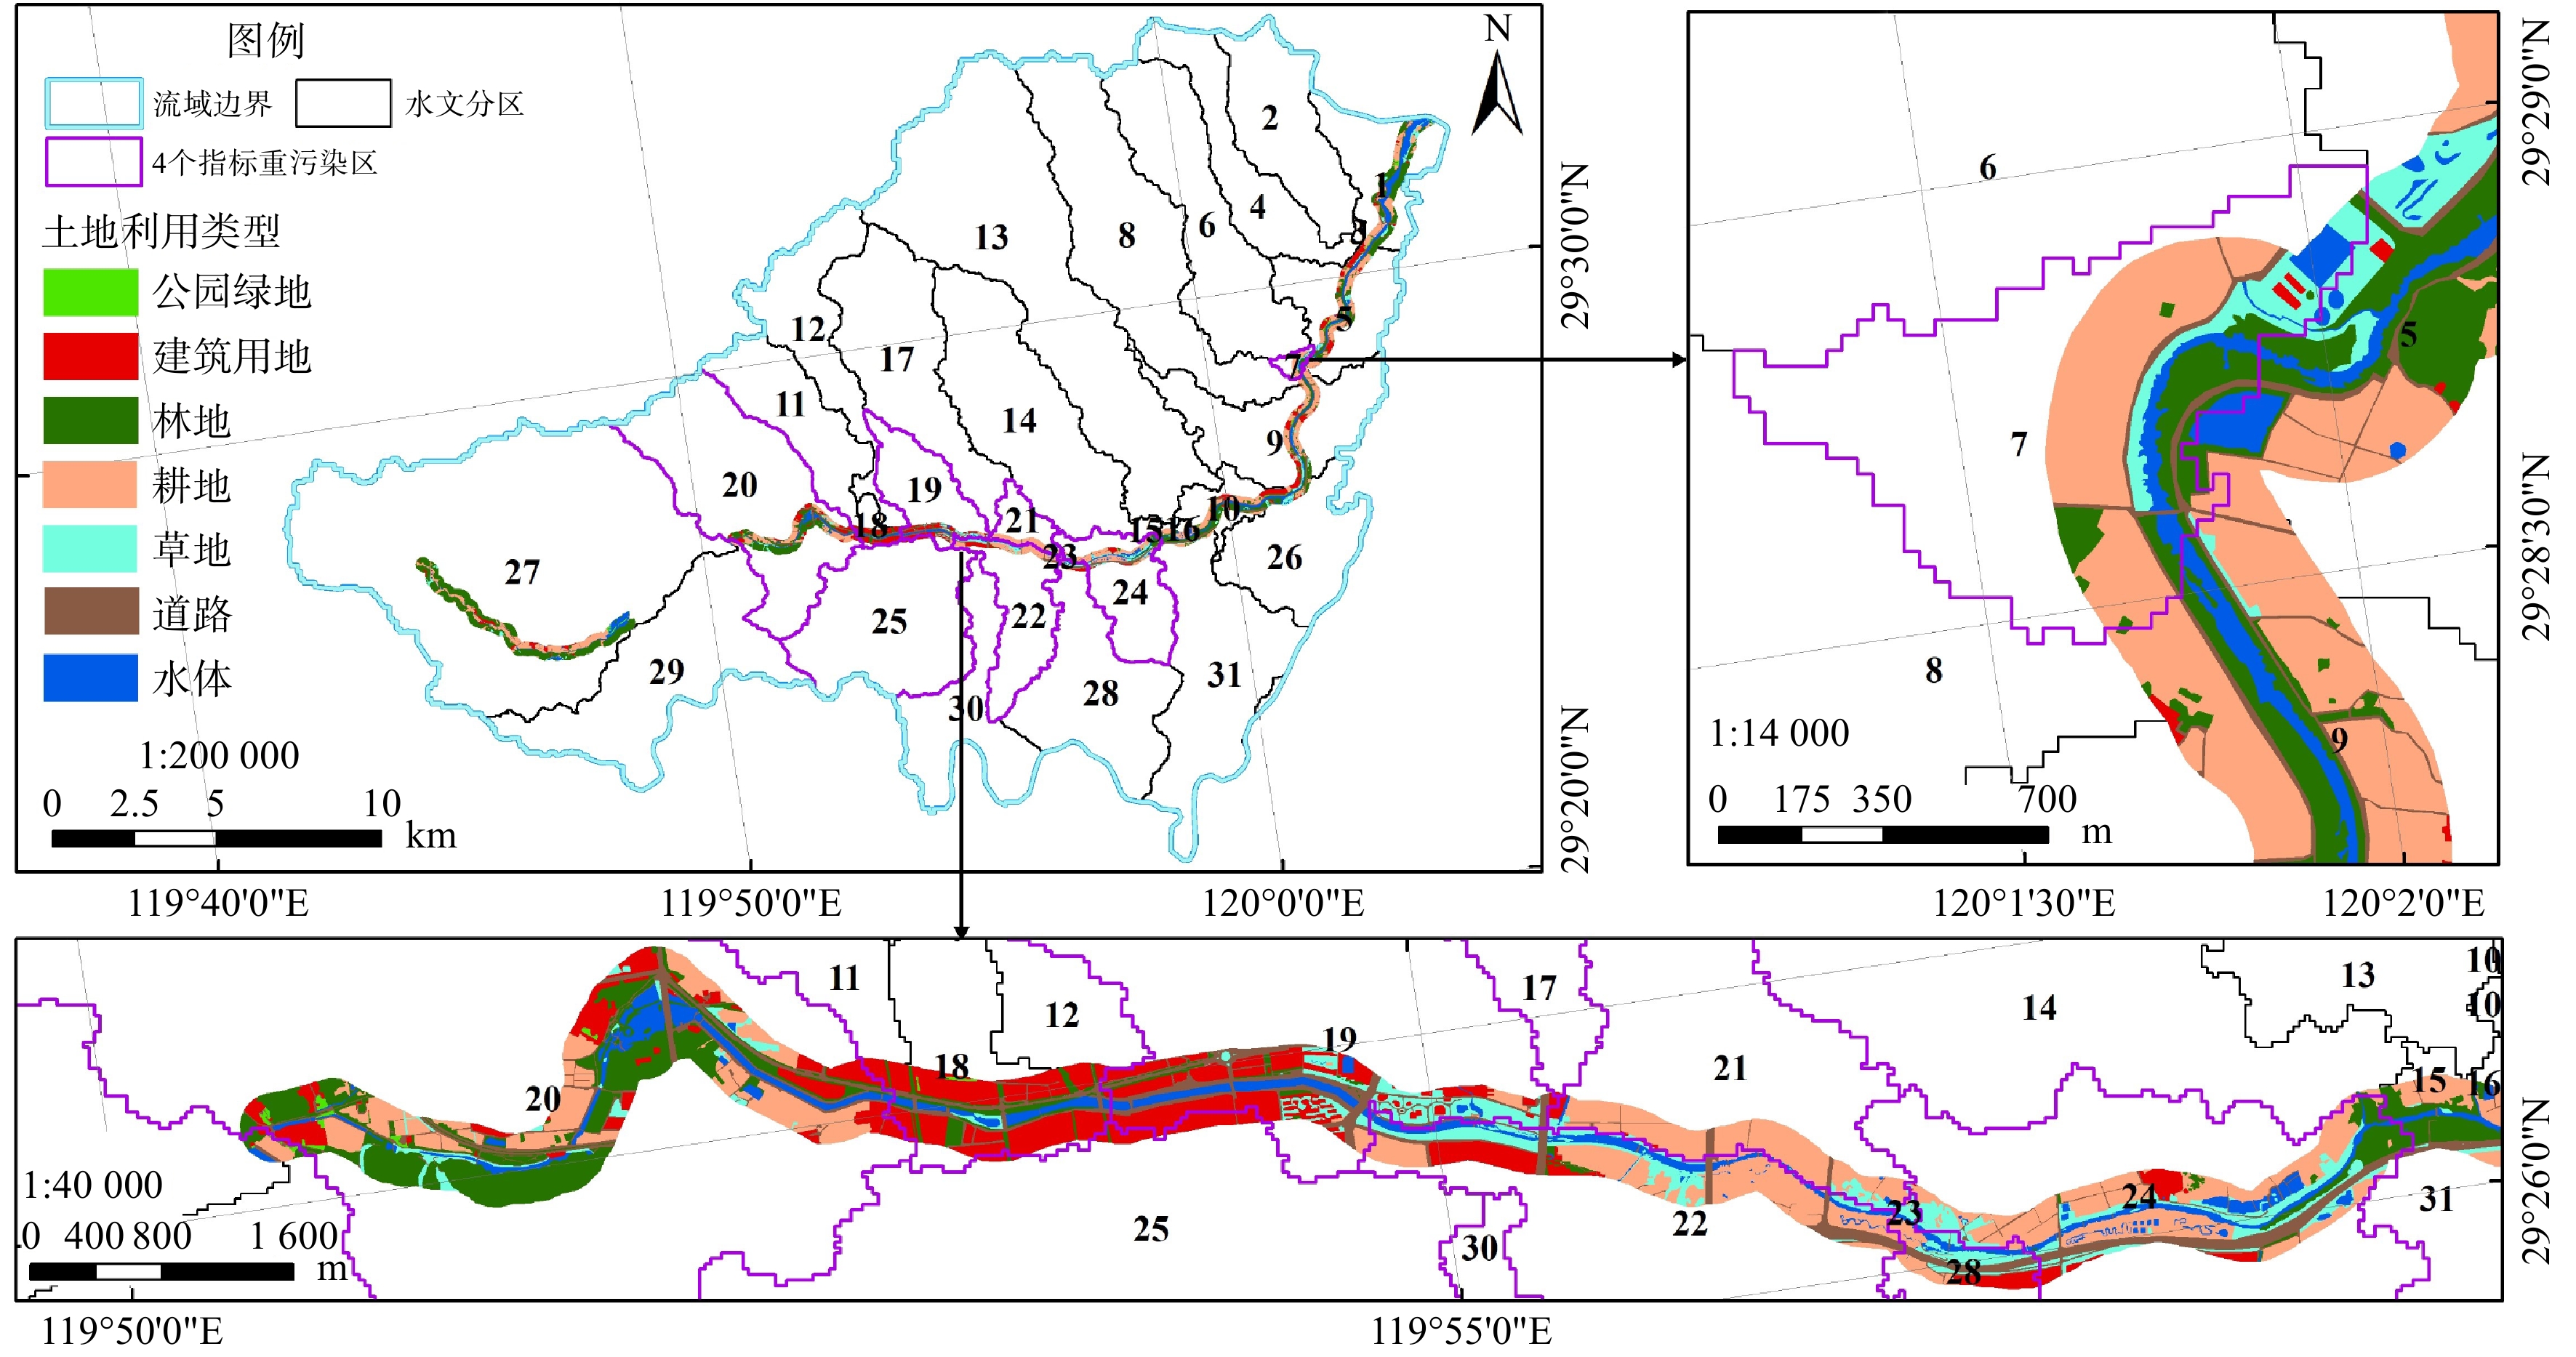
基于2018年浦阳江流域(浦江县段)GF-2/PMS影像,采用面向对象分割法提取的岸线如图5(a)所示。浦阳江岸线总长度为89.37 km。其中,自然岸线长度9.39 km,占岸线总长度的10.5%;人工岸线总长度89.37 km,占岸线总长度的89.5%。考虑到200 m范围内河岸带的直接影响作用较大,因此,沿岸线两侧扩充200 m,经空间统计得到浦阳江缓冲带的总面积为19.27 km²。采用面向对象方法对浦阳江流域缓冲带进行了土地覆盖分类提取。在缓冲带范围内,耕地和林地的面积占比相对较高,分别为29.36%和28.21%;其次是水体和建筑用地,面积占比分别为12.84%和11.89%。植被类型(包括耕地、林地、草地和公园绿地)区域的总面积为12.62 km²,占缓冲带总面积的65.49%;非植被类型(包括水体、建筑用地和道路)区域的总面积为6.65 km²,占缓冲带总面积的34.51%。浦阳江缓冲带土地覆盖空间分布见图5(b),分类面积统计信息见表5。
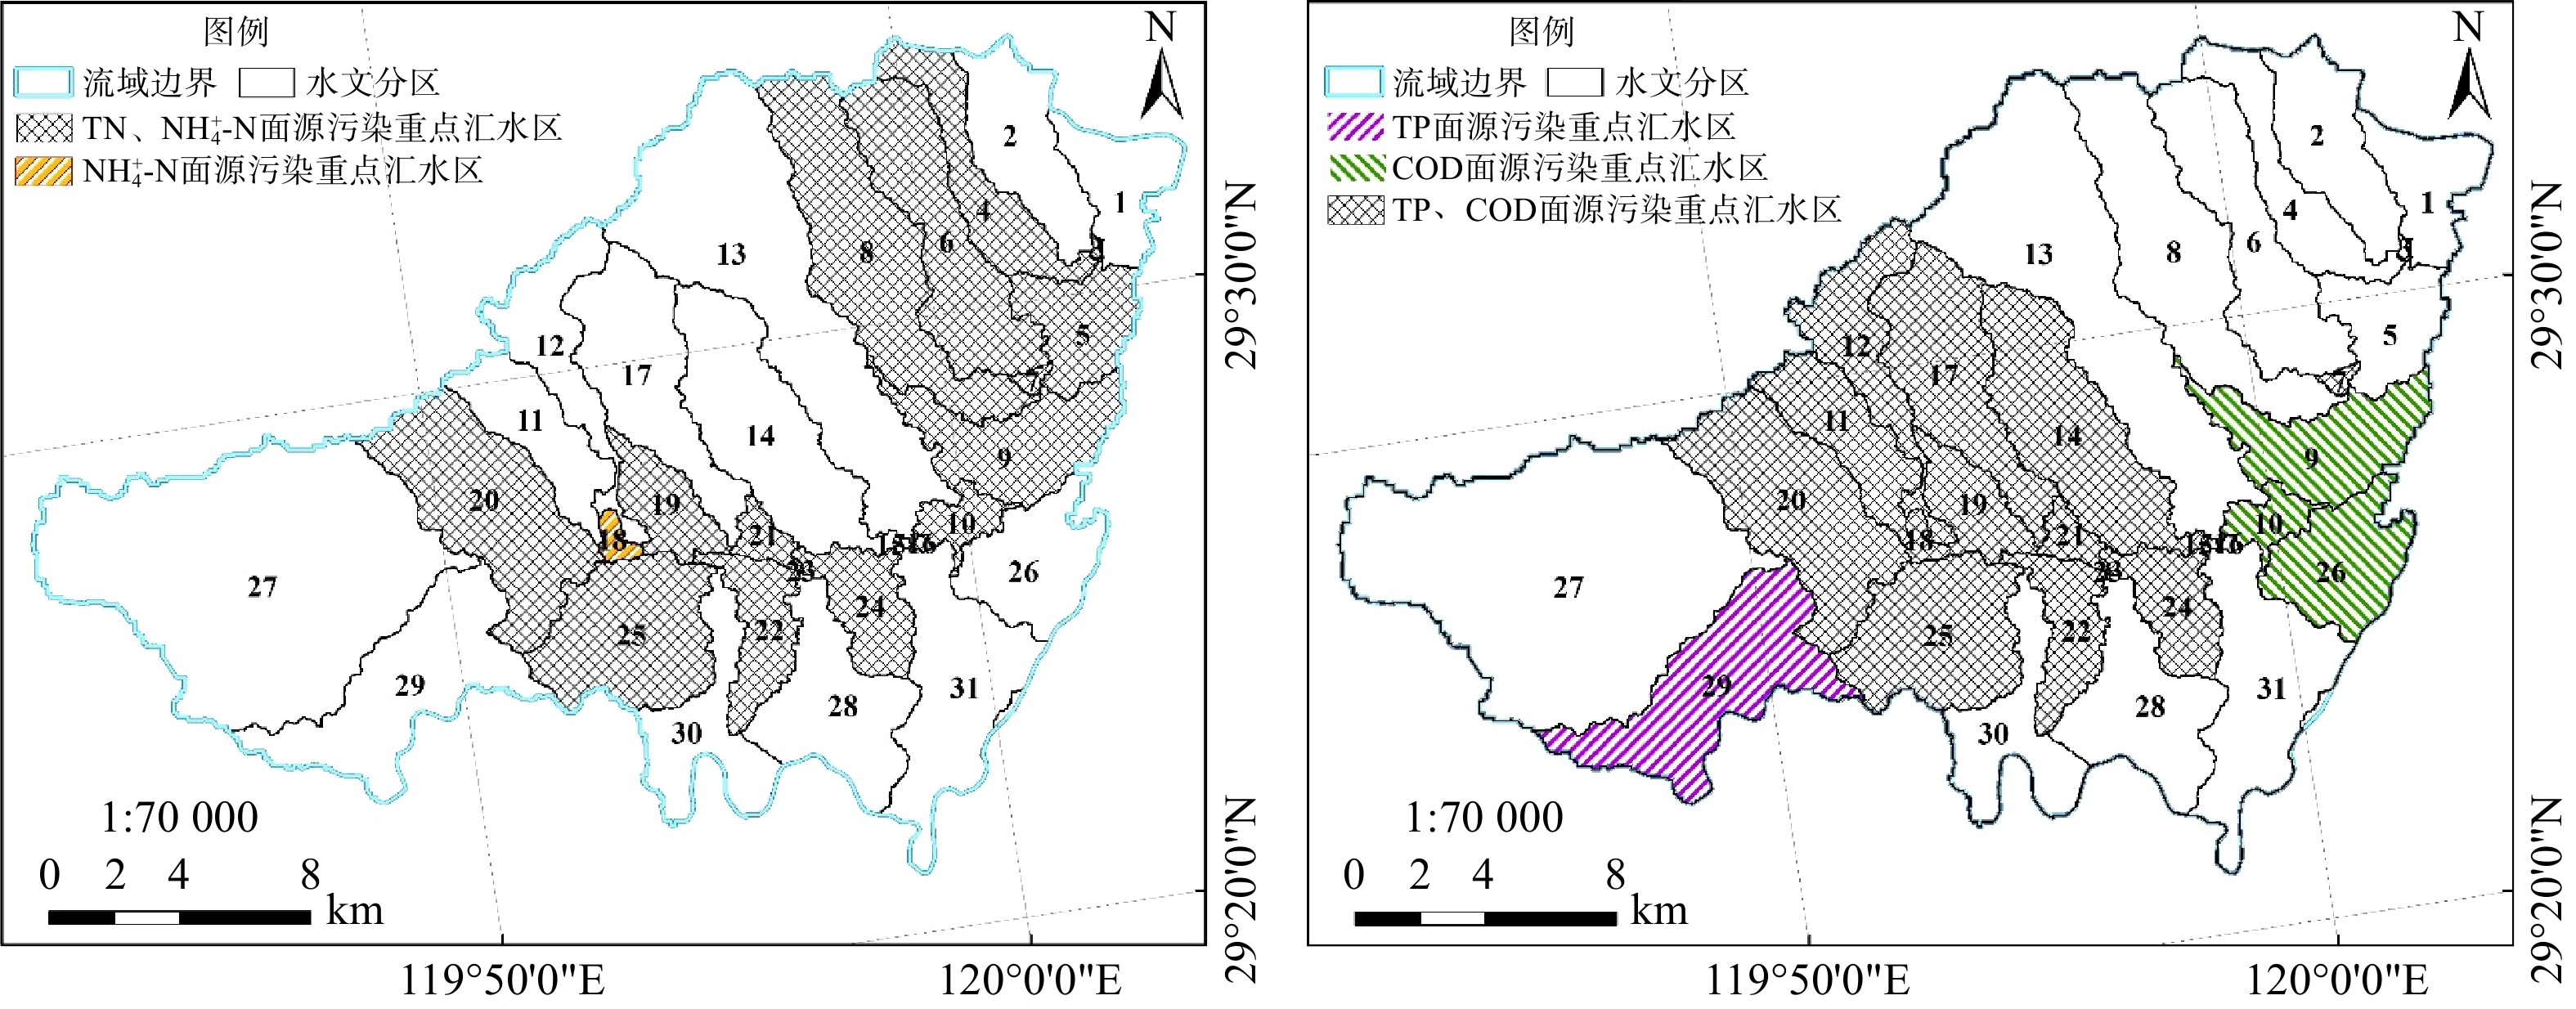
在浦阳江流域(浦江县段)缓冲带现状土地利用分类信息遥感提取的基础上,结合面源污染重点汇水区分布,综合划定了缓冲带重点区域。对浦阳江流域(浦江县段)不同汇水区的面源污染入河负荷进行了统计分析,进一步识别面源污染重点汇水区。2018年浦阳江流域(浦江县段)面源TN和
${\rm{NH}}_4^{+} $ -N重点汇水区有 17个,主要分布在流域的中部和东北部。此外,18号汇水区${\rm{NH}}_4^{+} $ -N入河负荷也较高;TP和COD重点汇水区有12个,集中分布于流域中部,靠近城区。此外,29号汇水区TP入河负荷也较高,9、10和26号汇水区COD入河负荷也较为突出。不同面源污染指标重点汇水区分布详见图6。BASNYAT等[28]应用遥感和GIS手段分析了不同用地类型对面源污染的影响,发现林地、城镇、果园和耕地4种地类中,林地对非点源污染物可起到“汇”的作用,能聚集、吸收氮磷等污染物;而其他3种类型则均为“源”的作用,会增加氮磷等污染物的负荷量,从而影响水体水质。综合浦阳江流域(浦江县段)4个指标面源污染重点汇水区和缓冲带现状遥感提取结果,筛选出的重点区包括7号和18~25号汇水区内的缓冲带(见图7)。其中,7号和20~24号汇水区内的缓冲带集中分布着耕地,而农田土壤盈余养分的流失增加了农业面源污染的风险;18~19号和25号汇水区是浦江县城区核心地带,建设用地分布比较集中,挟带城市垃圾、污水的地表径流汇入受纳水体引发面源污染。此外,20号汇水区也存在林地的集中分布,而林地可通过截流降解作用有效降低水体污染物浓度。因此,生态缓冲带防护工程建设过程中应充分考虑已有林地植被特点,优化植被配置模式,以最大程度发挥缓冲带的生态效益。朱利英等[29]指出,降雨过程中河岸带对径流污染有净化效果,坡长、坡度、植被盖度和降雨特征是河岸带削减径流污染的主要影响因素。因此,应结合重点区缓冲带的空间区划和污染特点有针对性地设计生态防护工程,作为减少面源污染入河量的有效措施之一。
缓冲带作为控制面源污染物进入水体的最后一道防线,其生态工程空间位置的选择对流域水质改善起到关键作用。同时,除选好生态工程的位置外,也应针对区域面源污染来源特征,遵循“以防为主,防治并重”的治理方针,结合源头减量、过程拦截、末端消纳与资源循环利用的防控策略,最大限度减少面源污染物入河量[4,30-32]。
-
对比国内外其他面源污染的模拟模型,DPeRS模型在模型结构、运行条件和模拟指标等几个方面具有较大的管理应用优势。该模型以遥感像元为基本模拟单元,与SWAT模型提出的水文响应单元(HRU)概念相比,在保证模拟精度的前提下大大提高了面源污染模拟的空间分辨率[22]。同时,DPeRS模型耦合了定量遥感模型,弥补了无资料或缺资料地区模型估算的不足。该模型的参数设置为开放模式,可根据参数丰富度进行重新构架,还可根据管理需求开展流域、行政区和国家等不同层次的面源污染监测与评估。模拟指标为TN、TP、
${\rm{NH}}_4^{+} $ -N和COD,与国家管理部门关注的指标一致。此外,DPeRS模型系统实现了遥感像元尺度的面源污染负荷空间可视化,可直观提供面源污染的重点区,并从农田种植、农村生活、畜禽养殖、城镇生活和水土流失5个方面对面源污染源进行解析,与传统总量减排核算方法相比,实现了由“点”到“面”的突破,可为科学制定面源污染防治方案提供技术支撑[20,33]。王雪蕾等[22,34]采用DPeRS模型对新安江流域的面源污染情况进行了模拟分析,将模拟结果与黄山市污染源调查结果进行了验证,TN、TP、
${\rm{NH}}_4^{+} $ -N和COD 4个指标的平均模拟精度达到79.6%;也与SWAT模型做了对比验证,TN和TP的模拟结果较好,拟合度R2分别为0.64和0.82,且2个模型模拟的氮磷面源污染空间分布结果规律基本相同。需要说明的是,浦江县浦阳江流域面源污染量化评估研究旨在识别面源污染重点汇水区,支撑缓冲带重点区域的选取。本研究成果可为该领域后续的拓展研究提供数据支持和科学参考,同时也为缓冲带生态工程空间位置的选择提供新思路。 -
1) DPeRS模型模拟结果表明,浦阳江流域(浦江县段)中部和中北部区域面源污染排放负荷较高,TN和
${\rm{NH}}_4^{+} $ -N高负荷区主要分布在农田地带,郑宅镇最为突出;TP高负荷区主要集中在浦阳和仙华街道;COD高负荷区集中分布于城区的浦阳街道和浦南街道。2)农田径流是浦阳江流域(浦江县段)氮型指标最主要的面源污染源。水土流失是总磷指标首要的面源污染源,其次是农田径流。而面源污染中以COD指标表征的耗氧有机污染物主要来自城镇生活。
3)植被类型面积占缓冲带总面积的65.49%,其中,耕地和林地面积占比较大(均超过28%);非植被类型面积占比34.51%,其中,水体和建筑用地面积占比均为约12%。
4)2018年浦阳江流域(浦江县段)面源污染中TN和NH4+-N的重点汇水区有17个,主要分布在流域的中部和东北部;TP和COD重点汇水区有12个,集中分布于流域中部,靠近城区。综合浦阳江流域(浦江县段)面源污染重点汇水区和缓冲带内的土地类型提取结果,筛选出的重点区域包括下游地区的7号汇水区和中游地区的18~25号内的缓冲带。可针对重点缓冲带设计生态防护工程,作为减少面源污染物入河量的有效措施之一。
致谢:本研究中地面统计数据的获取得到了金华市生态环境局浦江分局的大力帮助,在此表示感谢!
浦阳江流域(浦江县段)面源污染模型估算及河流生态缓冲带重点区域识别
Estimation of non-point source pollution model in Puyang River Basin (Pujiang County Section) and identification of key areas of riparian ecological buffer zone
-
摘要: 以浦阳江流域(浦江县段)为研究区,从流域面源污染空间特征入手,提出浦阳江流域岸边带建设的重点区域。采用DPeRS面源污染负荷估算模型,具体分析了2018年浦阳江流域面源污染负荷空间分布特征,并采用面向对象方法提取了岸线和河流生态缓冲带土地覆盖类型,以汇水区为单元,结合面源污染估算结果识别了浦阳江流域河流生态缓冲带重点区。结果表明:浦阳江流域中部和中北部地区面源污染排放负荷较高,面源污染入河负荷高值区主要集中于中下游地区;该流域31个汇水区中,TN和NH4+-N重点汇水区有17个,主要分布在流域的中部和东北部;TP和COD重点汇水区有12个,集中分布于流域中部;浦阳江流域河流生态缓冲带范围内,植被类型和非植被类型面积占比分别为65.49%和34.51%,其中耕地面积占比29.36%,建筑用地占比11.89%;综合浦阳江流域面源污染重点汇水区和河流生态缓冲带现状遥感提取结果,筛选出的重点区包括下游地区的7号汇水区和中游地区的18~25号汇水区所在的河流生态缓冲带。今后,可针对其重点区域设计生态防护工程,也应结合源头减量、过程拦截、末端消纳与资源循环利用的防控策略,综合削减面源污染物入河量。Abstract: As the last line of defense for controlling non-point source pollution into the water body, the important ecological function of riparian zone is recognized by scholars. In particular, the choice of the spatial location of the ecological engineering for riparian zone plays a key role in improving the water quality of the river basin. This article taking Puyang River Basin (Pujiang County Section) as the research area extracts the key areas for the construction of the riparian ecological buffer zone in Puyang River Basin from the spatial characteristics of non-point source pollution in the river basin. Specifically, the article analyzes the spatial distribution characteristics of the non-point source pollution load in the Puyang River Basin in 2018 using the DPeRS non-point source pollution load estimation model, and extracts the land cover types of the shoreline and riparian ecological buffer zone with object-oriented method. Meanwhile, the key areas of riparian ecological buffer zone in the Puyang River Basin is identified with the results of non-point source pollution estimation regarding catchment area as unit. The results show that the central and northern parts of the Puyang River Basin have high non-point source pollution discharge loads, and high-value areas of non-point source pollution loads entering into river are mainly concentrated in the middle and lower reaches of the river basin. Among the 31 catchment areas in the river basin, there are 17 key catchment areas of non-point source pollution of TN and NH4+-N mainly distributed in the middle and northeast of the river basin. And 12 key catchment areas of non-point source pollution of TP and COD are concentrated in the central river basin. Within the riparian ecological buffer zone of the Puyang River Basin, the area ratio of vegetation types and non-vegetation types are 65.49% and 34.51%, respectively, among which cultivated land is 29.36% and construction land is 11.89%. Based on extraction results of the current situation of the key catchment areas and riparian ecological buffer zones of non-point source pollution in the Puyang River Basin with remote sensing, the selected key areas are including the buffer zone where the No. 7 catchment area in the downstream area and the No. 18~25 catchment areas in the middle reaches are located. Therefore, the ecological protection project can be designed for key riverbank buffer zones, and the prevention and control strategies of source reduction, process interception, end consumption and resource recycling should also be combined to comprehensively reduce the amount of non-point source pollutants into the river.
-

-
表 1 DPeRS模型结构和构建原理
Table 1. Construction and theories of DPeRS model
子模块 模型描述 主方程 农田氮磷平衡估算 依据物质守恒原理,定量描述农田年均氮磷营养负荷的盈亏,作为模型中的农田污染源强 NUTbal=(Input-Output)/Area
Input=Ftlz+Mnr+Irg+Seed+Dpzt+Bnf
Output= Hvst+Gas+Water植被覆盖度反演 基于多光谱遥感数据定量描述地表植被覆盖度情况 FVC=NDVIs=(NDVI-NDVIlow)/( NDVIhigh-NDVIlow)
NDVI=(NIR-RED)/(NIR+RED)溶解态污染负荷估算 依据降雨冲刷原理,定量描述4种类型的面源污染负荷,即城镇生活型、农田径流型、农村居民点型和畜禽养殖型 ${c_{ {\text{Dis-urb} } } } = \left\{ \begin{gathered} \sum\limits_{m = 1}^4 {\sum\limits_{j = 1}^{12} {\frac{\varepsilon }{ { {\varepsilon _0} } } \times (1 - {{\rm{e}}^{ - krt} }) \times ({\gamma _m} \times {C_{ {\text{refuse} } } } \times D + {L_m}) \times (1 - W) \times (1 - U),P \geqslant r} } \\ 0\;,\quad P < r\quad \\ \end{gathered} \right.$ ${c_{ {\text{Dis-agr} } } } = \left\{ \begin{gathered} \sum\limits_{m = 1}^2 {\sum\limits_{j = 1}^{12} {\frac{\varepsilon }{ { {\varepsilon _0} } } \times (1 - {{\rm{e}}^{ - krt} }) \times ({Q_{ {\text{bal} }\_m} } + {L_m}) \times N,P \geqslant r} } \\ 0\;,\quad P < r\quad \\ \end{gathered} \right.$ ${c_{ {\text{Dis-rur} } } } = \left\{ \begin{gathered} \sum\limits_{m = 1}^4 {\sum\limits_{j = 1}^{12} {\frac{\varepsilon }{ { {\varepsilon _0} } } \times (1 - {{\rm{e}}^{ - krt} }) \times ({\gamma _m} \times {C_{ {\text{refuse} } } } \times D + {L_m}) \times (1 - W),P \geqslant r} } \\ 0\;,\quad P < r\quad \\ \end{gathered} \right.$ ${c_{ {\text{Dis-liv} } } } = \left\{ \begin{gathered} \sum\limits_{m = 1}^4 {\sum\limits_{j = 1}^{12} {\frac{\varepsilon }{ { {\varepsilon _0} } } \times (1 - {{\rm{e}}^{ - krt} }) \times ({\gamma _m} \times {C_{ {\text{refuse} } } } \times D + {L_m}),P \geqslant r} } \\ 0\;,\quad P < r\quad \\ \end{gathered} \right.$ $ N = {\text{slo}}{{\text{p}}_{{\text{co}}}} \cdot {\text{vegcove}}{{\text{r}}_{{\text{co}}}} \cdot {\text{soi}}{{\text{l}}_{{\text{co}}}} $ 颗粒态污染负荷估算 依据土壤侵蚀估算结果,定量描述颗粒态氮磷的污染负荷 $ {C_{{\text{Ads}}}} = A \cdot {Q_{\text{a}}} \cdot {E_{\text{r}}} \cdot {10^{ - 6}} $ $ A = R \cdot K \cdot L \cdot S \cdot C \cdot P $ $R =\displaystyle \sum\limits_{j = 1}^{12} {1.735} \times {10^{1.5 \times \lg (P_j^2/{P_{ {\text{year} } } }) - 0.818\;8} }$ $\begin{aligned} K = & \left\{ { {\text{0} }{\text{.2 + 0} }{\text{.3exp} }\left[ { - 0.025\;6{ { {S} }_{\text{a} } }\left( {1 - \frac{ { {S_i} } }{ { {\text{100} } } } } \right)} \right]} \right\}{\left( {\frac{ { {S_i} } }{ { {C_i + }{S_i} } } } \right)^{ {\text{0} }{\text{.3} } } } \times \left[ {1 - \frac{ {0.25{ {C}_{ {\text{org} } } } } }{ { { {C}_{ {\text{org} } } } + {\text{exp} }\left( { {\text{3} }.72 - 2{\text{.95} }{ {C}_{ {\text{org} } } } } \right)} } } \right] \times \\ & \left[ {1 - \frac{ { {\text{0} }.7(1 - {S_{\text{a} } }{\text{)} } } }{ {1 - {S_{\text{a} } } + {\exp }( - 5{\text{.51 + 22} }.9(1 - {S_{\text{a} } }{\text{))} } } } } \right] \end{aligned}$ ${K_{ {\text{China} } } } = - 0.013\;83 + 0.515\;75{K_{ {\text{EPIC} } } }\hfill \\ K = 0.131\;7 \times {K_{ {\text{China} } } }$ $S=\left\{ \begin{array}{l}10.8\sin (\theta)+0.03 \qquad \theta \leqslant {5}^{\circ}\\ 16.8\sin (\theta)-0.5 \qquad 5^{\circ} < \theta < {10}^{\circ}({\text{坡长} } > 5\; {\rm{m}})\\ 21.9\mathrm{sin}(\theta )-0.96 \qquad \theta \geqslant {10}^{\circ}\end{array} \right.$ $S=3.0{\mathrm{sin} }^{0.8}({\mathrm{tan} }^{-1}\theta )+0.56({\text{坡长} }\leqslant 5\; {\rm{m}})$ $L = {(\lambda /22.13)^m} = \left\{ \begin{gathered} m = 0.2\quad \quad \quad \quad \theta < {0.5^\circ} \hfill \\ m = 0.3\quad \quad \quad \quad {0.5^\circ} \leqslant \theta < {1.5^\circ} \hfill \\ m = 0.4\quad \quad \quad \quad {1.5^\circ} \leqslant \theta < {3^\circ } \hfill \\ m = 0.5\quad \quad \quad \quad \theta \geqslant {3^\circ} \hfill \\ \end{gathered} \right.$ $C=\left\{\begin{array}{l}1, \; \text{FVC}=0\\ 0.650\;8-0.343\;6\lg \text{FVC}, \; 0 < \text{FVC}\leqslant 78.3\%\\ 0, \; \text{FVC} > 78.3\%\end{array}\right.$ 入河量估算 依据径流系数和输沙系数,定量评估污染物入河量 ${M_{ {\text{NPS} } } } = ({C_{ {\text{Dis} } } } \cdot {\text{CR} } + {C_{ {\text{Ads} } } } \cdot {\text{SDR} }) \times S_{ \text{Area} }$ $ {\text{CR}} = {P_{{\text{year}}}}{\text{/}}{Q_{{\text{runoff}}}} $ $ {\text{SDR}} = {Q_{{\text{sed}}}}{\text{/}}A \times 100\% $ 表 2 DPeRS模型中的主要参变量列表
Table 2. The main parameters list of DPeRS model
参数符 单位 含义 参数符 单位 含义 NUTbal t·(km2·a)−1 氮磷平衡负荷 Mnr t 有机肥养分输入量 Input(t) t 养分输入量 Irg t 灌溉养分输入量 Output(t) t 养分输出量 Seed t 种子养分输入量 Area() hm2 为耕地面积和园地面积之和 Bnf t 生物固氮氮输入量 Ftlz(t) t 化肥养分输入量 Dpzt t 干湿沉降养分输入量 Hvst(t) t 作物带走养分输出量 Gas t 氨气挥发和反硝化氮输出量 Water(t) t 淋失和径流养分输出量 FVC — 植被覆盖度 NDVIs — 标准化归一化植被指数 NDVIlow — 裸土像元的NDVI NDVIhigh — 植被像元的NDVI NIR — 近红外波段地表反射率 RED — 红光波段地表反射率 CDis_urb t·km−2 城镇生活型溶解态污染负荷 ɛ 量纲一 地表径流系数 m 量纲一 污染元素类型(1TN;2TP;3COD;4NH4+-N) j 量纲一 月份 N 量纲一 自然修正因子 P mm 每月降雨量 ɛ0 量纲一 标准化地表径流系数 S 量纲一 社会修正因子 CDis_rur t·km−2 农村居民点型溶解态污染负荷 γm 量纲一 污染物转化系数 CDis_liv t·km−2 畜禽养殖型溶解态污染负荷 C t·km−2 累积垃圾/粪便量 D d 两次降雨期之间的未降雨天数 Lm t·km−2 降雨过后残留污染物量 r mm 每月标准降雨强度 Qbalm t·km−2 污染源强即氮磷平衡负荷 K 量纲一 地表冲刷系数 CDis_agr t·km−2 农田型溶解态污染负荷 CAds t·km−2 颗粒态非点源污染负荷 Er 量纲一 氮磷富集系数 Qa mg·kg−1 土壤氮磷含量 CR 量纲一 年径流系数 SDR 量纲一 输沙系数 A t·(km2·a)−1 年土壤侵蚀量 Qa mg·kg−1 土壤中的氮磷含量 LS 量纲一 坡度坡长因子 R — 降雨侵蚀力[22] K — 土壤侵蚀性因子[22] Sn — Sn=1-Sa/100,Sa土壤砂粒含量 KChina — 修正的土壤侵蚀性因子 Ci % 土壤黏粒含量 C % 土壤有机碳含量 Si % 土壤粉粒含量 KEPIC — 美国制单位的土壤侵蚀性因子[22] P 量纲一 水土保持措施措施因子 C 量纲一 生物措施因子 0.131 7 — 单位转换系数 表 3 DPeRS模型输入数据列表
Table 3. Input data list of DPeRS model
数据类型 数据来源 数据处理方法 土地利用 2018年Sentinel-2A/B MSI数据(空间分辨率10 m) 采用分层分类决策树进行土地利用分类提取 植被覆盖度 2018年Sentinel-2A/B MSI数据(空间分辨率10 m) 采用像元二分模型进行植被覆盖度反演[24] 土壤数据 国家基础信息数据1∶100万土壤类型数据 — 坡度、坡长 ASTER全球DEM数据(空间分辨率30 m) https://wist.echo.nasa.gov/api// 利用ls_cal.aml程序
计算得到[25]月降水量 国家气象数据中心下载http://ncc.cma.gov.cn 将DEM数据作为协变量,
采用薄板样条滑动平均法进行空间插值[26]乡镇级化肥施用量、耕地和园地面积、各类作物产量和播种面积、各类畜禽养殖量等 浦江县统计年鉴、现场调查数据 采用输入输出法计算农田氮磷平衡量[27] 表 4 2018年浦阳江流域(浦江县段)不同类型面源污染量统计表
Table 4. Statistics of different types of non-point source pollution in Puyang River Basin (Pujiang County Section) in 2018
污染源类型 污染物指标 污染物排
放负荷/
(kg·km−2)污染物排
放量/t污染物入
河量/t农田径流型 TN 71.30 34.14 16.34 TP 0.50 0.23 0.11 ${\rm{NH}}_4^{+} $ 28.00 13.40 6.41 畜禽养殖型 TN 0.40 0.18 0.08 TP 0.05 0.02 0.01 ${\rm{NH}}_4^{+} $ 0.07 0.03 0.02 COD 29.90 14.32 6.85 城镇生活型 TN 2.70 1.30 0.62 TP 0.20 0.10 0.05 ${\rm{NH}}_4^{+} $ 3.10 1.49 0.71 COD 107.20 51.34 24.55 农村生活型 TN 1.10 0.51 0.24 TP 0.09 0.04 0.02 ${\rm{NH}}_4^{+} $ 0.90 0.42 0.20 COD 30.10 14.40 6.89 水土流失型 TN 3.10 1.50 0.89 TP 1.10 0.52 0.31 表 5 河流生态缓冲带土地覆盖类型面积统计表
Table 5. List of area of land cover types on riparian ecological buffer zone
土地覆盖
类型面积/km² 面积占比/% 说明 耕地 5.66 29.36 包括大棚、耕地 林地 5.44 28.21 不包括小区的绿化林 草地 1.36 7.05 不包括小区的绿化草 公园绿地 0.17 0.87 小区的绿地
(包括灌木、林、草等)水体 2.47 12.84 池塘、河流、沟渠等 建筑用地 2.29 11.89 包括房屋,广场,
操场等,在建地道路 1.89 9.79 包括公路、铁路、
健步道、水泥路、土路 -
[1] 郭敏鹏, 侯精明, 付德宇, 等. 面源污染输移过程高性能数值模拟方法[J]. 环境工程, 2020, 38(8): 160-166. [2] 程静, 贾天下, 欧阳威. 基于STELLA和输出系数法的流域非点源负荷预测及污染控制措施[J]. 水资源保护, 2017, 33(3): 74-81. doi: 10.3880/j.issn.1004-6933.2017.03.014 [3] 杨波. 河岸缓冲带对辽河面源污染的阻控作用研究[D]. 长春: 吉林大学, 2018. [4] 李裕元, 李希, 孟岑, 等. 我国农村水体面源污染问题解析与综合防控技术及实施路径[J]. 农业现代化研究, 2021, 42(2): 185-197. [5] 胡作鹏, 刘志强, 彭森, 等. 低影响开发(LID)雨水径流控制效果模拟[J]. 环境工程学报, 2016, 10(7): 3956-3960. doi: 10.12030/j.cjee.201501215 [6] 宋健. 河岸过滤带对农田面源污染的处理效果研究[D]. 北京: 北京林业大学, 2019. [7] 郭慧慧. 低影响开发设施对污染物削减效果的评估[J]. 给水排水, 2019, 55(S1): 108-109. [8] 杨胜天, 王雪蕾, 刘昌明, 等. 岸边带生态系统研究进展[J]. 环境科学学报, 2007, 27(6): 894-905. doi: 10.3321/j.issn:0253-2468.2007.06.002 [9] 汤家喜, 何苗苗, 王道涵, 等. 河岸缓冲带对地表径流及悬浮颗粒物的阻控效应[J]. 环境工程学报, 2016, 10(5): 2747-2755. doi: 10.12030/j.cjee.201601034 [10] WANG X L, YANG S T, MANNAERTS C M, et al. Spatially explicit estimation of soil denitrification rates and land use effects in the riparian buffer zone of a large reservoir[J]. Geoderma: A Global Journal of Soil Science, 2009, 150(3/4): 240-252 [11] 付婧, 王云琦, 马超, 等. 植被缓冲带对农业面源污染物的削减效益研究进展[J]. 水土保持学报, 2019, 33(2): 1-8. [12] WANG X L, MANNAERTS C M, YANG S T, et al. Evaluation of soil nitrogen emissions from riparian zones coupling simple process-oriented models with remote sensing data[J]. Science of the Total Environment, 2010, 408(16): 3310-3318 [13] 黄晓敏, 杨盛昌, 彭建, 等. 派河流域滨岸带植物群落物种多样性和群落相似性分析及滨岸缓冲带模型构建[J]. 环境工程, 2019, 37(12): 55-59. [14] MANKIN K R, NGANDU D M, BARDEN C J, et al. Grassshrub riparian buffer removal of sediment, phosphorus, and nitrogen from simulated runoff[J]. Jawra Journal of the American Water Resources Association, 2010, 43(5): 1108-1116. [15] 胡威, 王毅力, 储昭升. 草皮缓冲带对洱海流域面源污染的削减效果[J]. 环境工程学报, 2015, 9(9): 4138-4144. doi: 10.12030/j.cjee.20150908 [16] 陈铁, 孙飞云, 杨淑芳, 等. 基于SWAT 模型的观澜河流域城市面源污染负荷量化及影响效应评估[J]. 环境工程学报, 2020, 14(10): 2893-2902. [17] 谢经朝, 赵秀兰, 何丙辉, 等. 汉丰湖流域农业面源污染氮磷排放特征分析[J]. 环境科学, 2019, 40(4): 1760-1769. [18] 边金云, 王飞儿, 杨佳, 等. 基于AnnAGNPS模型四岭水库小流域氮磷流失特征的模拟研究[J]. 环境科学, 2012, 33(8): 2659-2666. [19] CHANG C L, LI M Y. Predictions of diffuse pollution by the HSPF model and the back-propagation neural network model[J]. Water Environment Research, 2017, 8: 732-738. [20] 冯爱萍, 吴传庆, 王雪蕾, 等. 海河流域氮磷面源污染空间特征遥感解析[J]. 中国环境科学, 2019, 39(7): 2999-3008. doi: 10.3969/j.issn.1000-6923.2019.07.037 [21] 冯爱萍, 王雪蕾, 徐逸, 等. 基于DPeRS模型的海河流域面源污染潜在风险评估[J]. 环境科学, 2020, 41(10): 4555-4563. [22] WANG X L, WANG Q, WU C Q, et al. A method coupled with remote sensing data to evaluate non-point source pollution in the Xin'anjiang catchment of China[J]. Science of the Total Environment, 2012, 430: 132-143. doi: 10.1016/j.scitotenv.2012.04.052 [23] 王雪蕾, 蔡明勇, 钟部卿, 等. 辽河流域面源污染空间特征遥感解析[J]. 环境科学, 2013, 34(10): 3788-3796. [24] 王雪蕾, 王桥, 吴传庆, 等. 国家尺度面源污染业务评估与应用示范 [M]. 北京: 科学出版社, 2015. [25] 符素华, 刘宝元, 周贵云, 等. 坡长坡度因子计算工具[J]. 中国水土保持科学, 2015, 13(5): 105-110. doi: 10.3969/j.issn.1672-3007.2015.05.016 [26] 刘志红, LI L T, MCVICAR T R, 等. 专用气候数据空间插值软件ANUSPLIN及其应用[J]. 气象, 2008, 34(2): 92-100. doi: 10.7519/j.issn.1000-0526.2008.02.013 [27] WANG X L, FENG A P, WANG Q, et al. Spatial variability of the nutrient balance and related NPSP risk analysis for agro-ecosystems in China in 2010[J]. Agriculture, Ecosystems and Environment, 2014, 193: 42-52. doi: 10.1016/j.agee.2014.04.027 [28] BASNYAT P, TEETER L D, LOCKABY B G, et al. The use of remote sensing and GIS in watershed level analyses of non-point source pollution problems[J]. Forest Ecology & Management, 2000, 128(1/2): 65-73. [29] 朱利英, 赵凯, 张俊亚, 等. 不同降雨条件下北运河河岸带类型对径流污染削减效果的影响[J/OL]. 环境科学: 1-19 [2021-12-10]. https://doi.org/10.13227/j.hjkx.202105286. [30] 熊丽萍, 李尝君, 彭华, 等. 南方流域农业面源污染现状及治理对策[J]. 湖南农业科学, 2019(3): 44-48. [31] 吴永红, 胡正义, 杨林章. 农业面源污染控制工程的“减源- 拦截-修复”(3R) 理论与实践[J]. 农业工程学报, 2011, 27(5): 1-6. doi: 10.3969/j.issn.1002-6819.2011.05.001 [32] 武升, 张俊森, 张东红, 等. 小流域农业面源污染评价与综合治理研究进展[J]. 环境污染与防治, 2018, 40(6): 710-716. [33] 王雪蕾, 吴传庆, 冯爱萍, 等. 利用DPeRS模型估算巢湖流域氨氮和化学需氧量的面源污染负荷[J]. 环境科学学报, 2015, 35(9): 2883-2891. [34] 王雪蕾. 遥感分布式面源污染评估模型: 理论方法与应用 [M]. 北京: 科学出版社, 2015. -


 下载:
下载:

