-
20世纪90年代中期以来,斯里兰卡旱区(Dry Zone)不明原因慢性肾病(chronic kidney disease of unknown etiology, CKDu)高发,患者约占全国总人口的0.2%,标化患病率高达12%~15%,已成为该国亟需解决的重大民生问题。当地主要饮用水源为地下水,世界卫生组织(World Health Organization, WHO)的初步研究结果表明,地下水中污染物可能是重要的致病原因[1-2]。但近年来,针对地下水特别是CKDu病区地下水的系统性调研工作开展的较少,特别是地下水中溶解性有机物(dissolved organic matter,DOM)的研究一直处于空白状态。因此,在斯里兰卡CKDu病区开展系统的地下水水质调研,了解当地地下水水质情况、水质类型、关键组成,以及DOM的组成、来源、特性和分布,对于确定地下水深度处理与饮用水安全保障技术方案具有重要的指导意义,也助于进一步了解水质与CKDu之间的关联,促进CKDu的追因研究。
本研究在斯里兰卡CKDu高发的北中省(North Central Province,NCP)展开,按照CKDu发病率,考察不同区域地下水在干湿季节的水化学特征。采用CODMn/DOC、SUVA等指标评估DOM的可生物利用性,结合应用三维荧光光谱(3DEEM)和平行因子分析(PARAFAC)方法分析DOM的组成、分布特征及来源,明确斯里兰卡CKDu病区地下水源饮用水的关键问题。针对主要污染特征,提出有效的解决策略,以期为当地饮用水安全保障和CKDu追因工作提供基础数据。
全文HTML
-
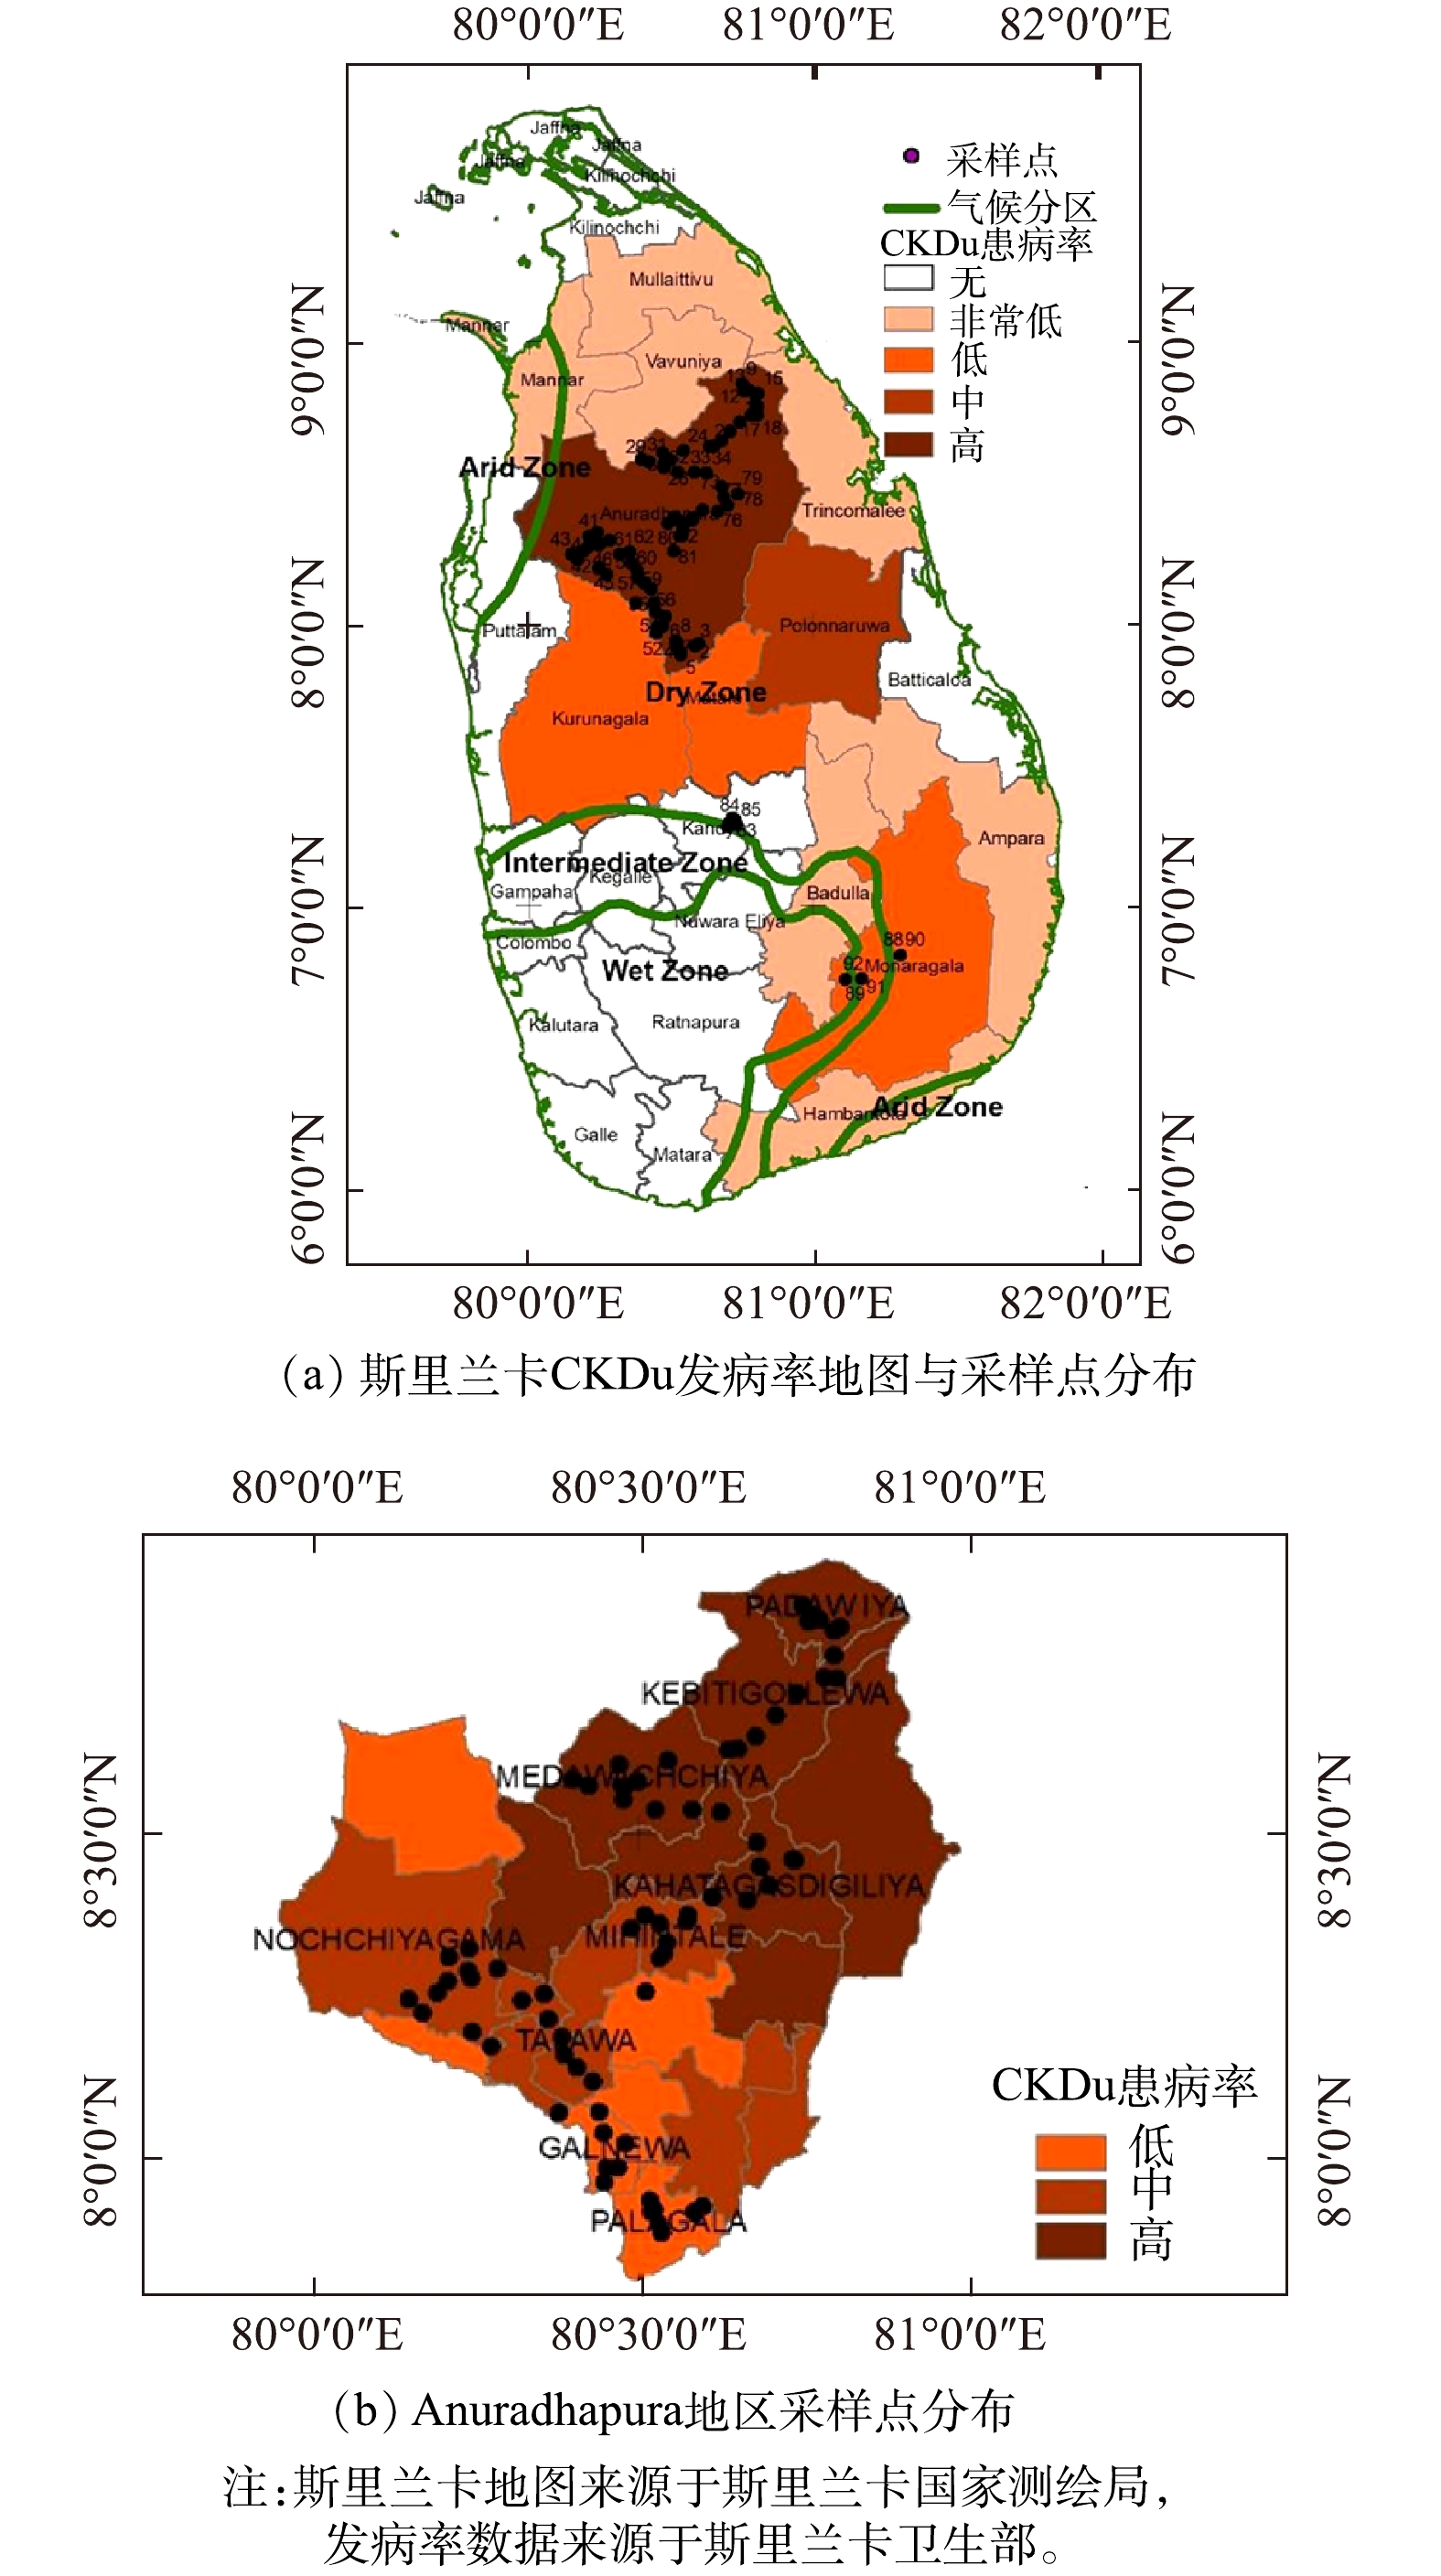
地下水样品取自NCP中患者数量最多的Anuradhapura地区的CKDu病区,根据不同村庄的患者数量,分别在高、中、低风险区(HR、MR、LR)取样35、28、17个(表1),取样点的选择尽量保证均匀性。同时,在气候条件相似的非风险区Monaragala(属于CKDu病区,无病例,NR)和非病区Digana区(作为对照,CR),各采集5个样品作为对照。采样点分布见图1,在Anuradhapura地区,Padaviya、Kebithigollawa、Medawachchiy 和Kahatagasdigiliya是HR区;Mihintale、Talawa、Thirappane和Nochchiyagama 是MR区;Galnewa和Palagale是LR区。采样分别在湿季(2016年12月)和干季(2017年5月)进行,样品取自作为当地饮用水的浅井(5~10 m)和深井(20~30 m)。
-
水样经0.45 μm滤膜过滤后保存于聚四氟乙烯瓶中,做阳离子分析的水样滴加浓硝酸进行酸化处理。采用WTW便携式水质分析仪(WTW,德国)原位测定pH、电导率、浊度和水温。碱度采用哈希碱度测试管测定(HACH,美国)。阳离子K+、Ca2+、Na+、Mg2+采用电感耦合等离子发射光谱(ICP-OES, Optima 2100 DV, Perkin Elmer, 美国)和其他重金属指标采用电感耦合等离子体质谱仪(ICP-MS, Agilent 8800, Agilent, 美国)测定,阴离子由离子色谱(IC, ICS-1000, Dionex, 美国)测定。硬度基于Ca2+和Mg2+的浓度计算。溶解性有机碳(dissolved organic carbon,DOC)由Vario TOC Select分析仪(Elementra, 德国)测定。COD (0~20 mg·L−1, HACH,美国)和CODMn (0~5 mg·L−1, HACH,美国)采用哈希测试管进行测试,采用CODMn/DOC表征有机物可生物利用性。UV254反映水中天然腐殖质类大分子有机物,以及含C=C和C=O的芳香族化合物。为消除DOC浓度的影响,采用比吸光度(specific UV-vis absorbance,SUVA)表征水样的芳香性。UV254采用紫外-可见分光光谱仪(Thermo Evolution 300, Thermo Scientific,美国)测定,比吸光度RSUVA由式(1)计算得到。
有机物组分和分子质量分布由荧光光谱(F-7000, Hitachi, 日本)和高效液相色谱(HPLC)-凝胶色谱(GPC) (Breeze 1525, Waters,美国)测定,测定稀释至UV254低于0.05,以降低内滤效应。采用平行因子分析法(PARAFAC)进行三维荧光数据的分析,利用matlab软件和drEEM toolbox 工具盒,测定时可参考文献中的方法[3-5]。其中,HR、MR、LR这2个区域的DOM主成分都为2,NR、CR区的样品数较少,未做分析。荧光指数(FI370, f )用于表征腐殖质类物质的来源,定义为激发波长370 nm下,450 nm和500 nm处的荧光强度的比值。生物指数(biological index, BIX, b)用于表征水中土著微生物的生物活性及DOM的新鲜度,定义为310 nm激发波长下380 nm处的荧光强度与420~435 nm波长范围内的最大荧光强度的比值。腐殖化指数(humification index,HIX, h)用于表征DOM的腐熟程度,定义为激发光波长为255 nm时435~480 nm范围内的总荧光强度与 435~480 nm和300~345 nm范围内的总荧光强度之和的比值[5-6]。3个指数的计算参考式(2)~式(4)。
式中:I(450 nm, 370 nm)为在发射光波长为450 nm和激发光波长370 nm的条件下测得的荧光强度;I(500 nm, 370 nm)为在发射光波长为500 nm和激发光波长370 nm的条件下测得的荧光强度;I(380 nm, 310 nm)为在发射光波长为380 nm和激发光波长310 nm的条件下测得的荧光强度;ΣI(435~480 nm, 255 nm)、ΣI(300~345 nm, 255 nm)为在激发光波长255 nm,发射光波长分别为435~480 nm和300~345 nm的条件下测得的荧光强度的和;(I(420~435 nm, 310 nm))max为发射光波长在420~435 nm,激发光波长为310 nm条件下测得的最大荧光强度。
1.1. 样品采集
1.2. 水质分析
-
表2中的数据表明,干季水样的电导率、碱度、硬度、F−和其他离子的浓度都明显更高,主要归结于较低的水量和较高的蒸发速率。Cl−是其中最主要的阴离子,水样中的阴离子浓度呈如下趋势Cl−>
SO2−4 >F−>NO−3 >>PO3−4 ;Na+是最主要的阳离子,阳离子浓度分布为Na+>Ca2+>Mg2+>K+。故可得出,当地地下水水质类型为Ca-Mg-HCO3型。Nochchiyagama地区(43号采样点)具有最高的Cl−和Na+浓度,与电导率结果一致,表明该地蒸发速率更高。铁的浓度在2个季节中差异明显,湿季Fe的浓度显著高于干季。分析其原因:一是湿季DOC浓度的增加,富里酸、腐殖酸类酸性有机物消耗地下水中的碱度(见表2),促进了岩石或土壤中固态Fe的溶解;二是Fe易与DOM中的羟基或羧基结合,形成配位体,还会促进Fe从矿物质态向溶解态转化[7]。表3展示了湿季不同地区几个典型采样点的地下水水质。数据表明,大多数样品呈弱碱性,总盐含量和各种金属浓度存在较大差异,部分地区地下水存在严重的盐碱危害[8-9]。研究发现,各水质指标与CKDu发病的风险不存在明显关系。65号采样点(HR区)电导、碱度、DOC和硬度最低,而43号采样点(MR区)相应指标最高,故可见盐含量与CKDu致病风险不存在相关性。重金属离子,如Al、Mn、Fe、Cu、Zn、As基本都满足斯里兰卡饮用水标准(SLS 614-2013)和WHO饮用水标准,仅43号(MR区)Fe超标、37号(MR区)Mn超标。同时,大部分地区地下水呈现高氟特征(见图2),研究区域内F−浓度为0.2~6.0 mg·L−1,最高的浓度(6.01 mg·L−1)出现在Kahatagasdigiliya地区(HR区),而F−浓度最低的是Galanewa地区(LR区)。从表3可以发现,37、23、19、58号 (MR、CR、NR、HR区) F−浓度分布为0.63、5.31、2.38和0.78 mg·L−1,这表明CKDu发病的风险与F−浓度不存在显著的相关关系。但HR区干湿季的F−平均浓度为2.3和2.8 mg·L−1,NR区干湿季的F−平均浓度为2.0和1.5 mg·L−1,F−平均浓度随着各地区的发病风险的升高而增加,表明F可能是致病的一个潜在风险。同时,CKDu病区的F超标率达80%,是斯里兰卡CKDu病区地下水中的重要问题。整体而言,常规指标与地区CKDu发病风险不存在显著的相关关系,但CKDu地区地下水一般呈现高F−浓度与高硬度的特征。因此,地下水中F与硬度的去除是当地饮用水安全保障中需要重点关注的问题。
-
地下水中的DOM可能是CKDu的重要影响因素[1],且DOM易与无机离子相互作用,从而改变其赋存状态和生物可利用性。由于斯里兰卡CKDu病区地下水的硬度较高,研究DOM的组成和特征具有重要意义。在CKDu病区(HR、LR 和NR),DOC为1.35~2.08 mg·L−1;而在CR区,DOC为1.37~1.62 mg·L−1。因此,非病区与病区DOC基本处于同一水平,但病区DOM分布范围相对较宽。干季DOC高于湿季,主要原因可能是蒸发浓缩作用,但LR区干季DOC显著低于湿季。
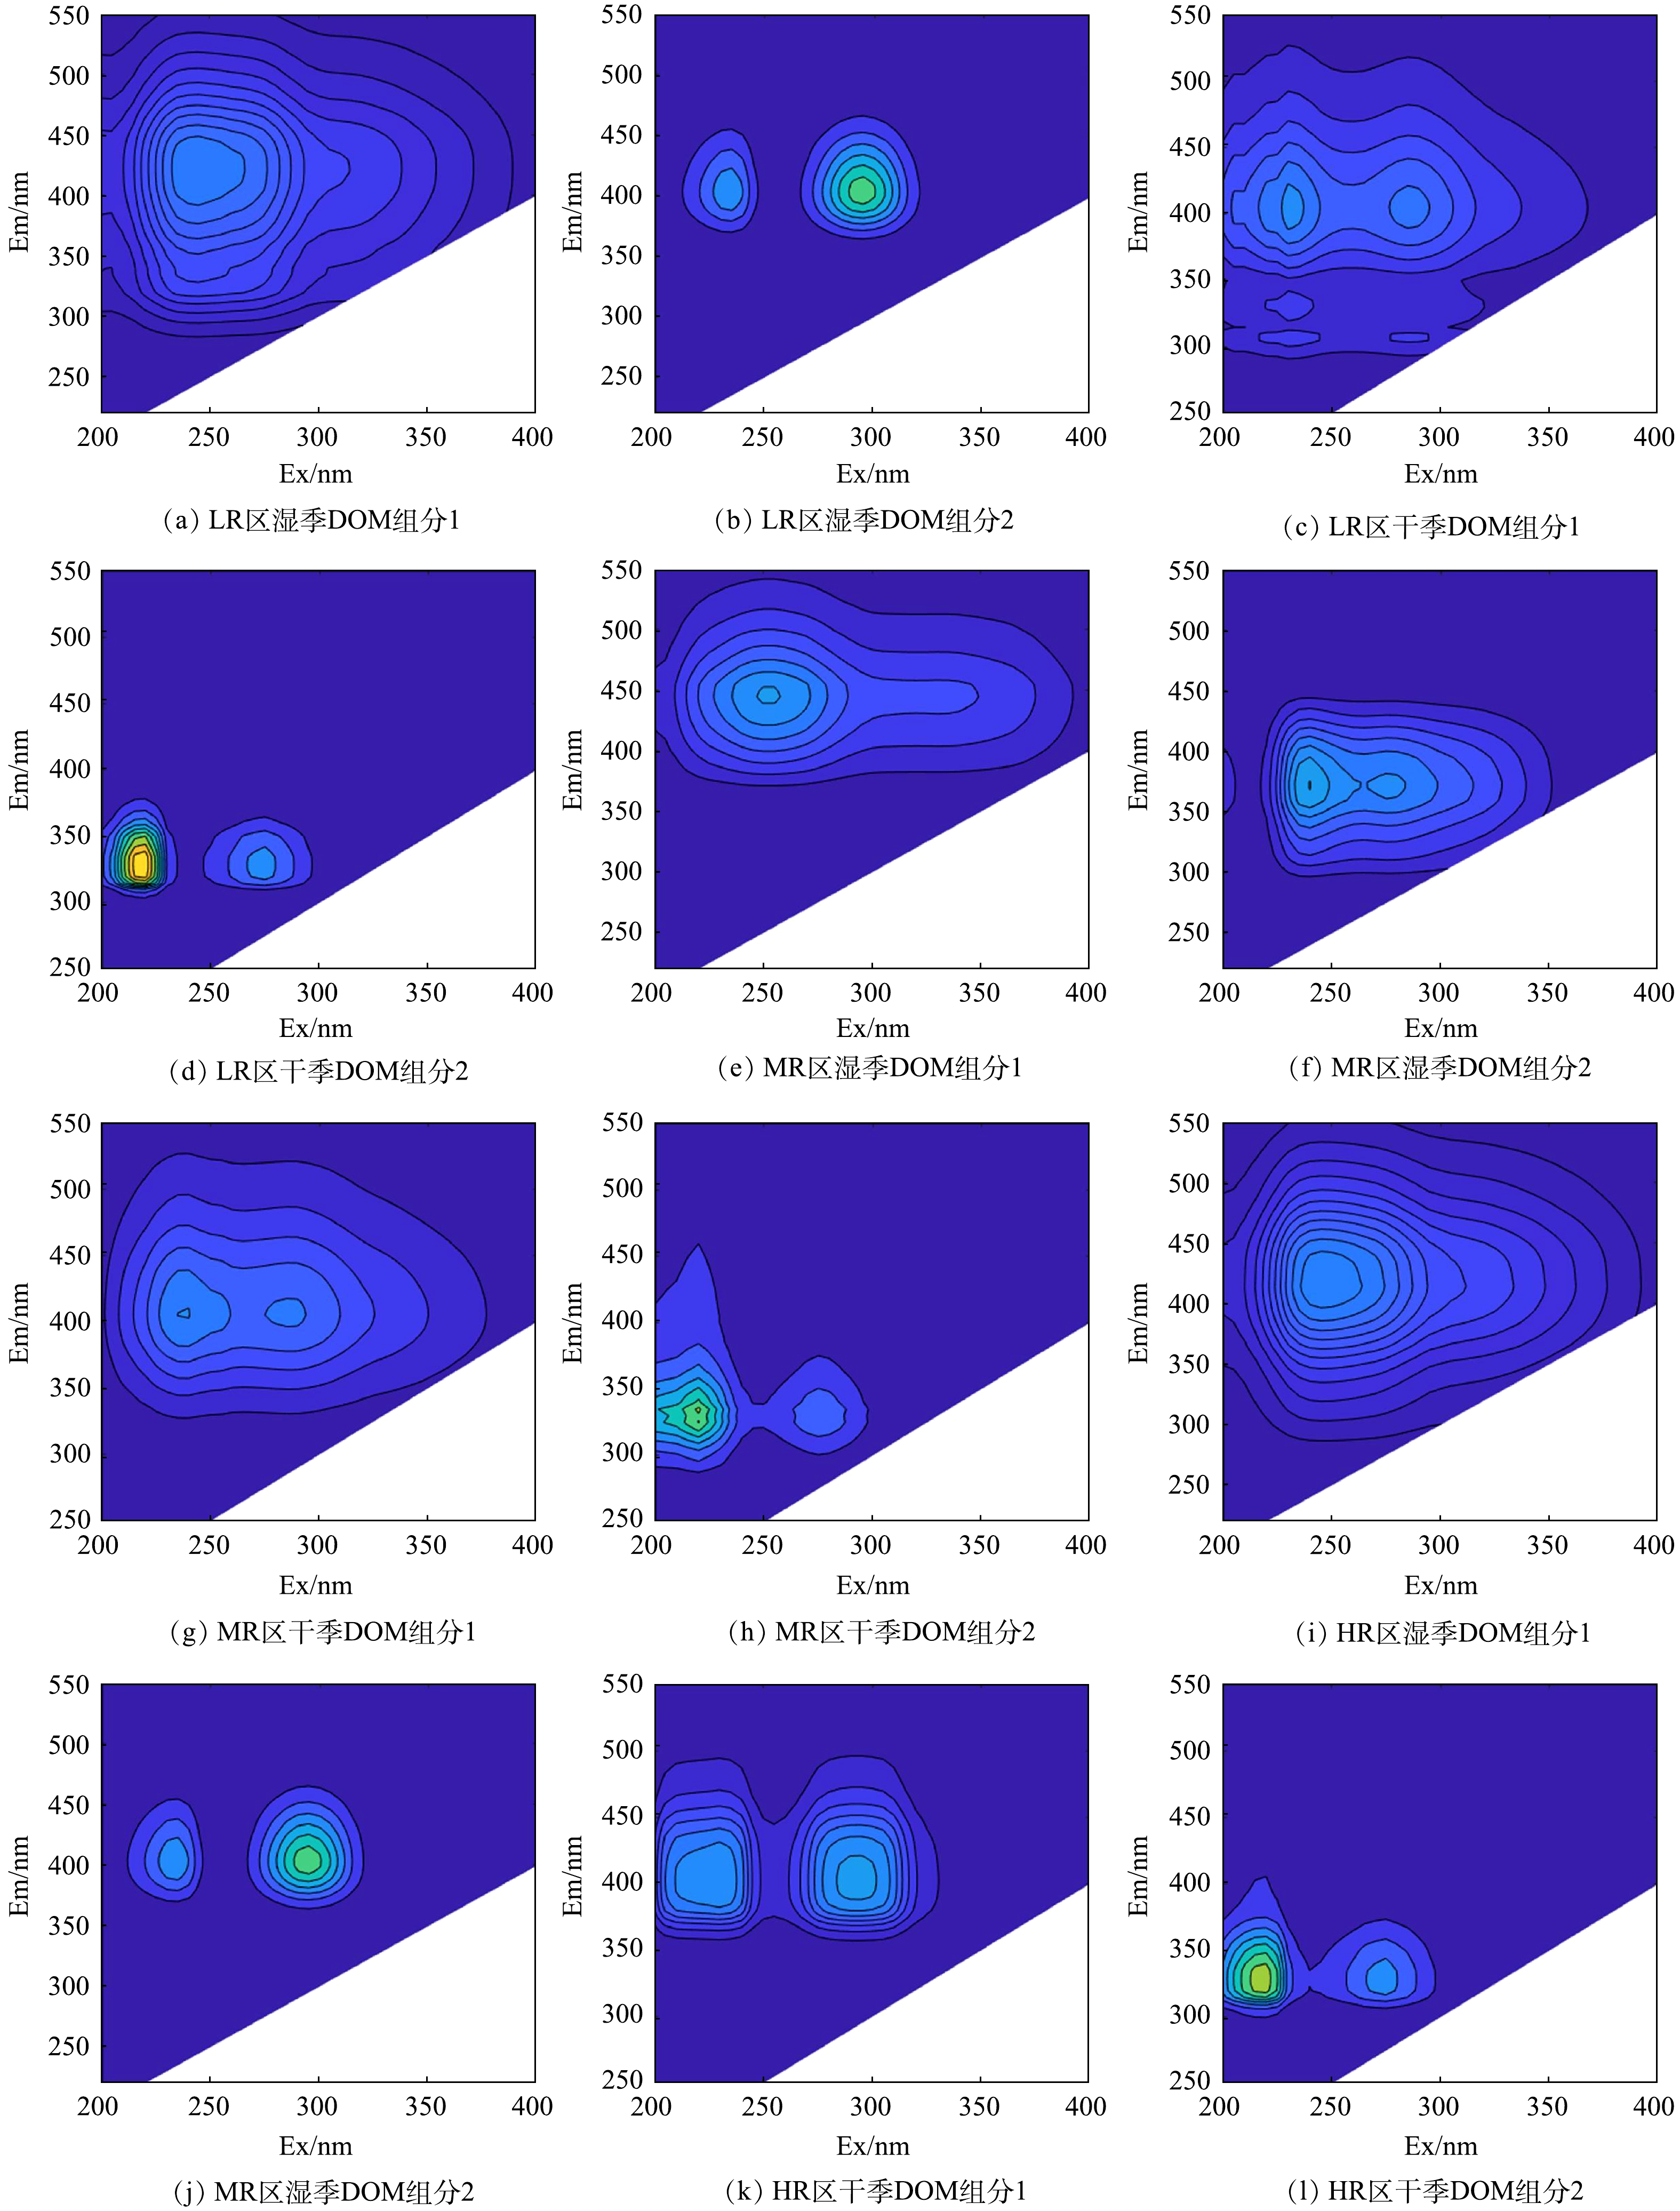
采用3DEEM和PARAFAC分析发现(见图3),斯里兰卡CKDu的LR、MR、HR地区地下水中有机物主要分为2个组分。湿季时,HR区DOM主要组成为类富里酸和类腐殖酸(见表4);MR区DOM主要组成为类富里酸和微生物代谢产物[10];HR区DOM组成与强度与LR区基本相同,组分2有2个激发光强度,主要为多环芳烃类腐殖酸和少量的类富里酸。干季时,3个区域的DOM组成基本相同,主要为类腐殖质和类蛋白质。但干季和湿季的DOM组成存在显著差异:1)LR和HR区干湿季组分1的发射波长相同,但干季分为2个激发峰,分别出现红移和蓝移,即腐殖质类物质变为富里酸和多环芳烃类腐殖酸,分子质量增加;2)干季MR区组分1也分为2个激发峰,主要是富里酸和腐殖酸类,但激发波长比LR和HR区高,即腐殖酸含量更高且相对分子质量更大;3)干季LR、MR和HR区有机物组分2相同,主要是蛋白质类,分解为2个激发峰,220/325 nm (Ex/Em)荧光峰为小分子络氨酸/色氨酸,275/325 nm(Ex/Em)荧光峰为络氨酸/色氨酸类蛋白,组分2浓度大小为LR>HR>MR。这是由于LR区的微生物可利用性较高,在干季高温条件下,可生物利用的DOM发生转化,故小分子的蛋白质和氨基酸浓度增加。
FI370主要用于评价水中腐殖质类物质的来源。斯里兰卡CKDu病区干湿季的地下水FI370为1.905~2.060,表明主要为内源性DOM,来源于细菌或藻类的胞外释放及渗出液。干季FI指数略高于湿季(表4),表明有机物芳香性更高,与图3结果一致。BIX指标表征微生物活性的DOM来源,地下水中BIX指数都大于1,表明有机物主要是微生物和细菌引起的自生源。湿季BIX指数略高于干季,表明湿季微生物活性更高(温度较高)。内源DOM占比较高,与FI指数结果一致。MR区湿季BIX指数(0.71)最高,故其DOM组成与其他区域存在明显差异,溶解性微生物代谢产物(soluble microbial products,SMP)是主要的组成之一。在干季时,MR区的BIX指数为0.599,也是病区中最高的。不管是干季还是湿季,NR区和CR区的地下水FI指数都略高于病区,而BIX指数略高,表明非病区的微生物活性更高。这是由于该地区的DOM可生物利用性更高。HIX指数表征有机物的腐熟程度,样品的HIX指数都小于1,腐熟化程度较低,这是因为DOM受微生物的影响较大所导致。干季时,LR和HR区的HIX指数分别为0.477和0.384,表明干季时DOM腐熟化程度非常低,自生源特征明显。
PARAFAC分析表明DOM在干湿季及不同风险区存在显著的差异,主要原因是微生物的作用。因此,生物可利用性的差异可能是不同地区DOM的主要差异,也可能是CKDu致病的一个潜在原因。因此,采用CODMn表征水中不稳定易被微生物利用的有机物,发现病区和非病区CODMn也不存在显著差异,且一般干季的CODMn浓度低于湿季。这是由于干季高温条件下,可生物利用的有机物被降解。但CR区干湿季CODMn差异最大(相差0.9 mg·L−1),其DOC差异仅为0.25 mg·L−1,故可推断CR区可生物利用的有机物在干湿季发生了显著变化。进一步地,采用CODMn/DOC指示水中有机物的生物可利用性。高风险区的CODMn较稳定,干湿季CODMn/DOC变化仅为0.02;LR和NR区CODMn/DOC在干湿季变化分别为0.05和0.12;而CR区干湿季节CODMn/DOC变化为0.48。因此,不同地区地下水有机物中可生物利用性:HR<LR<NR<CR,HR区有机物最稳定。同时,HR区SUVA为(3.29±0.44) L·(mg·m)−1,远高于其他区域,表明病区地下水中有机物芳香性更高。而水中SUVA的大小比较为HR>LR>NR>CR(见表5),故地下水中DOC的芳香性与CKDu发病率存在一定的相关性。
进一步分析当地地下水中有机物的分子质量分布发现,HR区地下水中有机物分子量分布更广,表明HR区有机物组成更复杂 (见图4)。同时,HR区地下水中未出现分子质量低于500 Da的小分子,但分子质量大于2500 Da处有2个显著的吸收峰,且整体吸光度显著高于其他区域,即该区DOM浓度及分子量较高,这也是该地区DOM微生物可利用性较低的关键原因。4个地区低分子区基本相同,表明低分子区有机物含量基本相同,低分子区主要为微生物代谢产物和小分子蛋白。1 000~1 800 Da的中分子区是当地地下水中主要组成,这部分有机物主要为富里酸类(Fulvic acid,FA)及难生物利用的代谢产物[11],因此病区的UV254强度明显高于CR区。高分子区(分子质量大于1 800 Da)主要是多糖或大分子腐殖质类等疏水性有机物[11-12],因此当地地下水中DOM的疏水性为HR>LR/MR>CR。综上,地下水中DOM的分子量、疏水性、浓度、微生物可利用性随发病率升高而升高,可能是CKDu致病的一个重要原因。
-
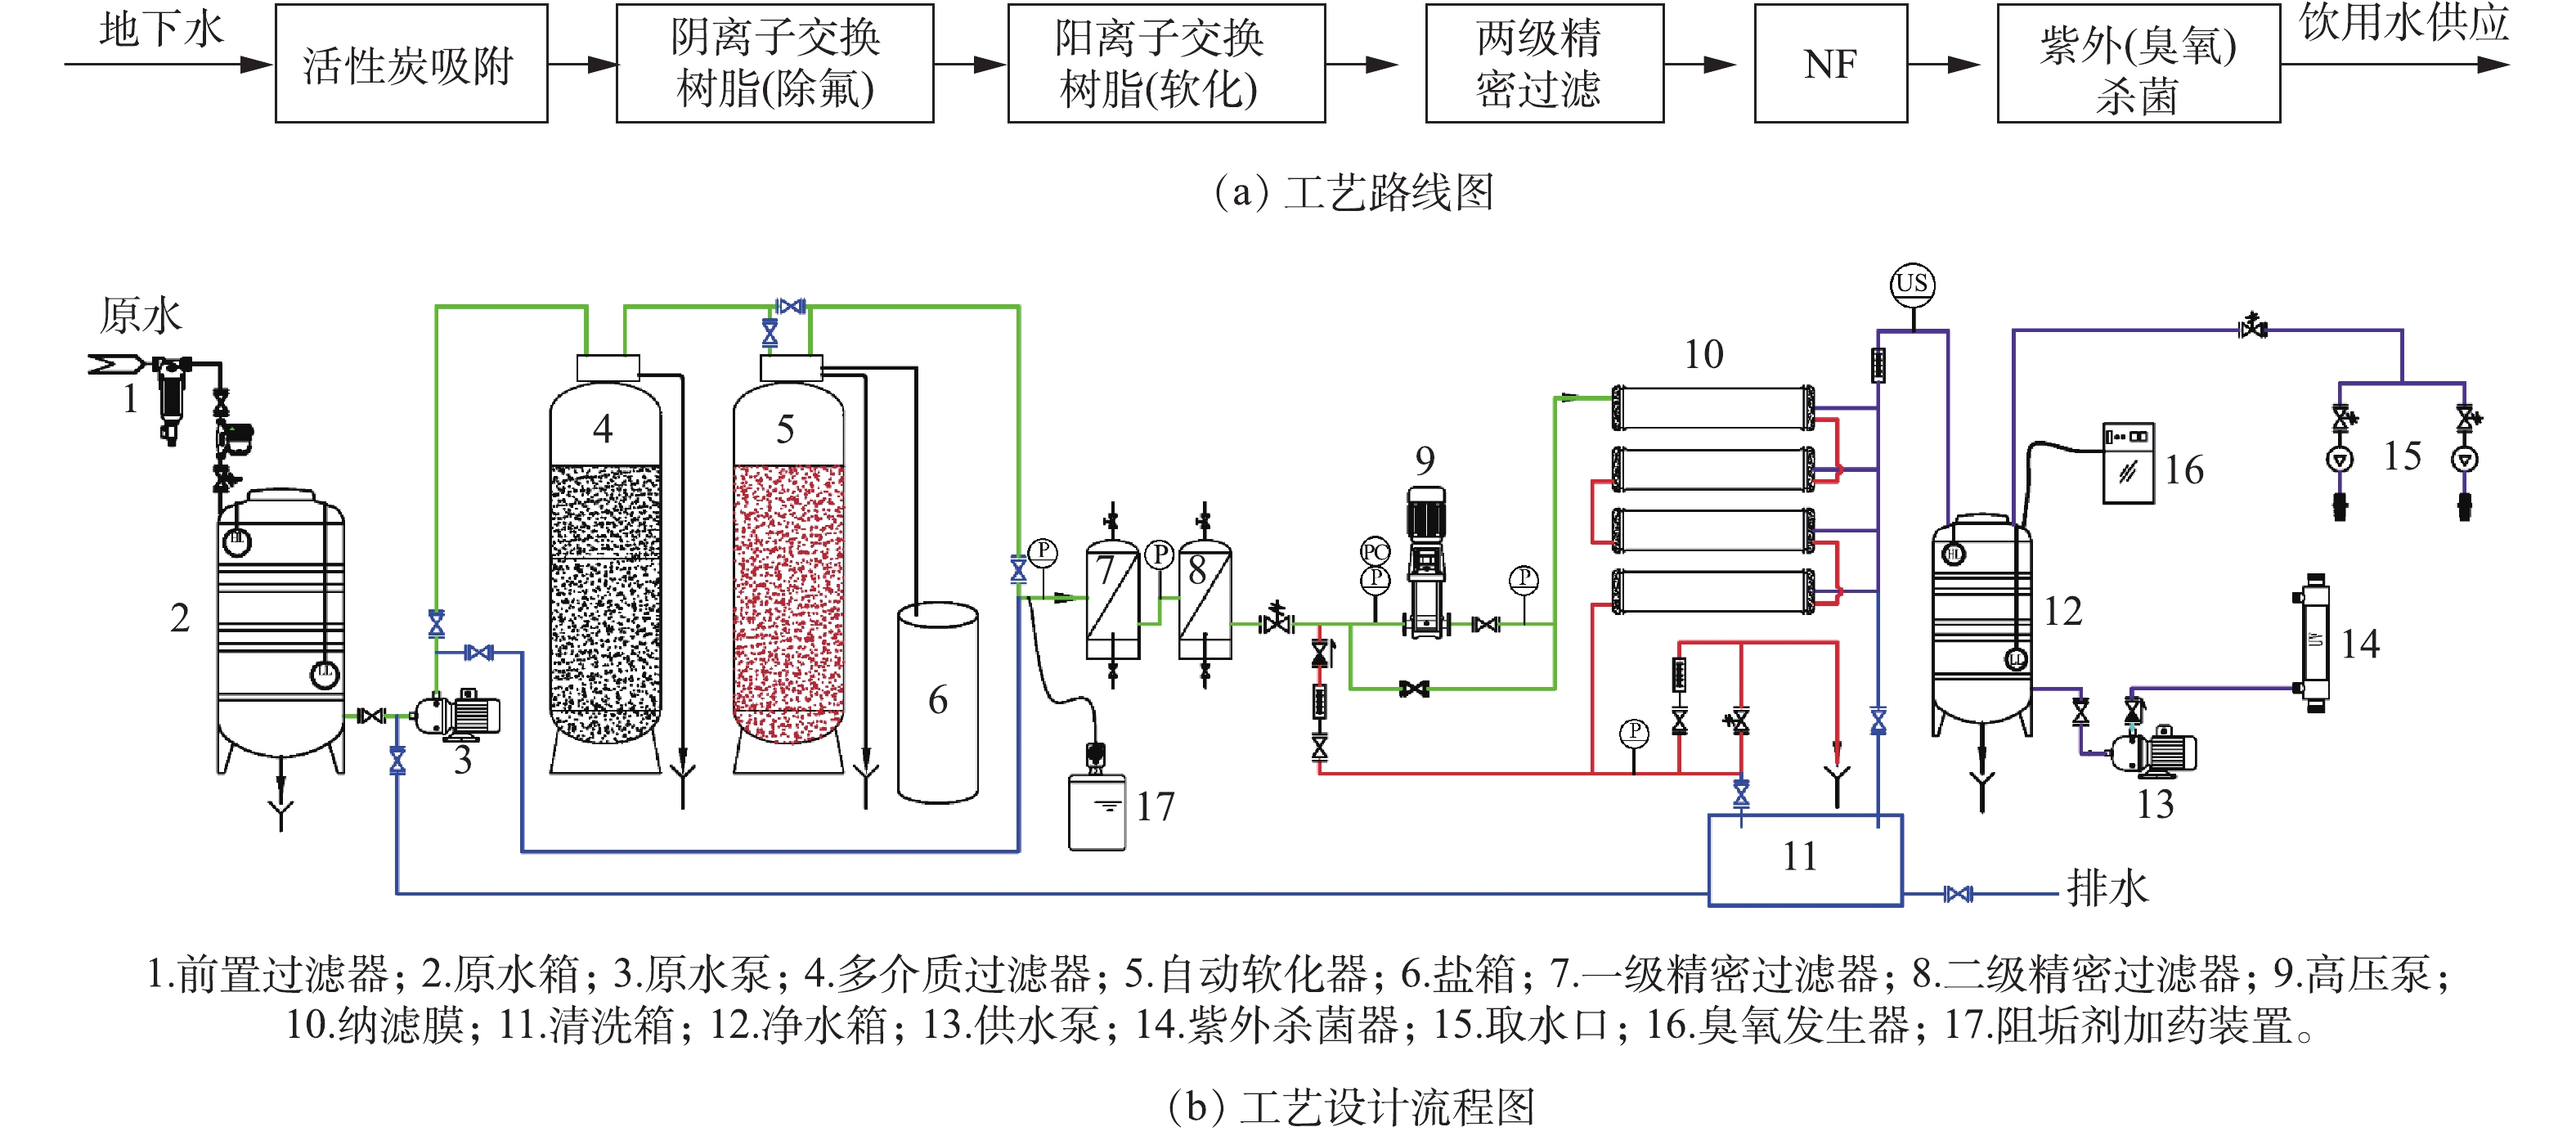
通过以上分析可知,斯里兰卡地下水中硬度、F和DOM及其相互作用是水质的主要问题。尽管硬度和氟与致病趋势无显著相关性,但HR区F浓度、DOM的组成及稳定性相对略高,其相互结合很可能是CKDu的重要致病原因[13]。目前,斯里兰卡国内由政府或私人机构建设了许多反渗透(reverse osmosis,RO)水站为居民提供饮用水。水站出售饮用水的价格不一,私人运营的水站价格更高。同时,由于RO对矿物离子的完全截留,导致饮用水口感不佳,当地居民对此的接受度较低[14]。加上在全球范围内对饮用RO产水对人体健康的影响尚不明确。因此,为保障斯里兰卡病区的地下水源饮用水的安全供给,结合当地的经济发展水平,提出采用纳滤(nanofiltration,NF)作为地下水深度处理工艺,实现主要污染物质的去除。同时,为保障膜过程的稳定运行,减缓膜污染,提出采用活性炭吸附与离子交换作为预处理工艺,部分去除水中的有机污染物、无机污染物和微生物污染物(见图5)。多介质过滤器中安装活性炭和阴离子交换树脂,以去除水中有机物和F;软化主要采用阳离子交换树脂,以降低硬度,从而减轻后续NF段的膜污染;最后采用NF进行深度处理,处理后采用紫外和臭氧2种方式相结合进行消毒,以保障饮用水的水质安全。本方案设计处理量为20 m3·d−1,出水水质要求达到斯里兰卡饮用水水质标准(SLS 614-2013)。
2.1. 地下水常规水质
2.2. DOM特征
2.3. 斯里兰卡地下水源饮用水安全保障方案
-
1) 斯里兰卡CKDu病区地下水都呈Ca-Mg-HCO3型。地下水中Ca2+和Mg2+浓度较高,主要的阴离子为Cl−和
SO2−4 。湿季地下水中DOM浓度高,促进Fe浓度显著增加。硬度和F的超标率较高,DOM较高且受季节影响较大,硬度、F和DOM是地下水的主要问题。2) 斯里兰卡CKDu病区地下水中DOM主要为自生源,芳香性和腐熟化程度较低,主要为富里酸、腐殖酸和小分子蛋白质类物质。干季高温条件下DOM中可生物利用部分发生分解,干季地下水中腐殖质分解成富里酸和多环芳烃类腐殖酸,蛋白质分解成小分子蛋白和氨基酸,小分子络氨酸/赖氨酸的浓度增加。MR区DOM与其他区域存在显著差异,湿季时主要为类富里酸和浮游植物产生的蛋白质类,主要原因是其湿季时微生物活性较高;干季时腐殖酸含量更高且相对分子质量更大。
3) 斯里兰卡CKDu病区地下水中常规指标与发病率无显著相关性,但F−浓度、DOM芳香性、疏水性、稳定性与组成复杂度随CKDu发病风险提高而增加,有机无机组成的耦合可能是发病率升高的重要原因。硬度、F和有机物是斯里兰卡CKDu病区地下水源饮用水安全保障的重要影响因素。
4) 根据斯里兰卡CKDu病区地下水质特征,设计了“活性炭吸附-阴离子交换除氟-阳离子交换软化-NF-臭氧/紫外消毒”深度处理地下水的工艺,以期为当地提供安全的饮用水保障。


 DownLoad:

 /(mg·L−1)
 /(mg·L−1)
 /(mg·L−1)
 /(mg·L−1)


