-
磷是水生植物和藻类生长的主要营养元素之一,也是水域重要的污染物,主要随河川径流进入水体[1-2]。水体中磷污染主要为外源污染,即农田径流引起的磷输出、工业废水的磷排放和生活污水的直接输入[3]。内源污染主要为沉积物的释放和死亡生物体分解[4]。磷元素进入河流湖泊中,主要在水体-沉积物之间进行迁移转化[5],水体和沉积物存在吸附-释放动态平衡,一部分污染物可通过沉淀或吸附作用进入沉积物,当水体水质改善时,沉积物中磷会向上覆水体释放,成为影响水质的二次污染源[6-8]。磷过量输入会导致水体富营养化、水体缺氧等一系列环境效应,最后形成恶性循环,对生态系统结构和功能造成威胁[9-11]。
汾河作为山西主要的水源之一,其水质状况关系到整个流域水质安全。近年来,对汾河流域健康评价和富营养化研究较多,但对磷污染赋存特征和污染物解析的研究相对较少。本研究以磷为研究指标,通过测定水体中总磷(TP)、有机磷(OP)、无机磷(IP)浓度和沉积物中总磷浓度,探讨汾河流域磷的分布情况和赋存形态。同时采集不同类型排污口样品测定其磷的含量及形态,在此基础上构建SWAT模型,探讨汾河流域磷的污染来源。研究结果以期为汾河流域的水环境治理提供技术依据。
-
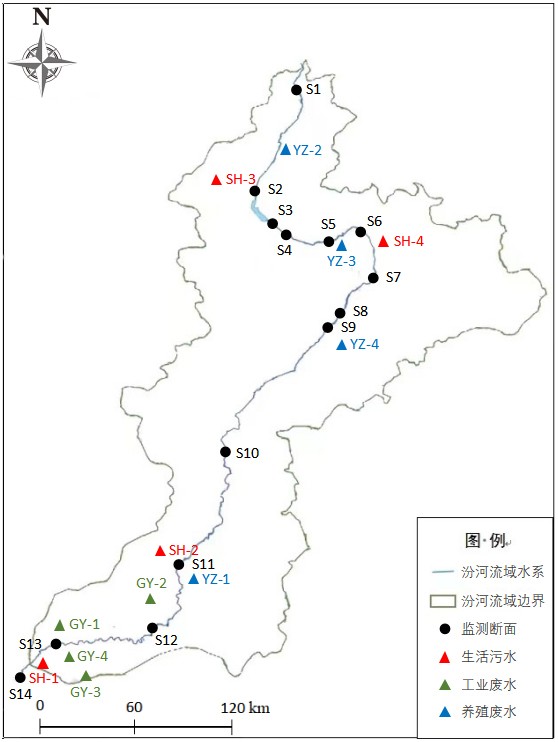
2020年8月,本研究在汾河干流布设14个监测断面和12个典型排污口,见图1。
具体监测断面和排污口名称为:雷鸣寺(S1)、河西村(S2)、汾河水库(S3)、李八沟(S4)、扫石桥(S5)、上兰(S6)、小店桥(S7)、温南社(S8)、杨乐堡(S9)、王庄桥南(S10)、临汾(S11)、上平旺(S12)、河津大桥(S13)、庙前村(S14)。
下游某鱼塘(YZ-1)、上游某鱼塘(YZ-2)、汾河二库鱼塘(YZ-3)、祁县某鱼塘(YZ-4)、万荣某污水处理厂出口(SH-1)、临汾某污水处理厂出口(SH-2)、岚县某污水处理厂出口(SH-3)、太原某污水处理厂出口(SH-4)、河津市某企业(GY-1)、襄汾县某企业(GY-2)、盐湖区某企业(GY-3)、万荣县某企业(GY-4)。
依据《水质采样技术指导:HJ 494—2009》[12]采集水体和沉积物样品。水样采集混合水样,采集后放入冷藏箱保存,送回实验室后24 h内分析完毕,总磷测定采用《水质 总磷的测定 钼酸铵分光光度法:GB 11893—89》[13],有机磷测定采用《水和土壤质量 有机磷农药的测定 气相色谱法:GB 14552—93》[14];沉积物封装在干净的自封袋中低温保存,并在实验室内完成冷冻、干燥、研磨过筛(0.149 μm)等预处理工作,沉积物总磷测定采用《土壤 总磷的测定 碱熔-钼锑抗分光光度法:HJ 632—2011》[15]。
-
在一定条件下,水体中的总磷在沉积物-水体中达到分配平衡时,可以用分配系数Kp表示[16],见式(1):
式中:Kp为沉积物-水分配系数,L·kg−1;cs为沉积相中总磷浓度,mg·kg−1;cw为水相中总磷浓度,mg·L−1。
-
文中监测数据使用Excel 2016进行汇总处理,采用Origin 2017和SPSS 27软件完成制图与分析。
-
收集汾河流域国考断面2010—2019年的总磷数据,选择汾河水库出口、义棠、新绛作为上游、中游、下游代表断面,对汾河流域2010—2019年总磷变化进行分析。总体来看,总磷在上游断面持续保持低位,水质可达到II类考核目标值;中游断面年际变化在2010年到2012年处于下降趋势,之后逐年上升,在2016年增至最大之后开始回落,近年虽有下降趋势,但仍长期处于超V类状态;下游断面年际变化趋势与中游相同,但总体可达标,仅在2016年超V类。汾河流域2010—2019年总磷逐年变化特征,见图2。
-
对2020年采集的数据进行分析可知,汾河流域水体中总磷浓度在0.011~0.433 mg/L,平均值0.187 mg/L,无机磷浓度在0.000~0.304 mg/L,平均值0.093 mg/L,有机磷浓度在0.011~0.295 mg/L,平均值0.094 mg/L。从空间分布来看,水体中总磷总体呈现上游低位,中下游浓度高的特点,相较2010—2019年,汾河流域总磷污染状况有所好转,除了S13和S14磷含量超过V类考核目标值以外,其余断面水质均满足2020考核目标值。有机磷在流域上游及太原小店桥断面占比较高,中下游流域有机磷、无机磷占比相当,这主要是因为上游地区农业生产和畜禽养殖比较集中,含磷农药的使用和畜禽粪尿的排放导致汾河上游地区有机磷占比较高,中下游地区工业发展沿河集中,农业生产规模化,废水排放的无机磷和有机磷无明显差异。
沉积物中总磷的含量范围为63.9~492 mg/kg,平均值为257 mg/kg。按金晓丹等[17]对沉积物磷污染的分类标准(轻度污染水平TP<700 mg/kg),汾河流域沉积物磷污染属于轻度污染。其中S1和S3两个断面沉积物总磷负荷较重,主要是因为这两个断面水流相对静止,外源输入的磷在沉积物-水中转化频繁,最终富集在沉积物中。另外S8、S9、S11、S12和S13几个断面的沉积物总磷负荷也相对较重,这些断面水体中总磷含量较高且水体流速相对较缓,这也加快了水体中总磷向沉积物的富集。
汾河流域水体中总磷、形态磷及沉积物中总磷的浓度,见表1。
-
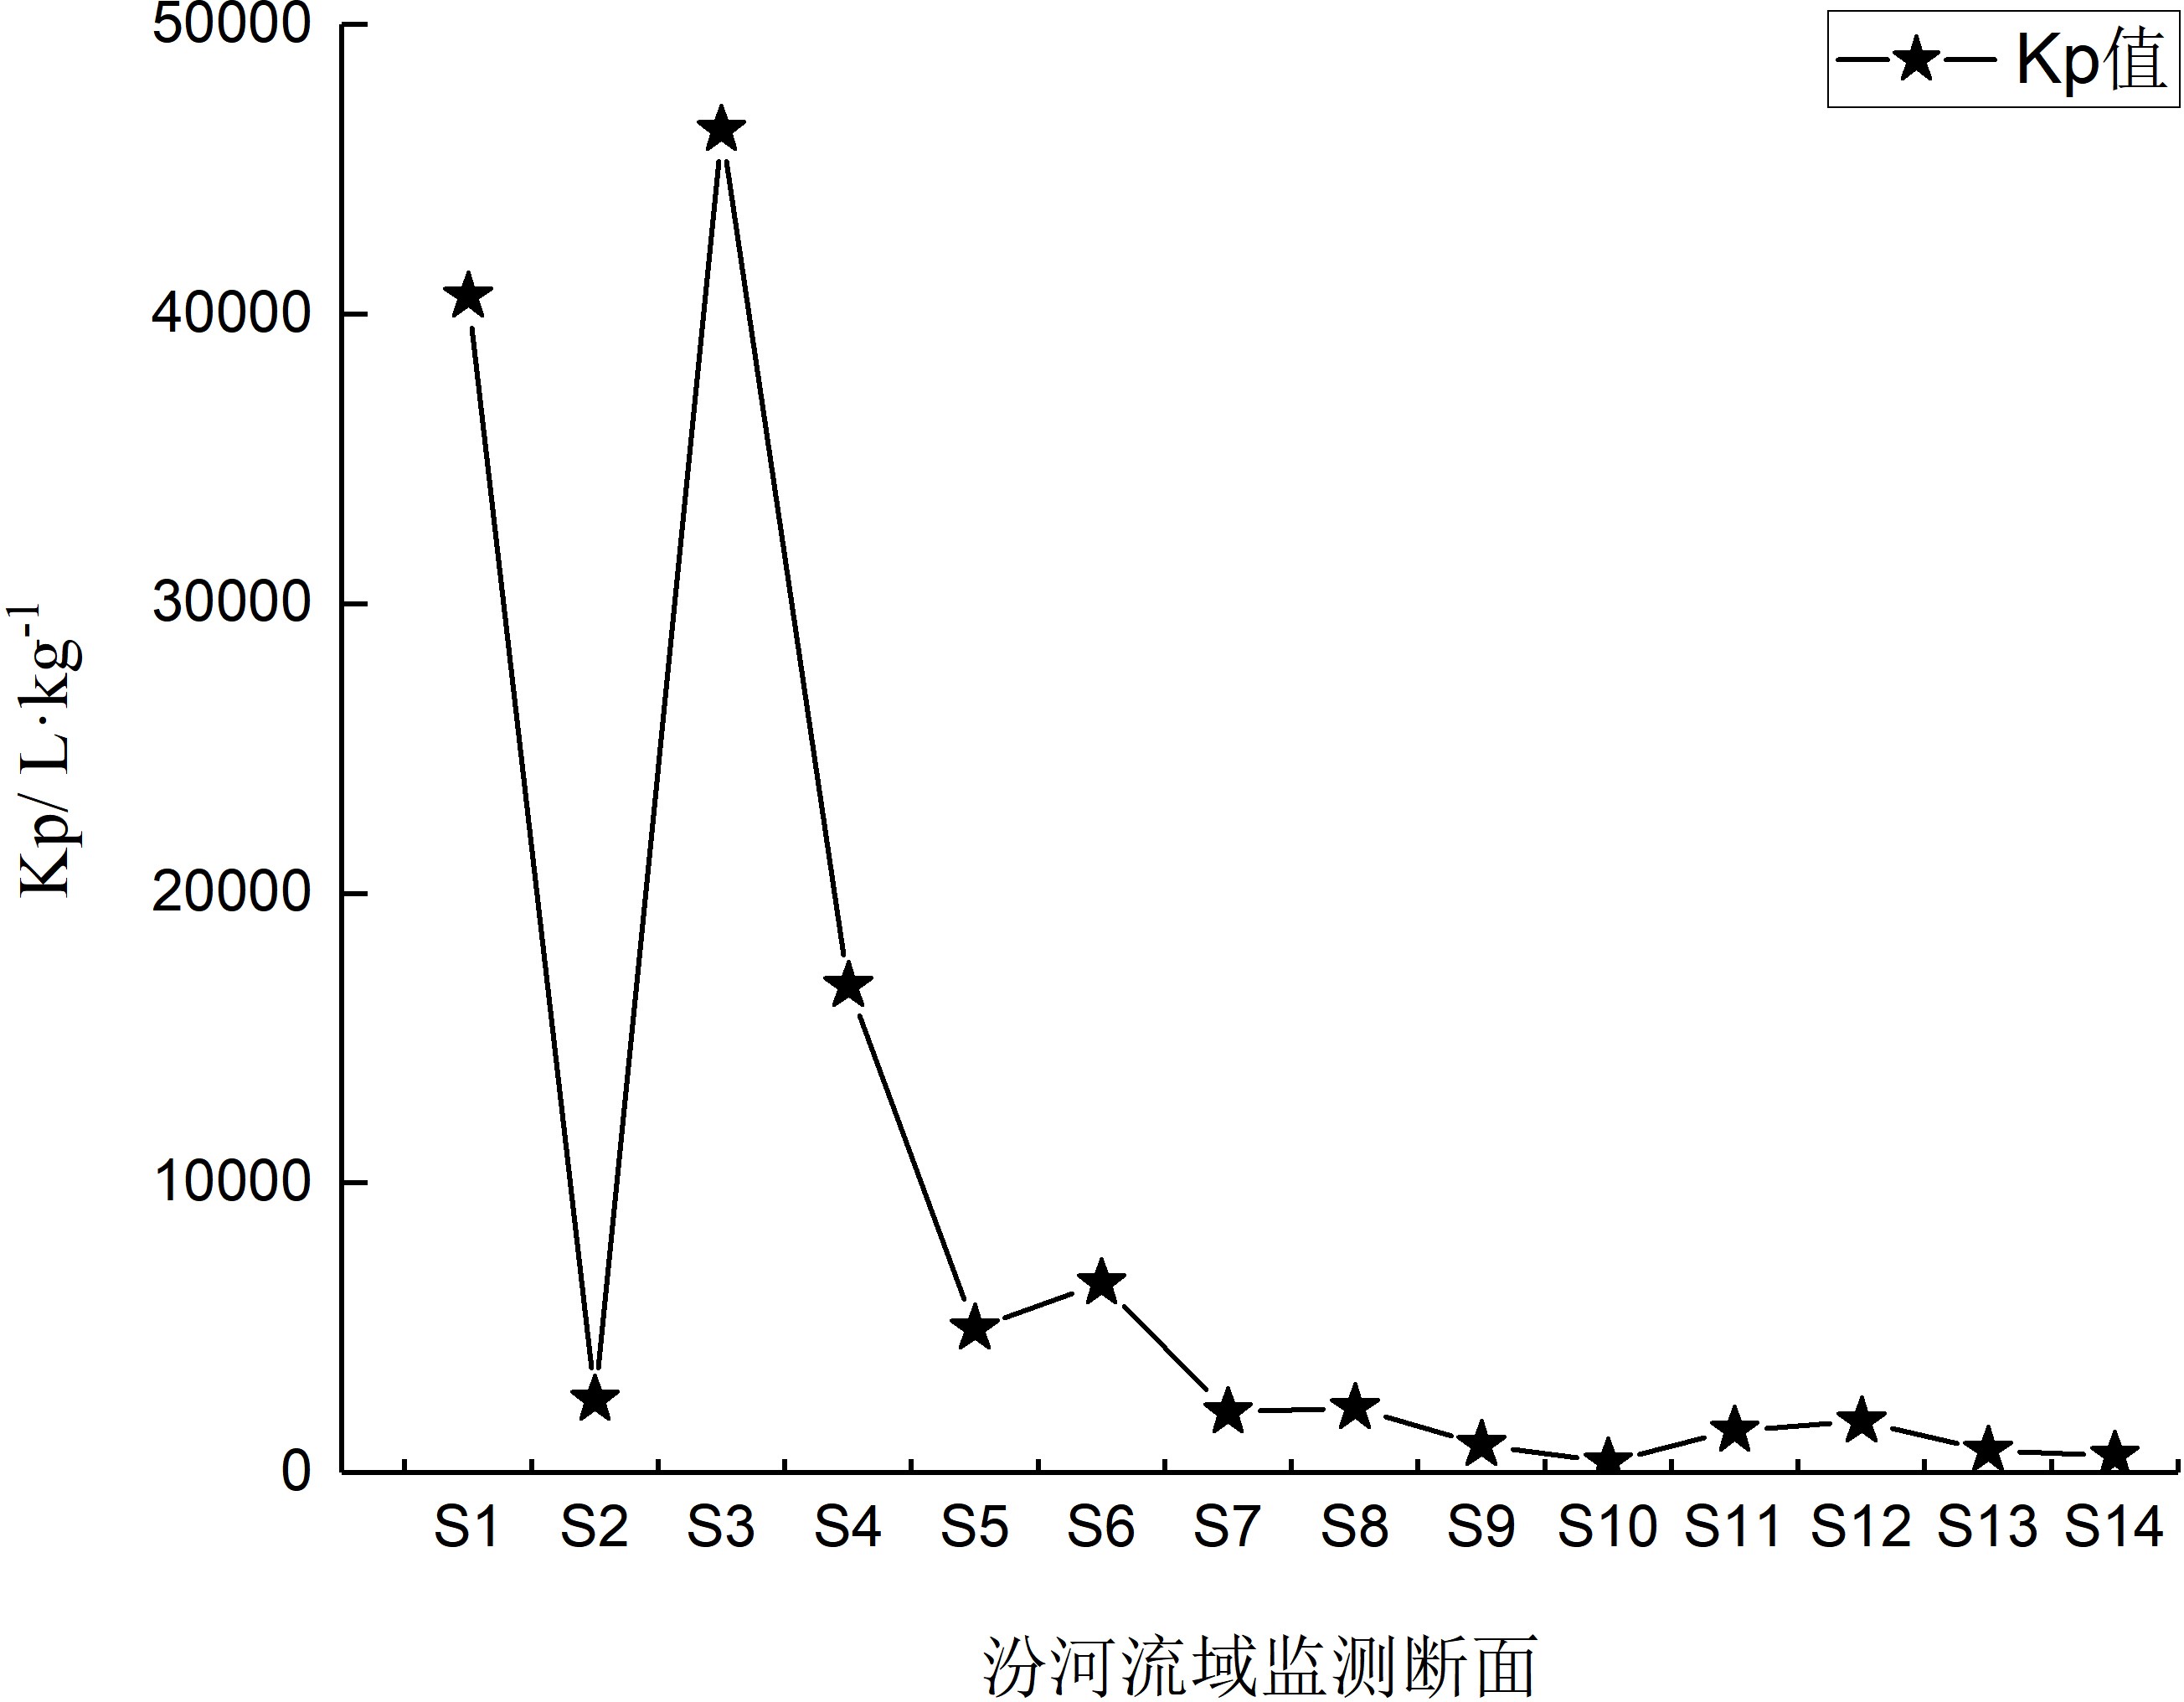
通过对汾河流域总磷含量研究可知,总磷在不同介质中的分布存在差异性,为更好地了解汾河流域总磷在沉积物和水体中的分布状况,采用分配系数Kp对其进行表征。通过计算,汾河流域总磷的Kp值在313~36182 L/kg,各断面分配系数,见图3。
图3可知,汾河流域中下游区域Kp值普遍偏低,这可能与汾河下游较高的流量有关。S1和S3的Kp值相对较高,最高点为S3,此处作为汾河水量的主要调配区,水质在进入库区后有相对静置、稳定的过程,可使其有充分的时间交换进入沉积物中致使其分配系数极高。其次,根据分配理论,在沉积物-水体系中,吸附疏水性有机化合物的主要是沉积物中有机质[18],根据同期测量有机质数据可知,沉积物有机质含量与Kp系数在0.05级别呈显著正相关,相关系数为0.622,说明沉积物中有机质含量的高低影响有机磷在沉积物中的沉积作用,从而使其分配系数偏高。
-
选取汾河流域典型排污口进行调研,包括生活污水、工业废水及养殖废水等,采样分析磷的含量及形态分布特征,见图4。
通过调查分析可知,生活污水排放口磷含量范围在0.412~1.157 mg/L,其中无机磷含量范围在0.029~0.633 mg/L,有机磷含量范围在0.347~0.695 mg/L;养殖废水磷含量范围在0.213~0.621 mg/L,其中无机磷含量范围在0.013~0.127 mg/L,有机磷含量范围在0.191~0.608 mg/L;工业废水磷含量相对偏低,浓度范围为0.167~0.411 mg/L,其中无机磷含量范围在0.018~0.116 mg/L,有机磷含量在0.134~0.298 mg/L。对其形态进行分析可知,养殖业和工业废水中磷的形态以有机磷为主,生活污水则含量相当,其中SH-1和SH-2为汾河下游的污水处理厂,以无机磷为主,而SH-3和SH-4则为上、中游的污水处理厂,以有机磷为主,这主要与沿河的支柱产业密切相关。
-
结合汾河流域的气象资料数据库、DEM数据、土地利用数据、土壤数据库、水文数据、污染源数据和农业管理数据等数据构建SWAT模型,并以添加点源的方式输入此次调查的典型排污口数据,利用SWAT模型对汾河流域的总磷污染现状及污染源进行解析。
收集研究区内2010—2020年月径流数据构建SWAT模型。其中,2010—2017年作为率定期,2018—2020年为验证期,率定期和验证期都符合模型模拟的精度要求。基于模型输出结果,分析汾河流域总磷污染来源,见图5。
图5可知,汾河流域上游磷贡献率从大到小依次为:城镇生活、畜禽养殖、农田排放、农村生活、工业废水,2018—2020年,城镇生活污水排放呈先增加后降低的趋势,总磷贡献率分别占33.0%、67.2%和45.0%;中游磷贡献率从大到小依次为:城镇生活、畜禽养殖、工业废水、农田排放、农村生活,2018—2020年,城镇生活污水排放呈逐年降低的趋势,但降幅不大,总磷贡献率分别占61.8%、57.3%和54.9%;下游磷贡献率从大到小依次为:城镇生活、畜禽养殖、农田排放、工业废水、农村生活,2018—2020年,城镇生活污水排放总体呈下降趋势,总磷贡献率分别为68.1%、58.3%和58.8%。整体来看,城镇生活污水排放是汾河流域产生总磷污染的重要污染源。
-
本文以汾河流域为研究区,从保障水环境角度出发,首先分析了汾河流域水体和沉积物中磷含量、形态及其分配规律,然后基于SWAT模型,分析了流域磷污染来源状况,结果表明:
(1)汾河流域水体中总磷呈现上游浓度低,中下游浓度高的特点,总体污染状况较2010~2019年有所好转;汾河干流上游以有机磷分布为主,中下游有机磷和无机磷占比相当;沉积物中磷含量不高,磷污染属于轻度污染。
(2)总磷在沉积物和水体中的分布状况不同,汾河流域下游沉积物-水分配系数Kp系数普遍偏低,上游特别是流量相对静止、沉积物有机质含量相对较高的汾河水库出口Kp系数较高。
(3)通过构建SWAT模型,分析了汾河流域内总磷的污染来源分布特征,发现城镇居民生活污水排放是汾河流域总磷的重要污染源。
汾河流域磷赋存形态及来源解析
Phosphorus fractions and source analysis in Fenhe River Basin
-
摘要: 汾河是山西省工农业生产和人民生活用水的主要水源,水质质量对整个流域的健康程度起着至关重要的作用,因此解析流域水质及其污染源能为流域水环境治理和管理提供基础数据和技术支持。文章以汾河流域为研究区,通过现场实测结合模型构建,分析汾河流域磷污染的赋存特征,量化汾河流域磷的污染来源。结果表明:汾河流域水体总磷浓度范围在0.011~0.433 mg/L,平均值0.187 mg/L,上游磷含量满足水质Ⅱ类考核指标,中下游基本满足Ⅳ类考核指标;汾河流域水体中无机磷浓度在0.000~0.304 mg/L,平均值0.093 mg/L,有机磷浓度范围在0.011~0.295 mg/L,平均值0.094 mg/L,其中上游以有机磷为主,中下游有机磷、无机磷占比相当,这与沿河产业分布密切相关。沉积物中磷含量为63.9~492 mg/kg,平均值为257 mg/kg,属于轻度污染。总磷的沉积物-水分配系数为313~36182 L/kg,总体呈现上游高下游低的趋势,特别是流量相对静止、沉积物有机质含量相对较高的汾河水库出口Kp较高。利用SWAT模型对汾河流域的总磷污染现状及污染源进行解析,城镇居民生活污水排放是汾河流域总磷的重要污染源。Abstract:
Fen River was the main source of water for industrial and agricultural production and people's living in Shanxi Province. The water quality played a crucial role in the health. Therefore, the analysis of the water quality and its pollution sources can provide basic data and technical support for water environment management and management in the basin.The paper analyzed the phosphorus fractions and quantified the source of phosphorus pollution in Fenhe River basin through field measurement and model construction.The results showed that the concentration of total phosphorus in fenhe River basin ranged from 0.011 mg·L−1 to 0.433 mg·L−1 with an average of 0.187 mg·L−1,the content of phosphorus in upper reaches meet standard Ⅱ and the lower reaches meet standard Ⅳ.The concentration of inorganic phosphorus in fenhe River basin ranged from 0.000 mg·L−1 to 0.304 mg·L−1 with an average of 0.093 mg·L−1, and the concentration of organic phosphorus ranged from 0.011 mg·L−1 to 0.295 mg·L-−1 with an average of 0.094 mg·L−1,Organic phosphorus was dominant in the upper reaches and the proportion of organic phosphorus and inorganic phosphorus was similar in the middle and lower reaches, which was closely related to the industrial distribution along the river in the lower reaches.The phosphorus content in sediments ranged from 63.9 mg·kg−1 to 492 mg·kg−1 with an average of 257 mg·kg−1,which belonged to mild pollution.The sediment-water distribution ranged from 313 L·kg−1 to 36182 L·kg−1, with a general trend of high in the upper reaches and low in the lower reaches, especially in Fenhe Reservoir, where the flow was relatively static and the sediment organic matter content was relatively high.The Soil and Water Assessment Tool (SWAT) model was used to analyze the present situation and pollution sources of total phosphorus in Fenhe River Basin, the results showed that urban sewage discharge was an important source of phosphorus pollution in Fenhe River basin. -
Key words:
- Fenhe River Basin /
- phosphorus /
- fractions /
- sources analysis
-

-
表 1 汾河流域水体和沉积物中磷含量
断面 水体总磷/mg·L−1 水体无机磷/mg·L−1 水体有机磷/mg·L−1 沉积物磷/mg·kg−1 沉积物有机质/mg·kg−1 2020目标值/mg·L−1 S1 0.014 0.002 0.012 492.0 30.75 0.1(Ⅱ类) S2 0.022 0.000 0.022 63.9 9.50 0.1(Ⅱ类) S3 0.011 0.000 0.011 398.0 19.42 0.1(Ⅱ类) S4 0.014 0.000 0.014 162.0 4.65 0.2(Ⅲ类) S5 0.046 0.006 0.040 210.0 9.52 0.2(Ⅲ类) S6 0.015 0.000 0.015 78.3 3.66 0.1(Ⅱ类) S7 0.312 0.013 0.295 97.7 15.33 0.4(Ⅴ类) S8 0.202 0.116 0.086 363.0 12.22 0.4(Ⅴ类) S9 0.377 0.285 0.092 366.0 16.18 0.4(Ⅴ类) S10 0.303 0.121 0.182 134.0 11.26 0.4(Ⅴ类) S11 0.205 0.071 0.134 309.0 17.69 0.4(Ⅴ类) S12 0.259 0.203 0.056 386.0 9.13 0.4(Ⅴ类) S13 0.433 0.181 0.252 347.0 11.34 0.4(Ⅴ类) S14 0.410 0.304 0.106 198.0 12.80 0.4(Ⅴ类) 平均值 0.188 0.093 0.094 257.0 — — -
[1] 唐小娅, 童思陈, 黄国鲜, 等. 三峡水库总磷时空变化特征及滞留效应分析[J]. 环境科学, 2020, 41(5): 2096 − 2106. doi: 10.13227/j.hjkx.201911073 [2] KUWAYAMA Y, OLMStTEAD S M, WIETELMAN D C, et al. Trends in nutrient-related pollution as a source of potential water quality damages: A case study of Texas, USA[J]. Science of the total environment, 2020, 724(prepublish): 137962. [3] 蔡雅梅. 汾河临汾段典型河岸带氮磷时空分布规律及其影响因素研究[D]. 西安: 西安理工大学, 2021. [4] 秦伯强, 朱广伟, 张路, 等. 大型潜水湖泊沉积物内源营养盐释放模式及其估算方法——以太湖为例[J]. 中国科学:D辑:地球科学, 2005, 38(增2): 33 − 44. [5] 车霏霏, 陈俊伊, 王书航, 等. 南湖水系水-沉积物磷时空分布、影响因素及控制对策[J]. 环境工程技术学报, 2020, 10(06): 928 − 935. doi: 10.12153/j.issn.1674-991X.20200068 [6] 蔡梅, 陆志华, 王元元, 等. 太湖不同介质中磷的污染特征及其治理启示[J]. 环境科学, 2022, 43(5): 2575 − 2585. [7] CANTER L W. River water quality monitoring[M]. Boca Raton Chemical Rubber Company Press, 2017, 75(10): 189-239. [8] VOROSMARTY C J, MCINTYRE P B, GESSNER M O, et al. Global threats to human water security and river biodiversity[J]. Nature, 2010, 467(7315): 555 − 61. doi: 10.1038/nature09440 [9] FIELDING J J, CROUDACE I W, KEMP A E S, et al. Tracing lake pollution, eutrophication and partial recovery from the sediments of Windermere, UK, using geochemistry and sediment microfabrics[J]. Science of the total environment, 2020, 722(prepublish): 137745. [10] YANG C H, YANG P, GENG J, et al. Sediment internal nutrient loading in the most polluted area of a shallow eutrophic lake(Lake Chaohu, China) and its contribution to lake eutrophication[J]. Environmental pollution, 2020, 262(prepublish): 114292. [11] 张云霞, 魏峣, 汪涛. 沱江流域河流氮、磷浓度时空分布特征及污染状况评价[J]. 环境污染与防治, 2021, 43(8): 1028 − 1034. doi: 10.15985/j.cnki.1001-3865.2021.08.018 [12] 中国环境监测总站, 辽宁省环境监测中心站, 环境保护部科技标准司. 水质 采样技术导则HJ 494—2009[S]. 北京: 中国环境科学出版社, 2009. [13] 北京市环保监测中心, 上海市环境监测中心. 水质 总磷的测定 钼氨酸分光光度法GB 11893—89[S]. 北京: 中国标准出版社, 1989. [14] 国家环境保护局, 国家质检总局. 水和土壤质量 有机磷农药的测定气相色谱法GB/T 14552—93. [S]. 北京: 中国标准出版社, 1993. [15] . 甘肃省环境监测中心站, 河南省环境监测中心站, 青海省环境监测中心站, 等. 土壤 总磷的测定 碱融-钼锑抗分光光度法HJ 632—2011[S]. 北京: 中国标准出版社, 2011. [16] 王伟. 疏水性有机物污染物在水-土/沉积物体系中的环境行为与归趋[D]. 杭州: 浙江大学, 2011. [17] 金晓丹, 吴昊, 陈志明, 等. 长江河口水库沉积物磷形态、吸附和释放特性[J]. 环境科学, 2015, 36(2): 448 − 456. doi: 10.13227/j.hjkx.2015.02.011 [18] 吴吉春, 张景飞. 水环境化学[M]. 北京: 中国水利水电出版社, 2009: 144. -


 下载:
下载:


