-
大部分时间人在室内度过,室内空气质量对人体健康至关重要。氨气(NH3)在一定浓度下会刺激眼鼻喉,引起头疼、恶心,甚至造成永久性伤害[1]。室内NH3主要与化学品使用、新陈代谢、墙体、家具材料、垃圾堆放等有关[2-7]。尽管NH3背景浓度较低,但在室内进行不同活动(做饭、打扫等)时NH3浓度可上升至较高水平[8]。有调查显示北京某公司办公室NH3浓度高达2—5 mg·m−3,远高于同期室外浓度[9]。全国住宅室内空气污染物调查显示NH3平均含量为122 μg·m−3[10],高于室外环境平均水平,表明室内NH3是大气环境NH3的来源之一。
NH3是大气中最重要的碱性气体,可与大气中的H2SO4和HNO3反应生成(NH4)2SO4、NH4HSO4和NH4NO3等二次无机气溶胶粒子,对霾的形成有很大贡献[11-12]。在我国北方霾高发及污染严重地区已将NH3农业排放削减纳入《2016—2020年大气污染防治计划》。也有研究表明NH3减排减少细颗粒物污染和氮沉降,但会加剧酸雨问题[13],因此需要详细了解NH3排放情况,科学制定NH3减排措施,进而有效地控制颗粒物污染。根据排放清单[14-19],全国氨态氮总排放量为5.9—13.1 Tg·a−1 NH3-N,但各清单均未涉及室内源[14-19]。大多室内NH3的研究是关于畜禽养殖场的[20-21],对非农用建筑的研究相对空白。在室内外NH3的联系上,建立室内外污染物浓度比(indoor to outdoor ratio,I/O)是直观和常用的方法[5, 22-23]。由于室内外NH3均有直接排放源,I/O值的实际作用存在一定的局限性[24]。另外,目前尚无长期、连续监测结果用以研究室内NH3浓度变化特征。
本研究通过在线监测获得室内外NH3的浓度水平,分析其变化特征及相互间的联系,通过建立数学模型估算北京市室内NH3源对大气环境的相对贡献。本工作可对全面控制大气颗粒物污染制定“氨减排”措施提供科学依据,同时可进一步了解NH3对室内空气质量的影响。
-
本研究分别采用澳大利亚Ecotech公司EC9842B型NOx/NH3分析仪和美国 Los Gatos Research 公司 EEA型NH3分析仪进行室内外NH3浓度监测。EC9842B最低检测限低于1.5 μg·m−3。EC9842B一路将空气中的NH3通过氨转化炉在680 ℃左右将NH3转化为NO和少量的NO2,随后通过NO2-NO转换器进一步将NO2转化为NO, NO再用化学发光法测量,得到总Nx(NOx + NH3)的浓度;另一路直接测量空气中的NOx,差减得到NH3的浓度。EAA最低检测限低于0.15 μg·m−3,该仪器基于离轴积分腔输出光谱技术,通过同时测量光腔衰荡时间和通过光腔时间积分光强,使测量结果更符合Beer-Lambert定律,可直接测量环境NH3及水汽含量。于2018年8月23日至26日,在实验室进行了EC9842B和EAA两个分析仪的比对测量,二者相关系数R = 0.949(n = 5316)。利用NH3标准气(北京氦普北分气体工业有限公司)定期对NH3分析仪进行标定,并将室内外仪器观测结果统一到一个标准下。文中氨气浓度值均为标准状态下浓度。此外,室内温度和相对湿度用中国乐享电子公司GSP958温湿度计测量。
室内共监测19个房间氨气浓度,房间类型包括实验室、办公室、厕所、走廊、地上车库、卧室、客厅、厨房等,监测时间主要集中在8月至10月间。室外监测地点为某大学实验楼14楼室外,监测时间为2019年全年。
-
表1为某大学实验楼、某住宅、某公司、某研究所及某研究院等不同建筑内氨气平均浓度。办公室内NH3浓度水平在14.49—254.31 μg·m−3。在大风(雾霾)天气时,办公室内NH3浓度明显低于(高于)室内平均水平,表明室外环境条件对室内NH3浓度有影响。走廊和车库的NH3含量变化幅度相对较大,最大值均超过我国《室内空气质量标准》(GB/T 18883-2002)NH3浓度限值0.2 mg·m−3。燃油机动车辆和人群对城市环境NH3的贡献相对突出[25-26],二者流动情况对NH3浓度分布有一定影响。相邻厕所在通风和非通风状态下NH3浓度分布为68.32 μg·m−3和574.11 μg·m−3,最高可达1.09 mg·m−3,表明室内通风可有效降低室内NH3浓度,在通风状态下厕所是环境NH3的重要排放源。
-
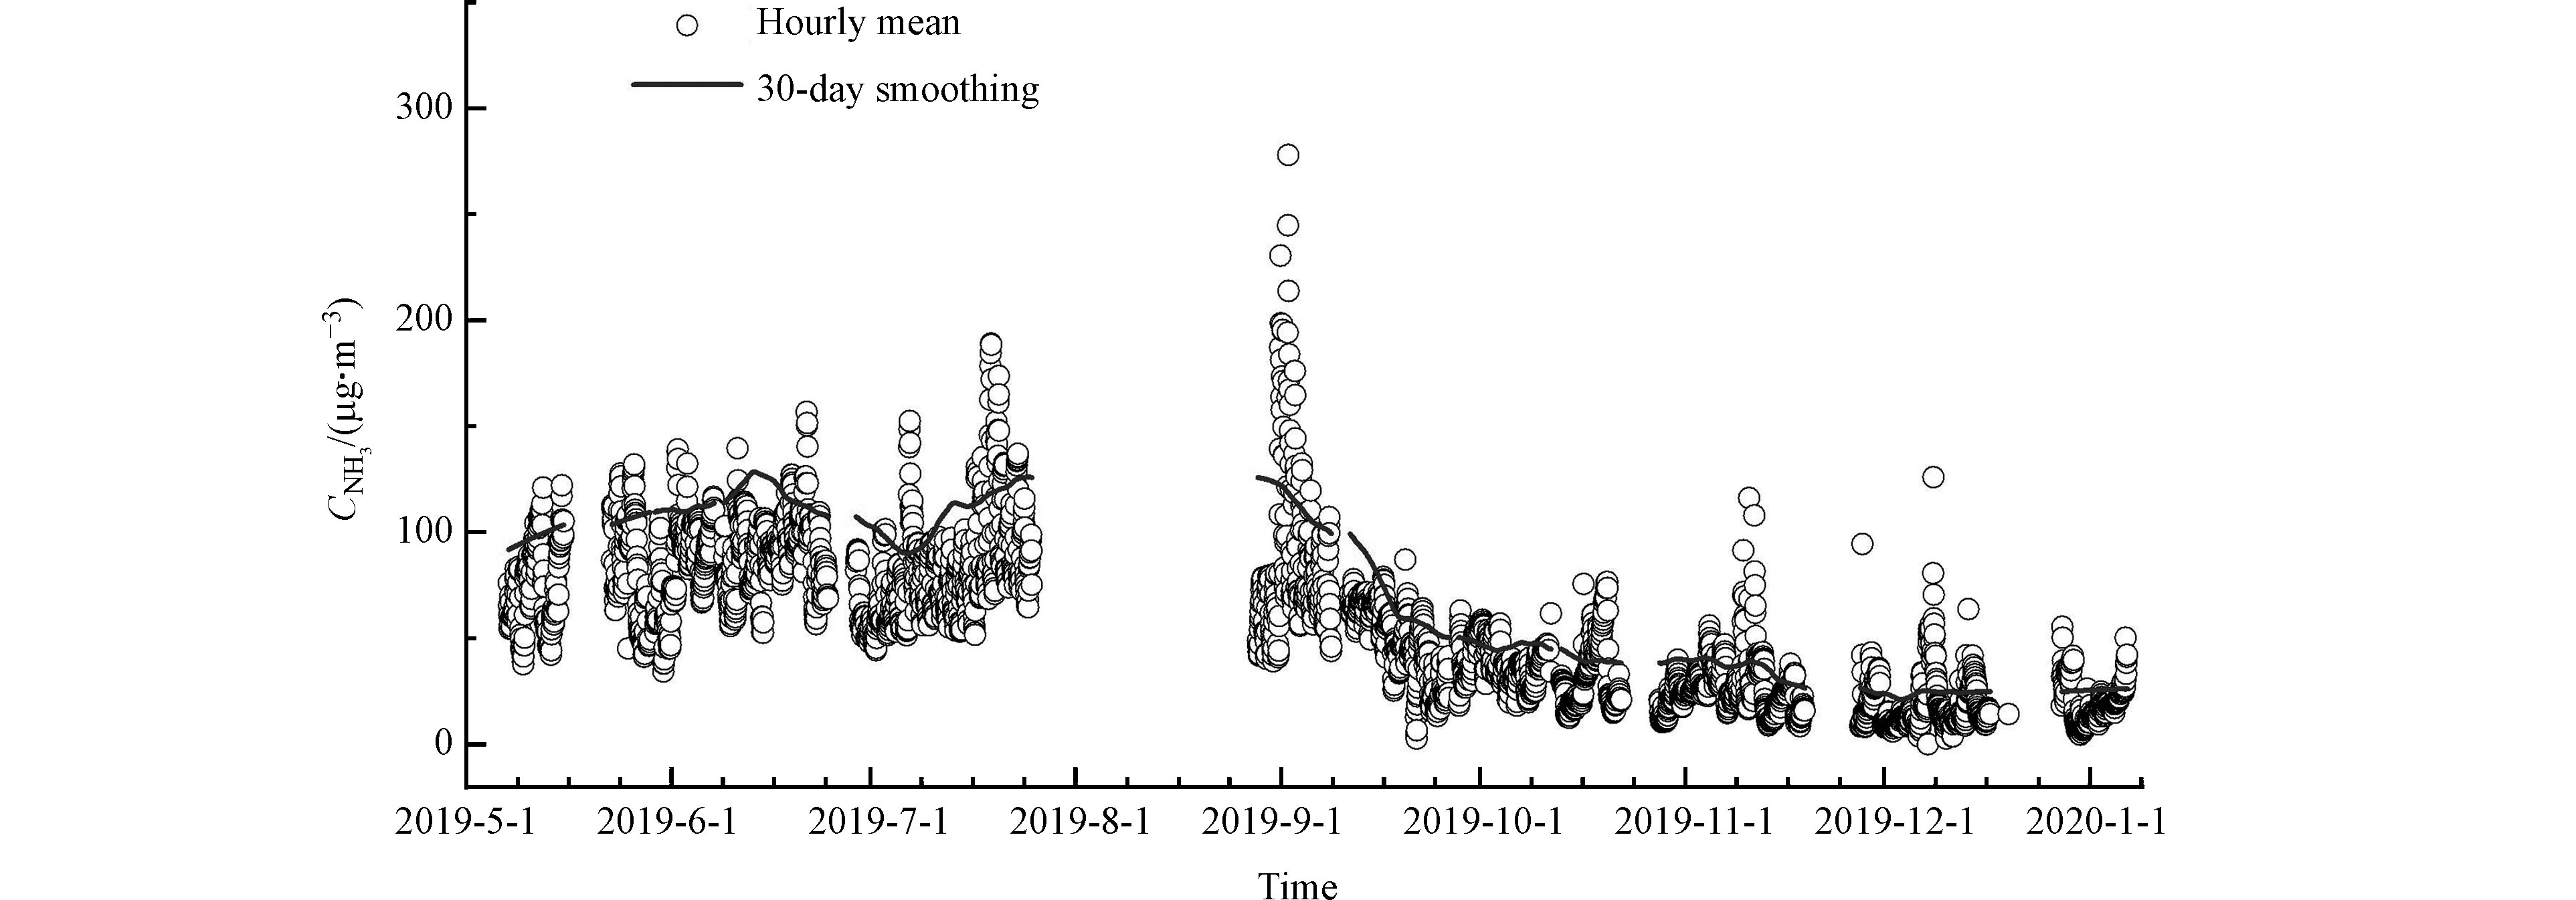
于2019年5月7日至2020年1月6日间在某大学实验楼14层房间监测了室内NH3浓度及温湿度。NH3小时均值浓度时间序列变化如图1所示,共获得3946个有效小时平均值,其中7月25日至8月28日间有较长数据缺失。NH3浓度在10月后明显下降。10月前后,NH3小时平均浓度变化范围分别为2.6—277.9 μg·m−3和2.6—125.9 μg·m−3,平均浓度(±1σ)分别为(76.9±28.4) μg·m−3和(25.7±14.6 )μg·m−3。图2是NH3含量及温湿度逐月变化,三者之间变化特征基本类似。6月NH3浓度(89.8 μg·m−3)为12月(17.7 μg·m−3)的5.1倍。该楼在5月至9月在每天早7:00至晚10:00间开启中央空调(带新风机组),这在一定程度上降低室内温度和相对湿度,同时新风换气在一定程度上促进了室内外空气流通。室内存在的大量吸附比表面积,使得在室外处于挥发态的气体在室内可处于半挥发态[27]。温度高有助于表面吸附NH3的挥发,5月至9月室内温度和相对湿度高于其他月份, 因此在5月至9月室内NH3浓度相对较高。
分别选取5月7日至6月7日和11月27日至12月18日NH3及温/湿度数据匹配齐全的时间段进行日变化特征分析,结果如图3所示。这两阶段分别代表暖季和冷季,暖季会开启中央空调制冷。从图3可以看出,暖季和冷季室内NH3的平均日变化差异较大,暖季表现为夜晚高白天低,但冷季则相反。暖季NH3从08:00开始下降,至19:00达到最低。冷季NH3从08:00逐渐上升,至18:00达到峰值,其中在09:00至11:00有个次高峰。从平均日变化上看,暖季NH3浓度自然对数值与温度呈显著线性负相关(R2=0.71,α=0.01),与RH呈显著正相关(R2=0.89,α=0.01);冷季NH3浓度自然对数值与温度呈显著正相关(R2=0.64),但与RH相关性相对较弱(R2=0.23,α=0.05)。温度高有助于室内物质表面吸附NH3的解吸和挥发、含氨化学品和氨盐气溶胶的分解[22, 28],NH3浓度与室内温度呈现指数关系,这与前人的研究结果一致[29-30]。在自然通风下,室内NH3受吸附动力学控制,即温度变化主导[8],白天温度高促进NH3的解吸,导致冷季白天NH3整体浓度高。此外,NH3在中午浓度下降可能与楼内人为活动降低有关,早晚2个峰值也可能受早晚高峰排放的影响。在空调开启阶段和楼内人为活动增强会促进室内空气流通及室内外空气交换,有利于白天室内NH3稀释扩散[2],使得白天室内NH3浓度下降。另一方面,空调开启后的降温、降湿效应也导致室内NH3排放的下降。
-
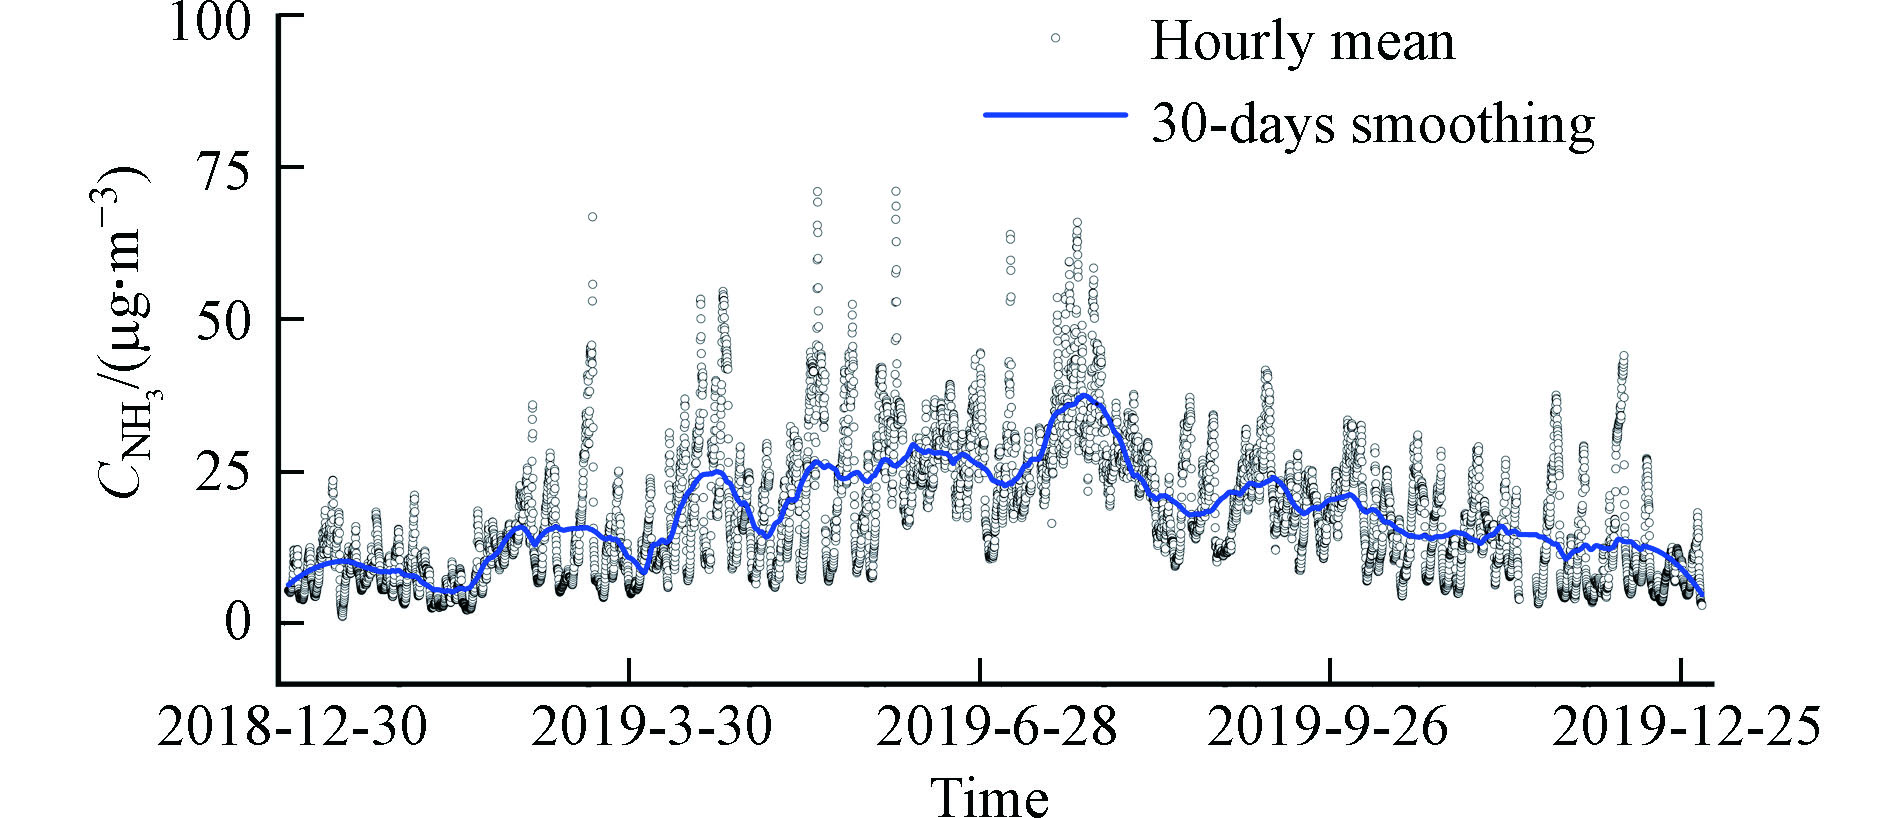
室外氨气浓度时间序列变化如图4所示,共获得了8543组小时均值数据。室外NH3平均浓度(±1σ)为(17.90±10.78) μg·m−3,月均值变化范围为8.18—30.71 μg·m−3。对比其它研究(表2)发现北京地区NH3浓度水平处于相对高的区域,高于诸如上海、南京、广州等南方地区。这可能与地区土壤类型及土地利用不同有关。北京等华北地区主要以旱地碱土为主,且是农业密集生产区[31];而上海等地则以稻田酸性土为主[32]。通常碱性土壤内NH3含量高,排放量大,导致北京等地环境NH3浓度较高。
图5是室外NH3与水汽的月均值浓度变化。室外NH3浓度呈现夏季(25.15 μg·m−3)最高、其次是春季(20.74 μg·m−3)和秋季(17.90 μg·m−3)、冬季(14.83 μg·m−3)最低的特征。夏季室外温度高有利于农田NH3的挥发、家畜废弃物分解及动植物、垃圾填埋场及土壤NH3等的排放[33,42]。NH3和水汽含量季节变化十分相近,二者呈显著的正相关(R2=0.86,α=0.01)。有研究表明相对较高的初始含水量和相对湿度会促进尿素分解,导致较大的氨态氮肥损失[43]。因此,在较高水汽含量条件下NH3排放量增加,水汽含量是控制NH3浓度动态变化的重要因素之一。
-
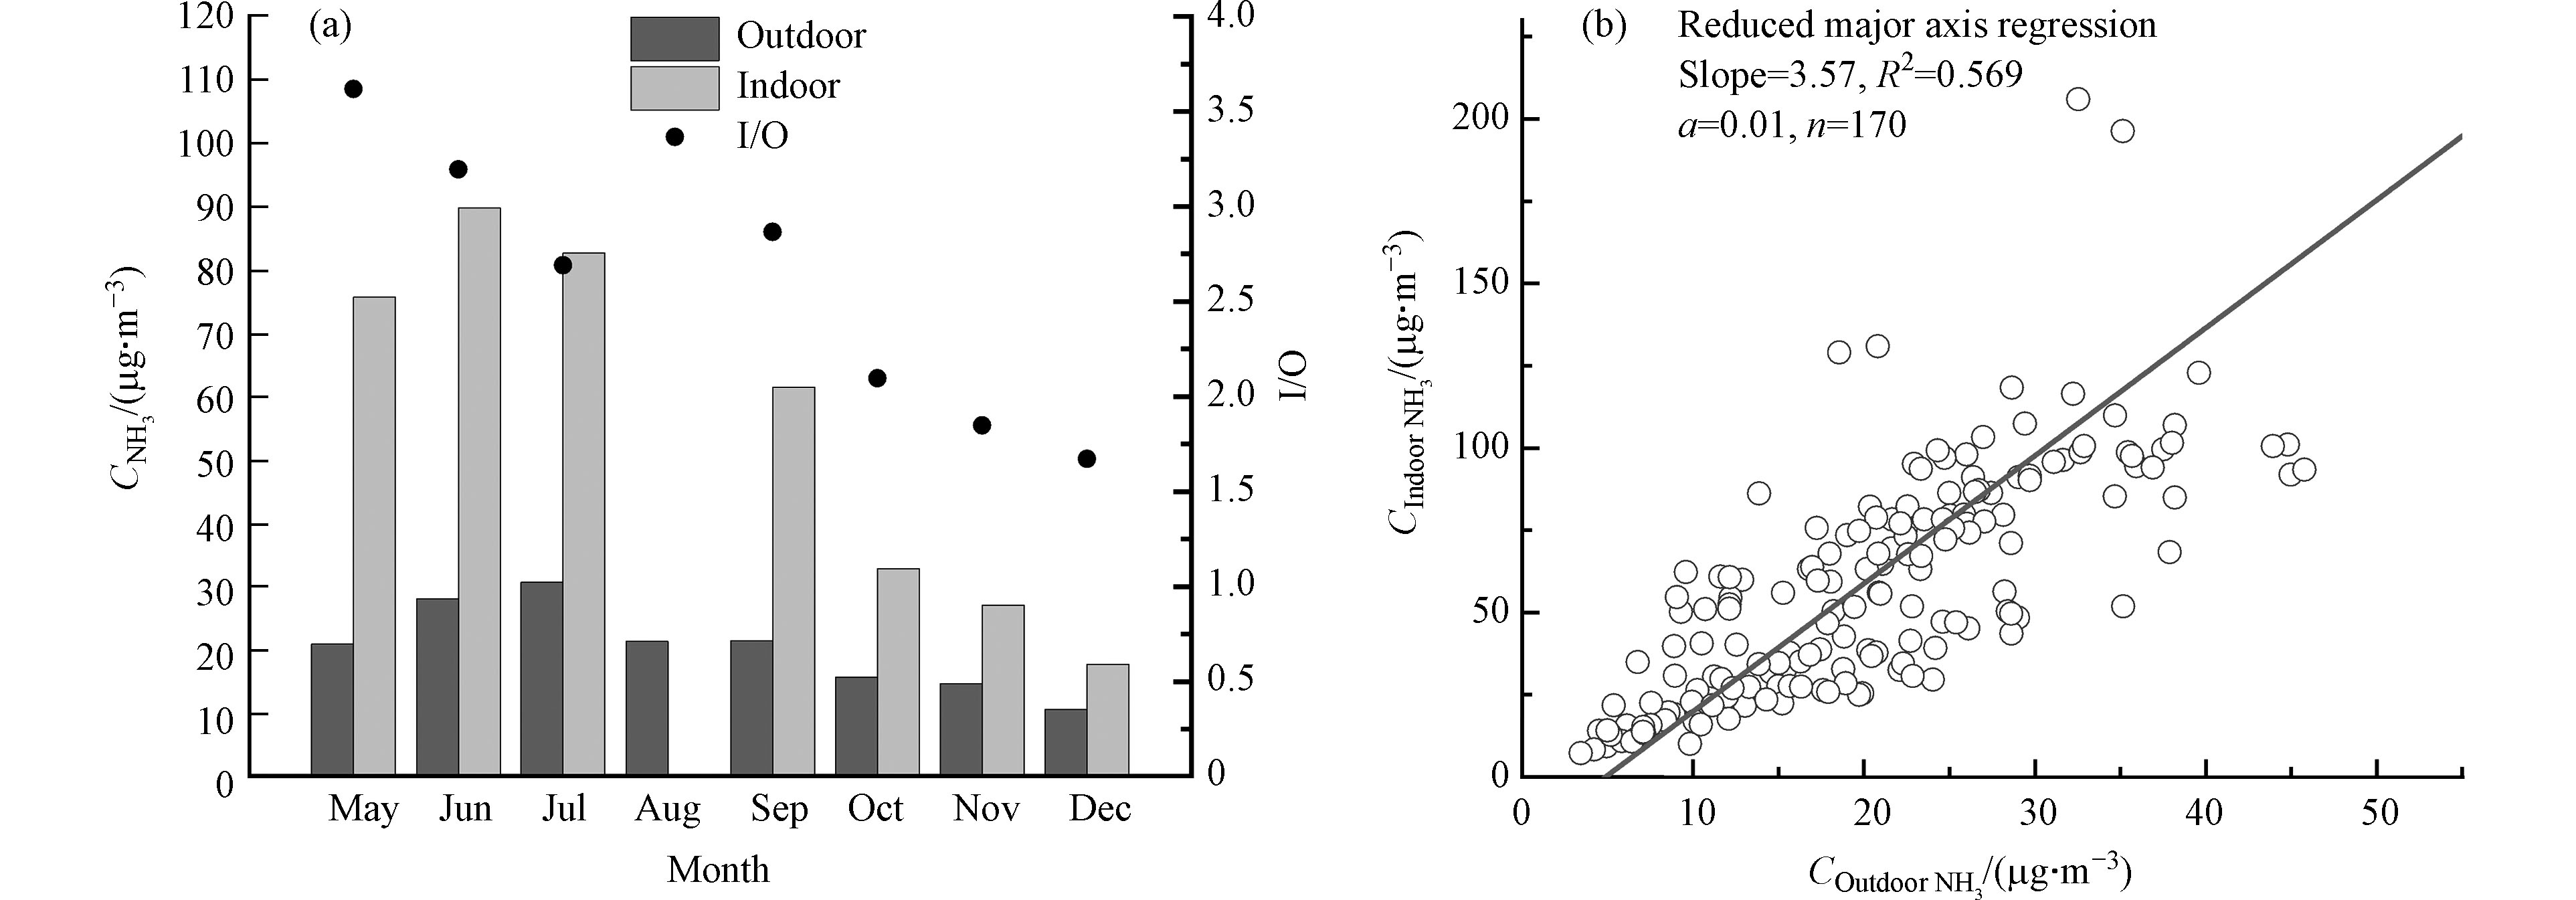
图6a是2019年5月至12月室内外NH3月均值浓度及其I/O比值变化,图6b是通过压轴回归法拟合室内外NH3日均值浓度间的相关性。
室内外NH3均表现为夏季高、冬季低的特点,且室内外NH3日均值浓度间呈现显著正相关(斜率=3.57,R2=0.569,α=0.01)。室内外NH3浓度显著的相关性表明室内外环境空气的互联性,室内空气受到室外大环境的影响,二者表现出了一定的相关性。但室内NH3浓度始终高于室外,最大日较差为110.20 μg·m−3,其中I/O值在5月最高,为3.62。表明室内NH3始终是环境空气中NH3的一个源。从图6b拟合方程斜率值可得到室内NH3浓度平均要比室外高出257%(3%—595%)。不过,室内外NH3均存在各自的直接排放源,如室外NH3主要受动物、固氮植物及化肥等排放源影响[14],室内主要受化学品使用、人体新陈代谢、墙体等影响[2-5],这会在从一定程度上削弱了二者的相关性。
从平均日变化特征上看,暖季室内外NH3日变化均呈现先上升后下降的特征(图7a)。区别在于在NH3累积上升阶段,室内NH3增幅相对均匀平缓;室外NH3在日出前后含量快速上升,晚上增幅较为平缓。冷季室内外NH3日变化相差较大,室内NH3白天高晚上低,而室外则相反。室内NH3白天出现2个峰值,第1个峰值出现在10:00,与室外NH3早上峰值出现时间一致;第2个峰出现在17:00, 比室外NH3傍晚峰值(19:00)出现的早,在17:00后逐渐下降,在早上8:00达到最低。室外NH3在经晚上积累后在10:00达到峰值,白天经稀释快速下降,在14:00—16:00出现低值。
-
本研究利用浓度平衡法[44]确定室内通风换气量,其计算公式为如下:
其中,L为通风换气量,m3·s−1;y为某一时刻室内NH3浓度,g·m−3;y0为室外空气NH3浓度,g·m−3;dt为某一无限小时间间隔,s;dy为dt时间内室内向室外排放的NH3浓度增量,g·m−3;dE为dt时间内室内向室外排放的NH3量,g;N为单位时间换气次数,h−1;V为房间体积,m3。
《住宅设计规范》(GB 50096—2011)规定,无集中新风供应系统的住宅室内通风换气次数取1.0次·h−1,实验房间室内体积为60×2.5 m3。北京住房和城乡建设发展白皮书(2019)统计,北京市全部既有民用建筑总量为90376.49万m2。根据实际在线监测的室内外NH3浓度最大的5月和最小的12月的氨气浓度积分计算,得到室内NH3向室外的排放量范围为0.09—1.11 Gg NH3-N·a−1,约占2006年北京市总排放量(71.2 Gg NH3-N)的0.1%—1.5%。与其它排放源相比,室内源的相对贡献远低于畜禽养殖(34.55%)、固氮植物(33.57%)、化肥使用(13.06%)、生活垃圾处理(8.29%)及交通排放(5.20%)等,但与工业排放(0.14%)、生物质燃烧(0.42%)、农用土壤(0.84%)等相对贡献相近[14]。
本研究估算模型仅以某大学实验楼的监测数据为基准,尚不能完全代表北京全部建筑的浓度水平。此外,为方便计算模型采用统一标准通风换气次数,跟实际换气次数可能有较大差异,且每次通风前室内排放是否都达到计算浓度也存在一定的不确定性。尽管该估算结果具有一定局限性,但仍具有一定的科学意义。
-
(1)在同一建筑内不同房间NH3浓度差异较大(从几μg·m−3到 mg·m−3),厕所浓度小时均值可高达1.09 mg·m−3。室内NH3浓度始终高于室外,最大日较差为110.20 μg·m−3,最大月I/O值为3.62。
(2)室内外NH3浓度均表现出夏季高冬季低的特征,日均值浓度之间有显著的相关性。室内NH3浓度与室内相对湿度及温度的日变化之间有很好的相关性,但室内NH3与后二者的相关性在暖季与在冷季截然相反。暖季室内NH3浓度白天低夜晚高,而冷季白天高夜晚低。中央空调开启与否对室内NH3浓度日变化有较大的影响。
(3)室内NH3排放量大致范围为0.09—1.11 Gg NH3-N·a−1,约占北京市总排放量的0.1%—1.5%,与工业、生物质燃烧、土壤等排放量相近,低于交通排放(5.20%)。由于城区集中大部分的建筑,室内NH3对城区大气NH3的直接贡献可能具有一定的意义,值得进一步研究。
室内氨气浓度变化特征及其环境意义
Variations in indoor ammonia concentration and its environmental significance
-
摘要: 通过在线监测北京市海淀区室内和室外氨气(NH3)浓度,以了解室内外氨气含量差异、变化特征及其影响因素。根据监测结果估算室内NH3源对环境大气中NH3的可能贡献,并分析其环境意义。结果表明,室内NH3与室外NH3浓度的季节变化类似,均表现为夏季高、冬季低的特点,其日均值之间具有显著的相关性。室内NH3浓度通常高于室外,NH3日均值浓度室内比室外平均高出257% (3%—595%)。在同一建筑内不同房间里的浓度差异较大(从几μg·m−3到 mg·m−3),厕所间的浓度水平较高(小时均值可高于1.09 mg·m−3)。室内NH3浓度日变化与室内相对湿度及温度的日变化之间具有很好的相关性,但室内NH3与后二者的相关性在暖季与在冷季截然相反。暖季室内NH3浓度白天低夜晚高,而冷季白天高夜晚低。中央空调开启与否对室内NH3浓度日变化有较大的影响。通过建立数学模型估算得到室内NH3源对大气环境中NH3的排放量贡献为0.09—1.11 Gg ·a−1NH3-N,约占北京市总排放量的0.1%—1.5%,与工业、生物质燃烧、土壤等排放量相近,低于交通排放(5.20%)。由于城区集中大部分的建筑,室内NH3对城区大气NH3的直接贡献可能具有一定的意义,值得进一步研究。Abstract: Online measurements of indoor and outdoor ammonia (NH3) were conducted in Haidian district, Beijing, to investigate the indoor-outdoor differences in the NH3 concentration, variation characteristics and influencing factors. The possible contribution of indoor NH3 to ambient air was estimated and its environmental significance was discussed based on the measurement results. Indoor and outdoor NH3 showed similar seasonal variations, with high levels in summer and low in winter, and the daily mean values of indoor and outdoor NH3 were significantly correlated. The level of indoor NH3 were on average 257% higher than those of outdoor NH3, with a range of 3%—595%. Large variations (from several μg·m-3 to mg·m−3) were found in NH3 concentrations in different rooms within a same building, and the highest hourly mean value occurred in a toilet (about 1.09 mg·m−3). In the warm season, the diurnal cycle of indoor NH3 resembled that of relative humidity and reversed that of temperature, showing lower levels during the daytime and higher at night. In the cold season, however, the situations were completely opposite. The central air conditioning was found to greatly influence the diurnal variation of indoor NH3 concentration. The contribution of indoor NH3 to ambient NH3 was estimated using a model to be 0.09—1.11 Gg·a−1 NH3-N, accounting for approximately 0.1%—1.5% of the total emission in Beijing, which is comparable to emissions from industry, biomass combustion, and soil, but lower than that from transportation (5.20%). Due to the dense buildings in urban areas, the direct contribution of indoor NH3 to urban air might have certain significance, which is worth further studies.
-
Key words:
- indoor ammonia /
- outdoor ammonia /
- variation /
- emission
-

-
表 1 北京不同室内NH3平均浓度水平(μg·m−3)
Table 1. Indoor NH3 levels in different areas in Beijing (μg·m−3)
地点
Site房间类型
Room style平均值
Mean标准差
Standard deviation最小值
Min最大值
Max测量时间
Sample time某住宅 厕所 1 87.19 48.77 19.81 130.49 2018.10.5 厨房 62.68 4.45 55.83 69.29 2018.10.3—4 客厅 61.37 25.37 35.96 86.69 2018.10.4 卧室 1 46.22 12.05 32.39 54.48 2018.10.3 卧室 2 64.90 9.77 56.76 88.20 2018.10.5 卧室 3 41.30 8.13 32.89 58.31 2018.10.4 某公司 办公室 1 25.21 12.54 17.60 71.28 2018.2.12—14 53.88 10.11 34.02 79.31 2018.3.29—30 某研究院 办公室 2 254.31 52.17 155.15 320.27 2010.8.9—12a 14.49 2.71 8.74 17.21 2011.3.22-24b 28.36 3.12 23.03 35.45 2011.4.11—12 132.09 6.13 121.65 142.01 2011.6.1—14c 停车场 165.13 57.09 31.97 360.55 2018.8.13—15 某研究所 办公室 3 85.65 19.58 51.77 106.46 2018.8.14—15 办公室 4 84.28 9.14 49.72 94.83 2018.8.15—16 办公室 5 72.09 2.09 67.06 76.46 2018.8.17—20 某大学实验楼 办公室 6 85.54 4.46 71.10 91.95 2018.9.12—13 办公室 7 50.83 10.09 27.96 68.71 2018.9.13—15 办公室 8 58.56 11.64 30.96 69.60 2018.9.11—12 实验室 32.40 7.31 0.00 52.54 2018.9.15—18 厕所 2 68.32 12.64 61.52 117.66 2018.9.19—20 厕所 3d 574.11 334.63 112.65 1087.80 2018.9.18—19 走廊 73.13 45.35 17.07 201.87 2018.9.20—21 注:a.室外为雾霾天气;b.室外为大风天气;c.办公楼内1楼装修;d.厕所未通风.
Notes: a. haze day; b. windy day; c. The first floor in decoration; d. without ventilation.表 2 中国不同城市室外NH3浓度水平
Table 2. Outdoor NH3 concentrations in different cities in China
地点
Site时间
Sample time浓度/(μg·m−3)
Concentration参考文献
Reference北京 2019 17.90±10.78 This study Feb 2008—Jul 2010 14.22±10.62 (2008), 18.13±13.82 (2009) Meng et al., 2011 [33] Jan—Feb 2007, 8 5.51±3.81 (winter), 25.44±6.91 (summer) Lanniello et al., 2010 [34] Jun—Aug 2009 29.79±11.9 Meng et al., 2017[35] 上海 Apr 2014—Apr 2015 5.51±3.91 Chang et al., 2015[26] 2014 4.8±2.0/8.0±4.3/4.3±1.5/2.8±1.0 (spring/summer/autumn/winter) Wang et al., 2018[29] 西安 Apr 2006—Apr 2007 12.92/6.41/20.33 (annual/winter/summer) Cao et al., 2009 [36] 南京 Aug—Sep 2012 1.30±1.80 (industrial area) Zheng et al., 2015 [37] Jul—Aug 2013 6.71 (near road) Wang et al., 2016 [38] 广州 Nov 2010 1.60 Wang et al., 2013 [39] 香港 Oct 2003—May 2006 0.70 (rooftop), 7.11 (near road) Tanner, 2009 [40] 固城 Mar 2016—May 2017 22.2±12.8 Kuang et al., 2019[41] -
[1] AMSHEL C E, FEALK M H, PHILLIPS B J, et al. Anhydrous ammonia burns case report and review of the literature [J]. Burns, 2000, 26(5): 493-497. doi: 10.1016/S0305-4179(99)00176-X [2] BAI Z, DONG Y, WANG Z, et al. Emission of ammonia from indoor concrete wall and assessment of human exposure [J]. Environment International, 2006, 32(3): 303-311. doi: 10.1016/j.envint.2005.06.002 [3] EATOUGH D J, HANSEN L D, LEWIS E A. The chemical characterization of environmental tobacco smoke [J]. Environmental Technology, 1990, 11(11): 1071-1085. doi: 10.1080/09593339009384961 [4] LARSON T, COVERT D, FRANK R, et al. Ammonia in the human airways: neutralization of inspired acid sulfate aerosols [J]. Science, 1977, 197(4299): 161-163. doi: 10.1126/science.877545 [5] ŠIŠOVIĆ A, ŠEGA K, KALINIĆ N. Indoor/outdoor relationship of ammonia concentrations in selected office buildings [J]. Science of the Total Environment, 1987, 61: 73-77. doi: 10.1016/0048-9697(87)90357-3 [6] 王澎. 室内空气质量及污染控制 [J]. 环境科学与技术, 2001(2): 26-27. doi: 10.3969/j.issn.1003-6504.2001.02.008 WANG P. Indoor air quality and pollution control [J]. Environmental Science and Technology, 2001(2): 26-27(in Chinese). doi: 10.3969/j.issn.1003-6504.2001.02.008
[7] 古颖纲, 王伯光, 杨俊, 等. 城市污水厂氨气的来源及排放因子研究 [J]. 环境化学, 2012, 31(5): 708-713. GU Y G, WANG B G, YANG J, et al. Ammonia source and emission factor in municipal wastewater treatment plants [J]. Environmental Chemistry, 2012, 31(5): 708-713(in Chinese).
[8] AMPOLLINI L, KATZ E F, BOURNE S, et al. Observations and contributions of real-time indoor ammonia concentrations during HOMEChem [J]. Environmental Science & Technology, 2019, 53(15): 8591-8598. [9] LINDGREN T. A case of indoor air pollution of ammonia emitted from concrete in a newly built office in Beijing [J]. Building and Environment, 2010, 45(3): 596-600. doi: 10.1016/j.buildenv.2009.07.014 [10] XU D, SHANG B, CAO Z. Investigation of key indoor air pollutants in residence in part of the cities in China [J]. Journal of Hygiene Research, 2007, 36(4): 473-476. [11] NI J Q, HEBER A J, LIM T T, et al. Ammonia emission from a large mechanically-ventilated swine building during warm weather [J]. Journal of Environment Quality, 2000, 29(3): 751-758. [12] SEINFELD J H, PANDIS S N, NOONE K. Atmospheric chemistry and physics: From air pollution to climate change[M]. 2nd. Hoboken, New Jersey, United States: John Wiley & Sons, Inc., 2006. [13] LIU M, HUANG X, SONG Y, et al. Ammonia emission control in China would mitigate haze pollution and nitrogen deposition, but worsen acid rain [J]. Proceedings of the National Academy of Sciences, 2019, 116(16): 7760-7765. doi: 10.1073/pnas.1814880116 [14] HUANG X, SONG Y, LI M, et al. A high-resolution ammonia emission inventory in China [J]. Global Biogeochemical Cycles, 2012, 26: GB1030. doi: 10.1029/2011GB004161 [15] KANG Y, LIU M, SONG Y, et al. High-resolution ammonia emissions inventories in China from 1980 to 2012 [J]. Atmospheric Chemistry and Physics, 2016, 16(4): 2043-2058. doi: 10.5194/acp-16-2043-2016 [16] KLIMONT Z. Current and future emissions of ammonia in China[C]. 10th International Emission Inventory Conference: "One Atmosphere, One Inventory, Many Challenges". US EPA, 2001. [17] KONG L, TANG X, ZHU J, et al. Improved inversion of monthly ammonia emissions in China based on the Chinese ammonia monitoring network and ensemble Kalman filter [J]. Environmental Science & Technology, 2019, 53(21): 12529-12538. [18] PAULOT F, JACOB D J, PINDER R W, et al. Ammonia emissions in the united states, european union, and China derived by high-resolution inversion of ammonium wet deposition data: Interpretation with a new agricultural emissions inventory (masage_NH3) [J]. Journal of Geophysical Research:Atmospheres, 2014, 119: 4343-4364. doi: 10.1002/2013JD021130 [19] ZHANG X, WU Y, LIU X, et al. Ammonia emissions may be substantially underestimated in China [J]. Environmental Science & Technology, 2017, 52(21): 12089-12096. [20] LIU D, WANG F, MA L, et al. Estimation of NH3 emission factor for pig manure in China [J]. Transactions of the Chinese Society of Agricultural Engineering, 2008, 24(4): 218-224. [21] HILL R A, SMITH K, RUSSELL K, et al. Emissions of ammonia from weeping wall stores and earth-banked lagoons determined using passive sampling and atmospheric dispersion modelling [J]. Journal of Atmospheric Chemistry, 2008, 59(2): 83-98. doi: 10.1007/s10874-007-9077-7 [22] FISCHER M L, LITTLEJOHN D, LUNDEN M M, et al. Automated measurements of ammonia and nitric acid in indoor and outdoor air [J]. Environmental Science & Technology, 2003, 37(10): 2114-2119. [23] LI Y, HARRISON R M. Comparison of indoor and outdoor concentrations of acid gases, ammonia and their associated salts [J]. Environmental Technology, 1990, 11(4): 315-326. doi: 10.1080/09593339009384868 [24] CHEN C, ZHAO B. Review of relationship between indoor and outdoor particles: I/O ratio, infiltration factor and penetration factor [J]. Atmospheric Environment, 2011, 45(2): 275-288. doi: 10.1016/j.atmosenv.2010.09.048 [25] LI M, WESCHLER C J, BEKÖ G, et al. Human ammonia emission rates under various indoor environmental conditions [J]. Environmental Science & Technology, 2020, 54(9): 5419-5428. [26] CHANG Y H, ZOU Z, DENG C R, et al. The importance of vehicle emissions as a source of atmospheric ammonia in the megacity of Shanghai [J]. Atmospheric Chemistry and Physics, 2015, 15(23): 34719-34763. [27] ABBATT J P D, WANG C. The atmospheric chemistry of indoor environments [J]. Environmental Science:Processes & Impacts, 2020, 22(1): 25-48. [28] BEHERA S N, SHARMA M, ANEJA V P, et al. Ammonia in the atmosphere: A review on emission sources, atmospheric chemistry and deposition on terrestrial bodies [J]. Environment Science Pollution Research, 2013, 20(11): 8092-8131. doi: 10.1007/s11356-013-2051-9 [29] WANG R, YE X, LIU Y, et al. Characteristics of atmospheric ammonia and its relationship with vehicle emissions in a megacity in China [J]. Atmospheric Environment, 2018, 182: 97-104. doi: 10.1016/j.atmosenv.2018.03.047 [30] SOMMER S G, OLESEN J E, CHRISTENSEN B T. Effects of temperature, wind speed and air humidity on ammonia volatilization from surface applied cattle slurry [J]. The Journal of Agricultural Science, 1991, 117(1): 91-100. doi: 10.1017/S0021859600079016 [31] SHANGGUAN W, DAI Y, LIU B, et al. A China data set of soil properties for land surface modeling [J]. Journal of Advances in Modeling Earth Systems, 2013, 5: 212. doi: 10.1002/jame.20026 [32] ZHAO X, XIE Y, XIONG Z, et al. Nitrogen fate and environmental consequence in paddy soil under rice-wheat rotation in the Taihu Lake region, China [J]. Plant and Soil, 2009, 319: 225-234. doi: 10.1007/s11104-008-9865-0 [33] MENG Z Y, LIN W L, JIANG X M, et al. Characteristics of atmospheric ammonia over Beijing, China [J]. Atmospheric Chemistry and Physics, 2011, 11(12): 6139-6151. doi: 10.5194/acp-11-6139-2011 [34] LAMARQUE J F, BOND T C, EYRING V, et al. Historical (1850–2000) gridded anthropogenic and biomass burning emissions of reactive gases and aerosols: Methodology and application [J]. Atmospheric Chemistry and Physics, 2010, 10(15): 7017-7039. doi: 10.5194/acp-10-7017-2010 [35] MENG Z, LIN W, ZHANG R, et al. Summertime ambient ammonia and its effects on ammonium aerosol in urban Beijing, China [J]. Science of The Total Environment, 2017, 579: 1521-1530. doi: 10.1016/j.scitotenv.2016.11.159 [36] CAO J, ZHANG T, CHOW J, et al. Characterization of atmospheric ammonia over Xi'an, China [J]. Aerosol and Air Quality Research, 2009, 9: 277-289. doi: 10.4209/aaqr.2008.10.0043 [37] ZHENG J, MA Y, CHEN M, et al. Measurement of atmospheric amines and ammonia using the high resolution time-of-flight chemical ionization mass spectrometry [J]. Atmospheric Environment, 2015, 102: 249-259. doi: 10.1016/j.atmosenv.2014.12.002 [38] WANG W, WANG S, XU J, et al. Gas-phase ammonia and PM2.5 ammonium in a busy traffic area of Nanjing, China [J]. Environmental Science and Pollution Research, 2016, 23(2): 1691-1702. doi: 10.1007/s11356-015-5397-3 [39] WANG Y, ZHANG Q Q, HE K, et al. Sulfate-nitrate-ammonium aerosols over China: Response to 2000–2015 emission changes of sulfur dioxide, nitrogen oxides, and ammonia [J]. Atmospheric Chemistry and Physics, 2013, 13(5): 2635-2652. doi: 10.5194/acp-13-2635-2013 [40] TANNER P. Vehicle-related ammonia emissions in Hong Kong [J]. Environmental Chemistry Letters, 2009, 7: 37-40. doi: 10.1007/s10311-007-0131-0 [41] KUANG Y, XU W, LIN W, et al. Explosive morning growth phenomena of NH3 on the North China Plain: Causes and potential impacts on aerosol formation [J]. Environmental Pollution, 2019, 257: 113621. [42] IANNIELLO A, SPATARO F, ESPOSITO G, et al. Occurrence of gas phase ammonia in the area of Beijing (China) [J]. Atmospheric Chemistry and Physics, 2010, 10(19): 9487-9503. doi: 10.5194/acp-10-9487-2010 [43] CABRERA M L, KISSEL D E, CRAIG J R, et al. Relative humidity controls ammonia loss from urea applied to loblolly pine [J]. Soil Science Society of America Journal, 2010, 74(2): 543-549. doi: 10.2136/sssaj2009.0220 [44] 孙一坚. 工业通风[M]. 北京: 中国建筑工业出版, 1984. SUN Y J. Industrial ventilation[M]. Beijing: China Construction Industry Publication, 1984(in Chinese).
-


 下载:
下载:


