


-
塑料具有稳定性好、轻便耐用和生产成本低等优点被人类广泛运用于生活的各个领域. 2020年,全球塑料产量达到3.67亿t,产生塑料垃圾
2910 万t[1],其中只有6%—26%的塑料垃圾被回收利用,其余的通过各种途径进入环境[2]. 塑料垃圾的无序排放,导致产生大量的新型污染物—微塑料. 微塑料是指粒径小于5 mm的微小塑料颗粒[3 − 4],按来源分为初级微塑料和次级微塑料;前者是专门设计具有特定功能的微小塑料颗粒,如去角质洗面奶、化妆品和牙膏中的研磨剂,后者是较大塑料制品在紫外线辐射下破裂、生物降解和机械磨损等过程而产生的细小颗粒[5].据估计,到2060年微塑料的重量占全球塑料生产总量的比例将达到13.2%[6],相当数量的微塑料存在于海洋[7 − 10]、河流[11]、空气[12]、土壤[13 − 14]和食品[15]等各种介质中. 迄今为止,自来水厂和瓶装水生产企业尚没有专门针对微塑料的去除工艺,导致人们的日常饮用水中也存在相当数量的微塑料[16 − 17],进而通过饮用水摄入人体的微塑料对人体产生潜在的健康风险. 目前,已有研究在人体的组织器官中发现了微塑料,比如,人类的肺组织[18]、胎盘[19]和血液[20]等. 因此,需要进一步研究并关注饮用水中微塑料对人类健康的潜在风险.
本文对饮用水中微塑料的赋存现状、人体健康的潜在危害及风险评估进行了归纳总结. 探讨了饮用水中微塑料赋存特征、目前存在的问题和微塑料研究今后发展的方向,以期为饮用水中微塑料污染的控制及人体健康风险评估提供理论依据.
-
自来水是居民日常接触最多的水资源,同时也是接触或摄入微塑料的重要途径之一. 因此,微塑料在自来水中的赋存现状越来越受到重视. 不少学者采用不同的方法对世界各地的自来水中微塑料的污染情况及赋存特征进行了研究,结果表明饮用水受到不同程度的微塑料污染,主要以碎片和纤维状微塑料为主. 这些微塑料可能源于空气沉降、塑料水管释放和膜污染等(表1).
Kosuth等[31]调查159份来自14个国家的自来水中微塑料的赋存现状,使用解剖显微镜(8—35 X)对未被200 mg·L−1孟加拉玫瑰红染色的颗粒观察、计数,发现81%样品含有微塑料,丰度为0—61 n·L−1,平均丰度为5.45 n·L−1,大部分呈纤维状. 而另一项全球自来水中微塑料的研究中,使用大孔径(26 μm)、小过滤面积(0.13 cm−3)的过滤器和FTIR对所有颗粒进行分析,发现微塑料丰度为1.9—225 n·L−1,平均丰度为(39±44)n·L−1,主要形状为碎片,其来源可能是空气沉降和输送水管的释放[25]. 采用不同的分析方法,我国报道的自来水中微塑料丰度总体偏高. Tong等[16]用5 mg·L−1尼罗红染色结合荧光显微镜进行定量分析,另外使用Raman检测每个样品的横截面上19个点(0.9 mm× 0.67 mm)中颗粒的成分,分析的样品面积为0.66%;研究表明,中国36个城市的自来水中存在以碎片为主的微塑料(<50 μm),平均丰度为440 n·L−1,可能源于塑料管道的释放. Shen等[23]调查长沙地区饮用水供应链中淡水、处理水和家庭自来水中的微塑料污染情况,再次证实了自来水中的微塑料与饮用水供应链中的运输管道有关,即饮用水输送过程中,塑料管道可能会发生轻微的磨损,从而产生细小塑料颗粒. 除此之外,处理工艺中的膜污染也不可忽略. Ding等[32]研究饮用水处理厂的有机膜释放微塑料的可能性,表明膜过滤系统可以将微塑料释放到饮用水供应链中.
-
瓶装水因其携带方便,被越来越多的人选择作为外出或是居家的饮用水来源. 研究表明,瓶装水通常易受到PE、PP和PET污染,这些微塑料主要源于塑料包装和瓶盖释放,而阳光照射、瓶龄、清洗和罐装等因素也可能会影响瓶装水中微塑料的丰度增加(表2).
2018年,世界卫生组织(WHO)审查饮用水中微塑料的潜在风险,对9个国家的11个不同品牌的259瓶水进行分析,93%的瓶装水中发现了微塑料,平均丰度为325 n·L-1[41],瓶装水中PE、PP和PET,主要来源于包装;Praveena等[39]发现马来西亚8个品牌瓶装水中的微塑料大部分为PET和PP,与包装材料及瓶盖材质密切有关;Kankanige等[40]对两种不同包装的一次性瓶装水进行分析,塑料瓶装水中的PET和PE最为丰富;Taheri等[35]发现机械应力明显增加水中微塑料的丰度,阳光照射和瓶龄也对PET瓶体内聚合物的结构和微塑料的释放造成影响;Weisser等[42]还发现微塑料在瓶子清洗和灌装过程中可以进入到水中.
-
食用或饮用微塑料污染的食物和饮用水是人体摄入微塑料的重要途径之一[43 − 44]. 由于微塑料的体积小、难降解,一旦进入人体,通过循环系统遍布于人体的各类组织和器官,并被组织器官(血液、睾丸和胎盘等)吸收或累积在各个部位. 近年来,相继从人体收集的各类样本中检出微塑料,这为微塑料可以进入人体并在人体内累积提供了强有力的证据(表3).
Leslie等[20]采用Py-GC/M技术首次测得血液中微塑料丰度为1.6 µg·mL−1,PET、PE和PS最丰富,其次是PMMA. Rotchell等[50]使用FTIR在静脉样品中鉴定出5种聚合物类型,其中醇酸树脂(45%)最多. 生殖系统中微塑料也被检出,Zhao等[49]使用Py-GC/MS和LD-IR首次在人类男性生殖系统中发现微塑料,精液和睾丸中大部分的微塑料粒径在20—100 μm之间,平均丰度分别为(0.23±0.45) n·mL−1和(11.60±15.52) n·g−1;睾丸中微塑料的主要成分为PS,而精液中微塑料的主要成分为PE和PVC. 另外,微塑料还能穿透胎盘屏障进入到胎盘中. Ragusa等[19]使用Raman分析了从生理妊娠的女性身上采集了6个人类胎盘,在4个胎盘中共发现12个主要成分为PP的碎片(粒径5—10 μm),其中胎儿侧5个、母亲侧4个、绒毛膜羊膜3个. 相似的另一项研究中,胎盘的微塑料丰度为0.28—9.55 n·g−1,平均丰度为(2.70±2.65)n·g−1,共鉴定出11种微塑料类型,以PVC、PP和PBS为主[47]. 除了胎盘,微塑料也暴露在胎粪和婴儿体内. Liu等[55]不仅首次采用LD-IR对来自同一研究人群的胎盘、胎粪、婴儿粪便、母乳和婴儿配方奶粉样本中的微塑料进行了测定,还收集有关怀孕期间和早期婴儿塑料品的使用和喂养模式的数据以确定孕妇和哺乳期婴儿的微塑料潜在暴露源. 研究结果显示,所有样品中共鉴定出16种聚合物,以PA和PU为主. 胎盘、胎粪和婴儿粪便中最主要的是PA,分别占50.09%、60.22%和49.67%,而母乳和婴儿配方奶粉中最主要的是PU,分别占53.18%和49.33%. 水的摄入量和使用清洁剂或牙膏可能是孕妇的暴露来源,母乳喂养和使用喂养瓶或塑料玩具可能是婴儿的暴露源.
粪便中微塑料的赋存是微塑料进入人体,并参与人体代谢的另一个有利证据. Schwabl等[51]在8名健康志愿者粪便样品中检出微塑料(粒径50—500 µm),粪便中微塑料丰度为2 n·L−1,主要成分为PP和PET. 而另一项关于8名香港居民粪便中的微塑料赋存研究显示丰度50 n·g−1(粒径30—
1800 µm),主要是碎片状的PS、PE和PP,这可能源于居民食用的海鲜[56]. 同时,Zhang等[52]在23名北京男性志愿者的粪便中也检测出微塑料的丰度为1—36 n·L−1(粒径20—800 μm)不等,1—8种微塑料类型,主要成分以PP为主. 饮用习惯(瓶装水和饮料)与粪便中微塑料的丰度之间存在中度相关性(r=0.445,P=0.029). 另外,Pironti等[48]还在人类的尿液中发现了微塑料(粒径4—15 µm),在1名意大利女性和3名男性的尿液中分别测出PVA、PVC、PP和PE. -
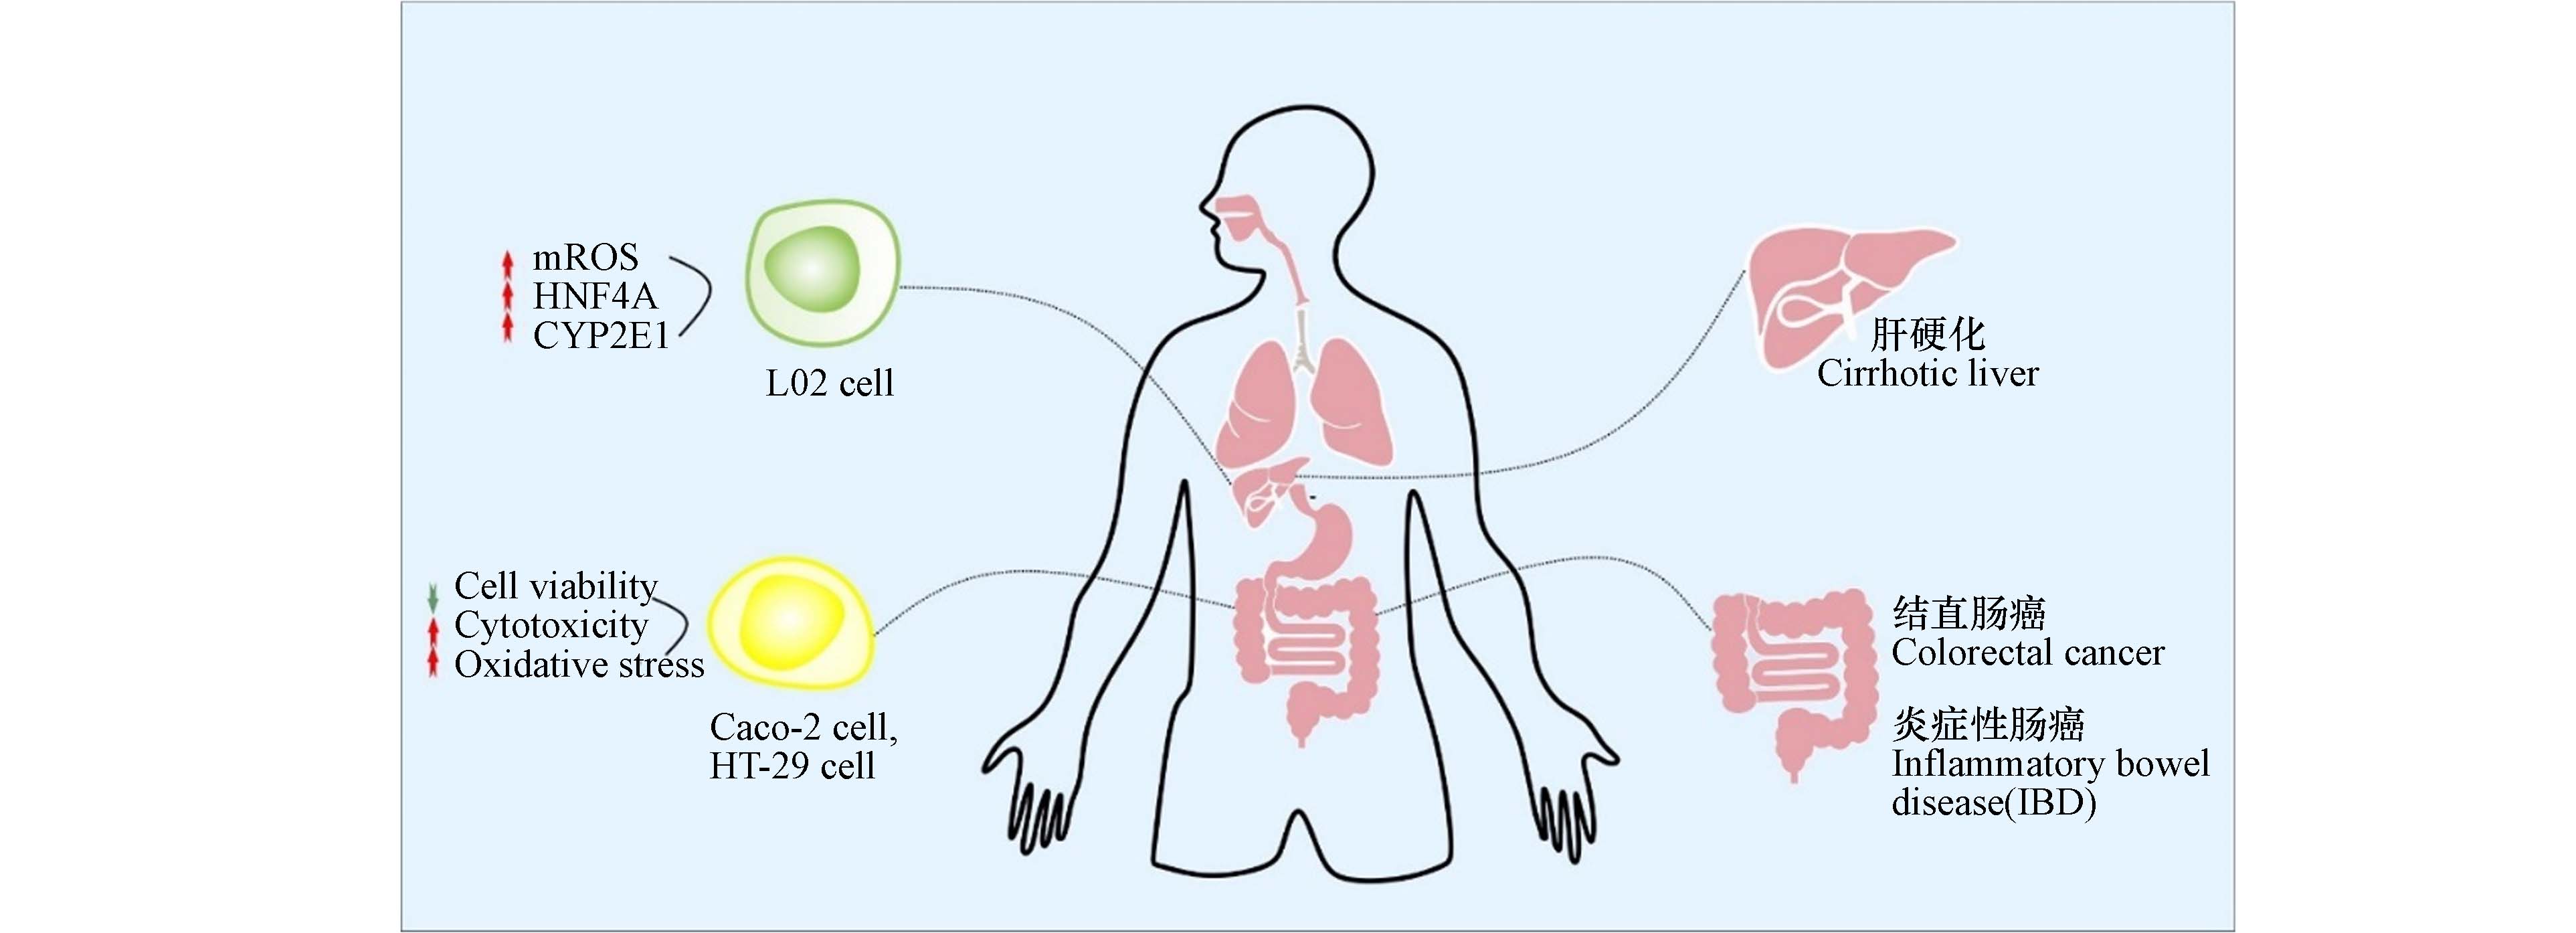
越来越多的证据表明,微塑料可能对身体氧化应激、肠道群落结构和脂质代谢等产生不良反应(图1). Herrala等[57]将人结直肠癌细胞Caco-2和HT-29暴露于PE(0.25—1.0 g·L−1)或提取物中48小时,发现高浓度的PE和乙醇提取的PE降低了细胞活力,增加了肠道细胞的氧化应激反应. 除此之外,聚乙烯微塑料(Pepepolyethylene microplastics,PE-MPs)和四溴双酚A(Tetrabromobisphenol A,TBBPA)在一定程度上对人体肠道表现联合作用. 大肠杆菌和拟杆菌群落组成随着PE-MPs和TBBPA的干扰而发生显著变化[58]. Cheng等[59]采用非静态暴露方法来探索1 μm聚苯乙烯微塑料(Polystyrene microplastics,PS-MPs)微珠的不良生物影响,最终发现PS-MPs会导致肝毒性,并破坏人类多能干细胞衍生的肝脏类器官的脂质代谢. 人结肠癌细胞Caco-2对不同粒径PS-MPs的摄取情况也不同. Wu等[60]比较0.1 μm和5 μm的PS-MPs对人结肠癌Caco-2细胞的细胞毒性和外排泵抑制能力,两种PS-MPs对细胞活力、氧化应激、膜完整性和流动性都表现低毒性;5 μm的PS-MPs比0.1 μm的PS-MPs诱导作用更强,且高浓度5 μm的PS-MPs可能通过诱导线粒体去极化和ATP的潜在消耗来降低ABC转运蛋白的活性. 另外,Lin等[61]发现80 nm的PS进入到人正常肝细胞L02和人正常肺上皮细胞BEAS-2B后,会引起线粒体功能障碍,如引起线粒体损伤,线粒体活性氧过多,线粒体膜电位改变和线粒体呼吸抑制等.
除此之外,暴露与疾病观察性研究表明一些疾病与微塑料之间存在联系(图1). Horvatits等[62]通过病例系列分析人类肝脏组织中的微塑料,发现肝硬化患者的肝脏中有6种聚合物类型(粒径4—30 µm),而在没有潜在肝脏疾病的患者中没有发现;因此,推测慢性肝脏疾病似乎是人类肝脏中微塑料积累的关键驱动因素. Yan等[63]首次发现炎症性肠病(Inflammatory bowel disease,IBD)患者的粪便中微塑料丰度(41.8 items·g−1·dm−1)显著高于健康人(28.0 items·g−1·dm−1). 在粪便中共检测到15种微塑料,大部分为碎片和纤维状,其中PET和PA占主导. 此外,粪便中微塑料的含量与IBD状态呈正相关,据此推测微塑料与肠炎发生有关. 微塑料暴露与癌症之间的关系所知甚少. Cetin等[64]研究结直肠腺癌患者的肿瘤和非肿瘤结肠组织中微塑料的发生. 结果表明,肿瘤结肠组织中的微塑料数量高于非肿瘤结肠组织中的数量,粒径为1—
1299 μm,主要成分为PE、PMMA和PA. -
风险评估是评价污染物是否会对生态环境和人类健康造成影响的重要手段. 目前,微塑料的风险评估研究采用了不同的方法和指标. 主要有每日摄入量(EDI)、聚合物风险指数(RI、pRi)、污染负荷指数(MPLI、PLI)和致癌风险指数(PCR、MPCR)等(表4).
Altunışık等[65]评估了土耳其成人和儿童通过饮用软饮料摄入微塑料的量. 研究结果显示,成人和儿童的EDI分别为0.002—0.006 Mps·kg−1·bw−1·d−1和 0.006—0.018 Mps·kg−1·bw−1·d−1;EAI均为2.19—657 Mps·kg−1·bw−1·a−1;通过天然水和矿泉水摄入微塑料的EDI分别为0.019 Mps·kg−1·bw−1·d−1和0.42 Mps·kg−1·bw−1·d−1[34]. 除此之外,EDI和EAI也用于评估通过食盐摄入的微塑料. 土耳其15岁以上个体的日、年和一生(70 a)微塑料摄入量分别为
0.41150 Mps·d−1、150 Mps·a−1和10424 Mps·70 a−1[66].最初RI、pRi用于生态环境污染方面. Hakanson等[76]建立该模型来评估水生环境中重金属污染情况. Liu等[74]在此基础上建立了一种初步的评估方法,用以评估上海几个地区空气中的微塑料,结果显示,RI数值范围为0.23—6.54,处于较低风险水平(RI<150);青岛水源水和自来水中微塑料的RI分别为289.8和490.1,属于中等和高等风险程度[22].
MPLI原是Tomlinson等[77]提出用来评估重金属污染河口的污染水平的指标,Xu等[71]对其进行修改并用于微塑料污染地表水生态风险评估. 后来,Lin等[34,65,72]用来探究瓶装水、软饮料和加工食品的中微塑料,10个牌子软饮料的污染因子范围为7—15,根据MPCF分类,20%样本受到中度污染,其余80%高度污染. 而土耳其瓶装天然水和矿泉水受微塑料污染情况好些,40%受到中度污染,其余20%为高度污染.
PCR是衡量一个人一生中接触某种物质而可能患癌的指标. 可接受的癌症风险范围在1×10⁻⁶—1×10⁻⁴之间. 一项美国淡水污染物研究中,成人和儿童经口摄入的所有聚合物类型(PE、PP、PVC、PS和PET)的MPCR都很高,这意味着成人和儿童人群摄入微塑料有致癌风险,而且儿童一生中患癌的风险比成年人更高[75]. 同样,Enyoh等[67]评估西非常见的主食(木薯片)中微塑料的致癌风险,所有检测到的微塑料类型(PET、PAM和HDPE)对成人和儿童均显示有显著的致癌风险.
综上,PLI、MPLI和RI比较常用于评估生态环境(土壤、水和空气)受微塑料污染的风险程度,然而这些风险评估模型仍处于初步阶段,有一定的局限性,只是根据微塑料在环境中的赋存现状评估对环境的影响,并没有综合考虑微塑料的性质和实际影响各种环境介质的暴露水平. EDI和EAI常用于食品和饮用水方面,PCR和MPCR总体评估人体通过多种途径摄入微塑料导致的致癌风险. 以上的评估方法不能准确评估微塑料通过饮用水摄入人体后,人体实际暴露微塑料浓度的健康风险,可能会低估或高估饮用水中微塑料带来的健康风险. 另外,微塑料较容易累积消化系统和泌尿系统并引起不良反应,目前尚没有针对微塑料对胃肠道、肾脏不良反应和疾病的风险评估方法.
-
人体通过饮用水无意摄入的微塑料进入人体后在人体内吸收、分布、代谢和排泄,从而对人体健康造成一定的威胁. 然而,目前的研究表明,关于饮用水中微塑料对人体的健康风险研究仍处于早期阶段,未来需要在以下领域开展系统和深入的研究:
(1)开发微塑料检测的国家标准方法,对饮用水中微塑料的赋存现状进行准确的定性和定量,为后期开展饮用水生产、运输过程中微塑料污染监测提供支持.
(2)结合真实饮用水中微塑料的浓度、成分以及摄入情况,确定微塑料的实际暴露水平,进一步深入开展微塑料在人体内的吸收和排泄机制,揭示其在体内的分布和累积规律.
(3)重点关注微塑料暴露高风险人群,如孕产妇、婴幼儿、患有基础性肠胃疾病和血液透析患者等,开展长期的流行病学调查研究,探讨微塑料暴露-体内赋存-疾病相关性.
(4)根据微塑料进入人体后的代谢和累积情况、结合相关毒性机制,开发适用于饮用水摄入微塑料的健康风险评估模型.
饮用水中微塑料的赋存特征及风险评估研究进展
Occurrence characteristics and risk assessment of microplastics in drinking water
-
摘要: 微塑料摄入导致的健康风险受到人们的广泛重视,通过饮用水摄入是微塑料进入人体的主要途径之一. 研究表明微塑料污染在饮用水中广泛存在,进入人体的微塑料在人体内转运、累积,导致体液、组织器官和人体粪便中均存在微塑料,且微塑料进入人体后会对消化系统、神经系统、免疫系统和生殖系统等产生一定的不利影响. 为了更好的评估通过饮用水摄入微塑料对人体的健康危害,需要开发高效准确的微塑料检测技术,准确评估饮用水中微塑料赋存现状,同时开展微塑料在人体内的分布及相关毒性机制研究. 结合以上数据开发更科学、合理的人体健康风险评估模型,才能为饮用水中微塑料的健康风险评估提供理论和方法支持. 本文综述了饮用水中微塑料的赋存特征及风险评估研究进展,以供研究人员作为参考.Abstract: Drinking water is one of the main routes through which microplastics enter the human body, leading to serious health risks for humans. The results reported so far show that contamination of drinking water with microplastics is widespread. The transport and accumulation of microplastics in body fluids, tissues and feces have harmful effects on the digestive system, the nervous system, the immune system and the reproductive system. In order to better assess the health risks posed by the ingestion of drinking water contaminated with microplastics, an efficient and accurate technology for the detection of microplastics needs to be developed. In addition, the mechanism of toxicity caused by the distribution of microplastics needs to be investigated. Based on the above data, a scientific model for human health risk assessment can be established, which will contribute to an accurate assessment of the risk of microplastics in drinking water. Therefore, the characteristics of the occurrence of microplastics in drinking water and the associated risk assessment were investigated in this paper.
-
Key words:
- microplastics /
- drinking water /
- health /
- risk assessment.
-

-
表 1 自来水中微塑料的赋存特征
Table 1. Occurrence characteristics of microplastics in drinking water
国家或地区
Countries or regions数量
Number尺寸
范围/μm
Size range丰度
Abundance聚合物类型
Polymer composition形状
Shape检测技术
Analysis methods文献
References均值
Average范围
Range中国 38 >1 (440±275) n·L−1 0— 1247 n·L−1PE、PP 纤维、碎片、
球体Raman [16] 1 10—500 (49.67±21.43) n·L−1 — PVC、rubber、
PAM、PET薄膜 LD-IR [21] 青岛 7 10— 5000 (0.7±0.6) n·L−1 0—2 n·L−1 PET、rayon 纤维 ATR-FTIR [22] 长沙 — 1—10 344 n·L−1 267—404 n·L−1 PE、PP、PET 纤维、碎片 SEM、FTIR [23] 中国香港 3 >1 — 9— 1693 n·L−1PET 纤维、碎片 Fluorescence microscopy、
Flow cytometry[24] 日本、美国、芬兰、法国、德国 42 19.2— 4200 (39±44 )n·L−1 2—225 n·L−1 PS、PP、PES 纤维、碎片、
球体FTIR [25] 丹麦 17 >100 0.31 n·L−1 — PET、PP、PS、ABS 纤维、碎片、
薄膜Stereomicroscopy、FTIR [26] 沙特阿拉伯 2 25—500 (0.9±1.3) n·L−1 0—2 n·L−1 PE — FTIR [27] 伊朗 10 100— 5000 (0.21±0.11) n·L−1 — PP、PS、PMMA、PA 碎片 FTIR、Raman、
FE-SEM[28] 巴塞罗那 42 0.7—20 ( 1583 ±514) ng·L−1— PE、PS、PI、
PBD、PP、PA碎片 KMD [29] 德国 2 ≥5 6 n·m−3、74 n·m−3 1—102 n·m−3 PE、PET、PP — Raman [30] 注:PE (聚乙烯)、PP (聚丙烯)、PVC (聚氯乙烯)、PAM (聚丙烯酰胺)、PET (聚对苯二甲酸乙二醇酯)、PS (聚苯乙烯)、PES (聚醚砜树脂)、ABS (丙烯腈-丁二烯-苯乙烯共聚物)、PMMA (聚甲基丙烯酸甲酯)、PA (聚酰胺)、PI (聚酰亚胺)、PBD (聚丁二烯)、Raman (拉曼光谱)、ATR-FTIR (傅里叶变换衰减全反射红外光谱)、LD-IR (激光红外光谱)、FTIR (傅里叶变换红外光谱)、FE-SEM (场发射扫描电子显微镜)、KMD (肯德里克质量缺陷)、“-” (数据未报告).
Note: PE (Polyethylene), PP (Polypropylene), PVC (Polyvinylchloride), PAM (Polyacrylamide), PET (Polythylene terephthalate), PS (Polystyrene), PES (Polyether sulfones), ABS (Acrylonitrile butadiene styrene), PMMA (Polymethyl methacrylate), PA (Polyamide), PI (Polyisoprene), PBD (Polybutadiene), Raman (Raman spectroscopy), ATR-FTIR (Attenuated total internal reflectance Fourier transform infrared spectroscopy), LD-IR (Laser direct infrared spectroscopy), FTIR (Fourier transform infrared spectroscopy), FE-SEM (Field emission scanning electron microscope), KMD (Kendrick mass defect), “-” (Data not reported). 下载: 导出CSV
表 2 瓶装水中微塑料的赋存特征
Table 2. Occurrence characteristics of microplastics in bottled water
国家或地区
Countries or regions数量
Number瓶子类型
Botter type尺寸范围/
μm
Size range丰度
Abundance聚合物类型
Polymer composition形状
Shape检测技术
Analysis methods文献
References均值/
(n·L−1)
Average范围
Range中国 10 PET、glass 10—500 73±45 — Cellulose、PVC、PET 纤维、薄膜、球体 LD-IR [21] 23 PET 25— 5000 — 2—23 n·bottle−1 Cellulose、PS、PE、PET 碎片、纤维 FTIR [33] 中国香港 9 PET、recycle
PET>1 — 8— 17393 n·L−1PET 碎片、纤维 Fluorescence microscopy、
Flow cytometry[24] 土耳其 150 plastic >10 5±4 2—20 n·L−1 PE、PP、PET、PA 碎片、纤维 FTIR、
Stereomicroscope[34] 伊朗 23 single-use PET 1— 5000 1497 ±1452 200— 6627 n·L−1PET — SEM、FTIR [35] 11 PET plastic 1280 —4200 9±10 — PET、PS、PP 碎片、纤维 FTIR、Raman [36] 尼日利亚 100 plastic 20—100 碎片:51
薄膜:2
球体:14— PE、PET、PVC、PDMS 碎片、薄膜、球体 SEM、EDS [37] 沙特阿拉伯 28 plastic、glass 25—500 2±5 — PE、PET、PP — FTIR [27] 澳大利亚 48 PET >5 13±19 0—80 n·L−1 PP、PS、PET、PA 碎片 Spectroscopy [38] 马来西亚 8 PET plastic 25— 5000 12±5 8—22 n·L−1 — 碎片、纤维 Stereomicroscope、FTIR [39] 泰国 95 single-use plastic、
glass≥6.5 140±19、
52±4— PET、PE、PP 纤维 Nile Red-tagging、Optical microscopy、 ATR-FTIR、Confocal Raman [40] 注:PDMS (聚二甲基硅氧烷)、EDS (能量色散X射线谱). Note: PDMS (Polydimethylsiloxane), EDS (Energy-dispersive X-ray).
下载: 导出CSV
表 3 人体中微塑料的赋存特征
Table 3. Occurrence characteristics of microplastics on human body
样本
Samples检出率
Detection rate尺寸范围/μm
Size range数量
Number丰度
Abundance聚合物类型
Polymer composition主要形状
Shape检测技术
Analysis methods文献
References乳汁 26/34 2—12 58 — PP、PE、PVC 碎片、球体 Raman [45] 胎盘 6/10
9/10
10/100—50 22、38、82 (4.1±1.3 )n·50 g−1、
(7.1±0.9) n·50 g−1、
(15.5±3.0) n·50 g−1PP、PET、PVC 碎片 LD-IR [46] 4/6 5—10 12 — PP 碎片 Raman [19] 17/17 20.34—307.29 — (2.7±2.7) n·g−1 PVC、PP、PBS 碎片、纤维 LD-IR [47] 尿液 4/6 4—15 7 — PP、PE、PVA、PVC 碎片 Raman [48] 睾丸 6/6 21.76—286.71 — (11.6±15.5) n·g−1 PS、PVC、PE 碎片 Py-GC/MS、
LD-IR[49] 精液 30/30 — (0.2±0.5) n·mL−1 碎片、纤维、薄膜 血液 17/22 ≥0.7 — 1.6 µg·mL−1 PET、PE — Py-GC/MS [20] 4/5 >5 20 (15.0±17.2 )n·g−1 PTFE、PP、PET 碎片、纤维 FTIR [50] 粪便 8/8 50—500 — 2.0 n·g−1 PP、PET 碎片、薄膜 FTIR [51] 23/24 20—800 240 10.4 n·g−1 PP — FTIR [52] 痰液 22/22 20—500 — (12.2±17.3) n·mL−1 PU、CPE、polyester — FTIR [53] 结肠 11/11 800— 1600 — (28.1±15.4) n·g−1 PC、PA、PP 碎片、纤维 FTIR [54] 注:PBS (聚丁二酸丁二醇酯)、PVA (聚乙烯醇)、PTFE (聚四氟乙烯)、PU (聚氨酯)、CPE (氯化聚乙烯)、PC (聚碳酸酯)、Py-GC/MS (热裂解-气相色谱-质谱联用).
Note: PBS (Polybutylene succinate), PVA (Polyvinylalcohol), PTFE (Polytetrafluoroethylene), PU (Polyurethane), CPE (Chlorinated polyethylene), PC(Polycarbonate), Py-GC/MS (Pyrolysis-gas chromatography/mass spectrometry).
下载: 导出CSV
表 4 常用风险评估指标
Table 4. Common risk assessment indicators
指标
Indicators公式
Formula范畴
Category文献
References每日摄入量(EDI) $ \mathrm{E}\mathrm{D}\mathrm{I}=({C}_{r}\times \mathrm{I}\mathrm{R})/\mathrm{b}\mathrm{w}/\mathrm{d} $ $ \mathrm{E}\mathrm{D}\mathrm{I}=\dfrac{{S}_{i}\times {C}_{m}}{\mathrm{b}\mathrm{w}} $
注:Cr是指微塑料丰度(n·L−1);IR代表摄入率;bw是体重;Si为食盐消耗量(g·d−1),
d是天;Cm为微塑料消耗量(n·g−1)瓶装水、软饮料、
食盐、木薯片[34,65 − 67] 每年摄入量(EAI) $ \mathrm{E}\mathrm{A}\mathrm{I}=\mathrm{I}\mathrm{R}\times {C}_{\mathrm{r}}/\mathrm{b}\mathrm{w}/\mathrm{a} $ 软饮料、瓶装水 [65,34] 每周摄入量
(ARM)ANM=(p/week/person)=number of particles per weight(p/g) × food intake(g/week) $ \mathrm{A}\mathrm{M}\mathrm{M}\left(\text{g/particles}\right)=\dfrac{\mathrm{\pi }{\mathrm{L}}^{3}\mathrm{p}}{6\times 1{0}^{12}} $ $ \mathrm{A}\mathrm{R}\mathrm{M}(\mathrm{g}/\mathrm{w}\mathrm{e}\mathrm{e}\mathrm{k}/\mathrm{p}\mathrm{e}\mathrm{r}\mathrm{s}\mathrm{o}\mathrm{n})=\mathrm{A}\mathrm{N}\mathrm{M}\times \mathrm{A}\mathrm{M}\mathrm{M} $ 软饮料、食品 [65,68] 风险商
(HQ)$ {\mathrm{H}\mathrm{Q}}_{\mathrm{i}\mathrm{n}\mathrm{g}\mathrm{e}\mathrm{s}\mathrm{t}\mathrm{i}\mathrm{o}\mathrm{n}}={\left(\dfrac{\mathrm{E}\mathrm{D}\mathrm{I}}{\mathrm{R}\mathrm{f}\mathrm{D}}\right)}_{\mathrm{i}\mathrm{n}\mathrm{g}\mathrm{e}\mathrm{s}\mathrm{t}\mathrm{i}\mathrm{o}\mathrm{n}} $
注:RfD是人体每日暴露的最大允许风险木薯片 [67] 污染负荷指数(MPLI、PLI) $ \mathrm{M}\mathrm{P}\mathrm{C}\mathrm{F}=\dfrac{{\mathrm{M}\mathrm{P}}_{\mathrm{a}}}{{\mathrm{M}\mathrm{P}}_{\mathrm{m}}} $ $ \mathrm{M}\mathrm{F}\mathrm{L}\mathrm{I}={\left({\mathrm{M}\mathrm{P}\mathrm{C}\mathrm{F}}_{1}\times {\mathrm{M}\mathrm{P}\mathrm{C}\mathrm{F}}_{2}\times {\mathrm{M}\mathrm{P}\mathrm{C}\mathrm{F}}_{3}. ... ..{\mathrm{M}\mathrm{P}\mathrm{C}\mathrm{F}}_{10}\right)}^{1/10} $
注:MPa为样品中微塑料的丰度;MPm为微塑料的最小基线量软饮料、瓶装水、
海湾、湖泊[65,34,69 − 70] $ {\mathrm{C}\mathrm{F}}_{i}=\dfrac{{C}_{i}}{{C}_{o}}\mathrm{、}\mathrm{P}\mathrm{L}\mathrm{I}=\sqrt{{\mathrm{C}\mathrm{F}}_{i}} $
注:Co为加工食品中报告的最低微塑料平均丰度(1.68 n·kg−1);
Ci为样品中微塑料的丰度海湾、胡泊、地表水、
加工食品[69 − 72] 聚合物风险指数(H、RI、pRi) $ H=\sum {P}_{\mathrm{n}}\times {S}_{\mathrm{n}} $
注:Pn为每个样品中聚合物类型的百分比;Sn为不同聚合物的危害等级食品、地表水、沉积物 [68,71,73] $ \mathrm{R}\mathrm{I}={\sum }_{\mathrm{i}=1}^{\mathrm{n}}{E}_{i} $ $ {{E}}_{{i}}={T}_{i}\times \left(\dfrac{{C}_{i}}{{C}_{o}}\right) $
注:Ti为聚合物的化学毒性系数;Ci为样品中各聚合物丰度;
Co为样品中微塑料丰度空气、饮用水 [74,22] $ {\mathrm{p}}{R}_{i}=\sum \left(\dfrac{{P}_{i}}{{P}_{t}}\times {S}_{j}\right) $
注:Pi为样品中每种微塑料的丰度;Pt表示样品中微塑料的丰度;Sj为化学毒性系数或风险评分pRi分级:<150较低,150—300中等,300—600相当大,600—1200 较高,>1200 非常高食盐、木薯片 [66 − 67] 致癌风险指数(PCR、MPCR) PCRp = (EDIp × CSFp) × 10−3
PCRt = PCRp1 + PCRp2 + …… PCRpn
注:CSF为癌症斜率因子木薯片 [67] MPCRoral/dermal = EDIoral/dermal × CSF
MPCRt = MPCRoral + MPCRdermal淡水 [75]
下载: 导出CSV
-
[1] GAMBINO I, BAGORDO F, GRASSI T, et al. Occurrence of microplastics in tap and bottled water: Current knowledge[J]. International Journal of Environmental Research and Public Health, 2022, 19(9): 5283. doi: 10.3390/ijerph19095283 [2] HUANG D L, TAO J X, CHENG M, et al. Microplastics and nanoplastics in the environment: macroscopic transport and effects on creature[J]. Journal of Hazardous Materials, 2021, 407: 124399. doi: 10.1016/j.jhazmat.2020.124399 [3] NGUYEN B, CLAVEAU-MALLET D, HERNANDEZ L M, et al. Separation and analysis of microplastics and nanoplastics in complex environmental samples[J]. Accounts of Chemical Research, 2019, 52(4): 858-866. doi: 10.1021/acs.accounts.8b00602 [4] IVLEVA N P. Chemical analysis of microplastics and nanoplastics: Challenges, advanced methods, and perspectives[J]. Chemical Reviews, 2021, 121(19): 11886-11936. doi: 10.1021/acs.chemrev.1c00178 [5] AUTA H S, EMENIKE C U, FAUZIAH S H. Distribution and importance of microplastics in the marine environment: A review of the sources, fate, effects, and potential solutions[J]. Environment International, 2017, 102: 165-176. doi: 10.1016/j.envint.2017.02.013 [6] SHARMA S, BASU S M, SHETTI N P, et al. Microplastics in the environment: Occurrence, perils, and eradication[J]. Chemical Engineering Journal, 2021, 408: 127317. doi: 10.1016/j.cej.2020.127317 [7] YANG H R, CHEN G L, WANG J. Microplastics in the marine environment: Sources, fates, impacts and microbial degradation[J]. Toxics, 2021, 9(2): 41. doi: 10.3390/toxics9020041 [8] SORASAN C, EDO C, GONZÁLEZ-PLEITER M, et al. Ageing and fragmentation of marine microplastics[J]. The Science of the Total Environment, 2022, 827: 154438. doi: 10.1016/j.scitotenv.2022.154438 [9] YUAN Z H, NAG R, CUMMINS E. Human health concerns regarding microplastics in the aquatic environment-From marine to food systems[J]. The Science of the Total Environment, 2022, 823: 153730. doi: 10.1016/j.scitotenv.2022.153730 [10] QU J L, WU P F, PAN G J, et al. Microplastics in seawater, sediment, and organisms from Hangzhou Bay[J]. Marine Pollution Bulletin, 2022, 181: 113940. doi: 10.1016/j.marpolbul.2022.113940 [11] WU B, LI L W, ZU Y X, et al. Microplastics contamination in groundwater of a drinking-water source area, Northern China[J]. Environmental Research, 2022, 214(Pt 3): 114048. [12] ZHANG Q, XU E G, LI J N, et al. A review of microplastics in table salt, drinking water, and air: Direct human exposure[J]. Environmental Science & Technology, 2020, 54(7): 3740-3751. [13] YANG L, ZHANG Y L, KANG S C, et al. Microplastics in soil: A review on methods, occurrence, sources, and potential risk[J]. The Science of the Total Environment, 2021, 780: 146546. doi: 10.1016/j.scitotenv.2021.146546 [14] DING J, LV M, ZHU D, et al. Tire wear particles: An emerging threat to soil health[J]. Critical Reviews in Environmental Science and Technology, 2023, 53(2): 239-257. doi: 10.1080/10643389.2022.2047581 [15] DIAZ-BASANTES M F, CONESA J A, FULLANA A. Microplastics in honey, beer, milk and refreshments in Ecuador as emerging contaminants[J]. Sustainability, 2020, 12(14): 5514. doi: 10.3390/su12145514 [16] TONG H Y, JIANG Q Y, HU X S, et al. Occurrence and identification of microplastics in tap water from China[J]. Chemosphere, 2020, 252: 126493. doi: 10.1016/j.chemosphere.2020.126493 [17] OßMANN B E, SARAU G, HOLTMANNSPÖTTER H, et al. Small-sized microplastics and pigmented particles in bottled mineral water[J]. Water Research, 2018, 141: 307-316. doi: 10.1016/j.watres.2018.05.027 [18] AMATO-LOURENÇO L F, CARVALHO-OLIVEIRA R, JÚNIOR G R, et al. Presence of airborne microplastics in human lung tissue[J]. Journal of Hazardous Materials, 2021, 416: 126124. doi: 10.1016/j.jhazmat.2021.126124 [19] RAGUSA A, SVELATO A, SANTACROCE C, et al. Plasticenta: First evidence of microplastics in human placenta[J]. Environment International, 2021, 146: 106274. doi: 10.1016/j.envint.2020.106274 [20] LESLIE H A, van VELZEN M J M, BRANDSMA S H, et al. Discovery and quantification of plastic particle pollution in human blood[J]. Environment International, 2022, 163: 107199. doi: 10.1016/j.envint.2022.107199 [21] LI H, ZHU L, MA M D, et al. Occurrence of microplastics in commercially sold bottled water[J]. Science of the Total Environment, 2023, 867: 161553. doi: 10.1016/j.scitotenv.2023.161553 [22] ZHANG M, LI J X, DING H B, et al. Distribution characteristics and influencing factors of microplastics in urban tap water and water sources in Qingdao, China[J]. Analytical Letters, 2020, 53(8): 1312-1327. doi: 10.1080/00032719.2019.1705476 [23] SHEN M C, ZENG Z T, WEN X F, et al. Presence of microplastics in drinking water from freshwater sources: The investigation in Changsha, China[J]. Environmental Science and Pollution Research, 2021, 28(31): 42313-42324. doi: 10.1007/s11356-021-13769-x [24] TSE Y T, CHAN S M N, SZE E T P. Quantitative assessment of full size microplastics in bottled and tap water samples in Hong Kong[J]. International Journal of Environmental Research and Public Health, 2022, 19(20): 13432. doi: 10.3390/ijerph192013432 [25] MUKOTAKA A, KATAOKA T, NIHEI Y S. Rapid analytical method for characterization and quantification of microplastics in tap water using a Fourier-transform infrared microscope[J]. Science of the Total Environment, 2021, 790: 148231. doi: 10.1016/j.scitotenv.2021.148231 [26] FELD L, Da SILVA V H, MURPHY F, et al. A study of microplastic particles in Danish tap water[J]. Water, 2021, 13(15): 2097. doi: 10.3390/w13152097 [27] ALMAIMAN L, ALJOMAH A, BINEID M, et al. The occurrence and dietary intake related to the presence of microplastics in drinking water in Saudi Arabia[J]. Environmental Monitoring and Assessment, 2021, 193(7): 390. doi: 10.1007/s10661-021-09132-9 [28] TAGHIPOUR H, GHAYEBZADEH M, GANJI F, et al. Tracking microplastics contamination in drinking water in Zahedan, Iran: From source to consumption taps[J]. Science of the Total Environment, 2023, 872: 162121. doi: 10.1016/j.scitotenv.2023.162121 [29] VEGA-HERRERA A, LLORCA M, BORRELL-DIAZ X, et al. Polymers of micro(nano) plastic in household tap water of the Barcelona Metropolitan Area[J]. Water Research, 2022, 220: 118645. doi: 10.1016/j.watres.2022.118645 [30] PITTROFF M, MÜLLER Y K, WITZIG C S, et al. Microplastic analysis in drinking water based on fractionated filtration sampling and Raman microspectroscopy[J]. Environmental Science and Pollution Research International, 2021, 28(42): 59439-59451. doi: 10.1007/s11356-021-12467-y [31] KOSUTH M, MASON S A, WATTENBERG E V. Anthropogenic contamination of tap water, beer, and sea salt[J]. PLoS One, 2018, 13(4): e194970. [32] DING H J, ZHANG J, HE H, et al. Do membrane filtration systems in drinking water treatment plants release nano/microplastics?[J]. The Science of the Total Environment, 2021, 755(Pt 2): 142658. [33] ZHOU X J, WANG J, LI H Y, et al. Microplastic pollution of bottled water in China[J]. Journal of Water Process Engineering, 2021, 40: 101884. doi: 10.1016/j.jwpe.2020.101884 [34] ALTUNıŞıK A. Microplastic pollution and human risk assessment in Turkish bottled natural and mineral waters[J]. Environmental Science and Pollution Research, 2023, 30(14): 39815-39825. doi: 10.1007/s11356-022-25054-6 [35] TAHERI S, SHOSHTARI-YEGANEH B, POURZAMANI H, et al. Investigating the pollution of bottled water by the microplastics (MPs): The effects of mechanical stress, sunlight exposure, and freezing on MPs release[J]. Environmental Monitoring and Assessment, 2023, 195(1): 62. doi: 10.1007/s10661-022-10697-2 [36] MAKHDOUMI P, AHMAD AMIN A, KARIMI H, et al. Occurrence of microplastic particles in the most popular Iranian bottled mineral water brands and an assessment of human exposure[J]. Journal of Water Process Engineering, 2021, 39: 101708. doi: 10.1016/j.jwpe.2020.101708 [37] IBETO C N, ENYOH C E, OFOMATAH A C, et al. Microplastics pollution indices of bottled water from South Eastern Nigeria[J]. International Journal of Environmental Analytical Chemistry, 2023, 103(19): 8176-8195. doi: 10.1080/03067319.2021.1982926 [38] SAMANDRA S, MESCALL O J, PLAISTED K, et al. Assessing exposure of the Australian population to microplastics through bottled water consumption[J]. Science of the Total Environment, 2022, 837: 155329. doi: 10.1016/j.scitotenv.2022.155329 [39] PRAVEENA S M, SHAMSUL ARIFFIN N I, NAFISYAH A L. Microplastics in Malaysian bottled water brands: Occurrence and potential human exposure[J]. Environmental Pollution, 2022, 315: 120494. doi: 10.1016/j.envpol.2022.120494 [40] KANKANIGE D, BABEL S. Smaller-sized micro-plastics (MPs) contamination in single-use PET-bottled water in Thailand[J]. Science of the Total Environment, 2020, 717: 137232. doi: 10.1016/j.scitotenv.2020.137232 [41] MASON S A, WELCH V G, NERATKO J. Synthetic polymer contamination in bottled water[J]. Frontiers in Chemistry, 2018, 6: 407. doi: 10.3389/fchem.2018.00407 [42] WEISSER J, BEER I, HUFNAGL B, et al. From the well to the bottle: Identifying sources of microplastics in mineral water[J]. Water, 2021, 13(6): 841. doi: 10.3390/w13060841 [43] PRATA J C, Da COSTA J P, LOPES I, et al. Environmental exposure to microplastics: An overview on possible human health effects[J]. The Science of the Total Environment, 2020, 702: 134455. doi: 10.1016/j.scitotenv.2019.134455 [44] CAO G D, CAI Z W. Getting health hazards of inhaled nano/microplastics into focus: Expectations and challenges[J]. Environmental Science & Technology, 2023, 57(9): 3461-3463. [45] RAGUSA A, NOTARSTEFANO V, SVELATO A, et al. Raman microspectroscopy detection and characterisation of microplastics in human breastmilk[J]. Polymers, 2022, 14(13): 2700. doi: 10.3390/polym14132700 [46] WEINGRILL R B, LEE M J, BENNY P, et al. Temporal trends in microplastic accumulation in placentas from pregnancies in Hawaiʻi[J]. Environment International, 2023, 180: 108220. doi: 10.1016/j.envint.2023.108220 [47] ZHU L, ZHU J Y, ZUO R, et al. Identification of microplastics in human placenta using laser direct infrared spectroscopy[J]. The Science of the Total Environment, 2023, 856(Pt 1): 159060. [48] PIRONTI C, NOTARSTEFANO V, RICCIARDI M, et al. First evidence of microplastics in human urine, a preliminary study of intake in the human body[J]. Toxics, 2022, 11(1): 40. doi: 10.3390/toxics11010040 [49] ZHAO Q C, ZHU L, WENG J M, et al. Detection and characterization of microplastics in the human testis and semen[J]. Science of the Total Environment, 2023, 877: 162713. doi: 10.1016/j.scitotenv.2023.162713 [50] ROTCHELL J M, JENNER L C, CHAPMAN E, et al. Detection of microplastics in human saphenous vein tissue using μFTIR: A pilot study[J]. PLoS One, 2023, 18(2): e0280594. doi: 10.1371/journal.pone.0280594 [51] SCHWABL P, KÖPPEL S, KÖNIGSHOFER P, et al. Detection of various microplastics in human stool: A prospective case series[J]. Annals of Internal Medicine, 2019, 171(7): 453-457. doi: 10.7326/M19-0618 [52] ZHANG N, YI B L, HE H R, et al. You are what You eat: Microplastics in the feces of young men living in Beijing[J]. Science of the Total Environment, 2021, 767: 144345. doi: 10.1016/j.scitotenv.2020.144345 [53] HUANG S M, HUANG X X, BI R, et al. Detection and analysis of microplastics in human sputum[J]. Environmental Science & Technology, 2022, 56(4): 2476-2486. [54] IBRAHIM Y S, TUAN ANUAR S, AZMI A A, et al. Detection of microplastics in human colectomy specimens[J]. JGH Open: an Open Access Journal of Gastroenterology and Hepatology, 2020, 5(1): 116-121. [55] LIU S J, GUO J L, LIU X Y, et al. Detection of various microplastics in placentas, meconium, infant feces, breastmilk and infant formula: A pilot prospective study[J]. Science of the Total Environment, 2023, 854: 158699. doi: 10.1016/j.scitotenv.2022.158699 [56] HO Y W, LIM J Y, YEOH Y K, et al. Preliminary findings of the high quantity of microplastics in faeces of Hong Kong residents[J]. Toxics, 2022, 10(8): 414. doi: 10.3390/toxics10080414 [57] HERRALA M, HUOVINEN M, JÄRVELÄ E, et al. Micro-sized polyethylene particles affect cell viability and oxidative stress responses in human colorectal adenocarcinoma Caco-2 and HT-29 cells[J]. The Science of the Total Environment, 2023, 867: 161512. doi: 10.1016/j.scitotenv.2023.161512 [58] HUANG W T, YIN H, YANG Y Y, et al. Influence of the co-exposure of microplastics and tetrabromobisphenol A on human gut: Simulation in vitro with human cell Caco-2 and gut microbiota[J]. The Science of the Total Environment, 2021, 778: 146264. doi: 10.1016/j.scitotenv.2021.146264 [59] CHENG W, LI X L, ZHOU Y, et al. Polystyrene microplastics induce hepatotoxicity and disrupt lipid metabolism in the liver organoids[J]. Science of the Total Environment, 2022, 806: 150328. doi: 10.1016/j.scitotenv.2021.150328 [60] WU B, WU X M, LIU S, et al. Size-dependent effects of polystyrene microplastics on cytotoxicity and efflux pump inhibition in human Caco-2 cells[J]. Chemosphere, 2019, 221: 333-341. doi: 10.1016/j.chemosphere.2019.01.056 [61] LIN S Y, ZHANG H N, WANG C, et al. Metabolomics reveal nanoplastic-induced mitochondrial damage in human liver and lung cells[J]. Environmental Science & Technology, 2022, 56(17): 12483-12493. [62] HORVATITS T, TAMMINGA M, LIU B B, et al. Microplastics detected in cirrhotic liver tissue[J]. eBioMedicine, 2022, 82: 104147. doi: 10.1016/j.ebiom.2022.104147 [63] YAN Z H, LIU Y F, ZHANG T, et al. Analysis of microplastics in human feces reveals a correlation between fecal microplastics and inflammatory bowel disease status[J]. Environmental Science & Technology, 2022, 56(1): 414-421. [64] CETIN M, MILOGLU F D, BAYGUTALP N K, et al. Higher number of microplastics in tumoral colon tissues from patients with colorectal adenocarcinoma[J]. Environmental Chemistry Letters, 2023, 21(2): 639-646. doi: 10.1007/s10311-022-01560-4 [65] ALTUNıŞıK A. Prevalence of microplastics in commercially sold soft drinks and human risk assessment[J]. Journal of Environmental Management, 2023, 336: 117720. doi: 10.1016/j.jenvman.2023.117720 [66] ÖZÇIFÇI Z, BASARAN B, AKÇAY H T. Microplastic contamination and risk assessment in table salts: Turkey[J]. Food and Chemical Toxicology, 2023, 175: 113698. doi: 10.1016/j.fct.2023.113698 [67] ENYOH C E, WANG Q Y, RABIN M H, et al. Preliminary characterization and probabilistic risk assessment of microplastics and potentially toxic elements (PTEs) in garri (cassava flake), a common staple food consumed in West Africa[J]. Environmental Analysis, Health and Toxicology, 2023, 38(1): e2023005-e2023000. doi: 10.5620/eaht.2023006 [68] PHAM D T, KIM J, LEE S H, et al. Analysis of microplastics in various foods and assessment of aggregate human exposure via food consumption in Korea[J]. Environmental Pollution, 2023, 322: 121153. doi: 10.1016/j.envpol.2023.121153 [69] PAN Z, LIU Q L, JIANG R G, et al. Microplastic pollution and ecological risk assessment in an estuarine environment: The Dongshan Bay of China[J]. Chemosphere, 2021, 262: 127876. doi: 10.1016/j.chemosphere.2020.127876 [70] SHUKUR S A, HASSAN F M, FAKHRY S S, et al. Evaluation of microplastic pollution in a lotic ecosystem and its ecological risk[J]. Marine Pollution Bulletin, 2023, 194: 115401. doi: 10.1016/j.marpolbul.2023.115401 [71] XU P, PENG G Y, SU L, et al. Microplastic risk assessment in surface waters: A case study in the Changjiang Estuary, China[J]. Marine Pollution Bulletin, 2018, 133: 647-654. doi: 10.1016/j.marpolbul.2018.06.020 [72] LIN Q H, ZHAO S S, PANG L H, et al. Potential risk of microplastics in processed foods: Preliminary risk assessment concerning polymer types, abundance, and human exposure of microplastics[J]. Ecotoxicology and Environmental Safety, 2022, 247: 114260. doi: 10.1016/j.ecoenv.2022.114260 [73] 周如月, 刘俊勇, 韦锃弦, 等. 水体及沉积物微塑料污染对近海养殖海区的生态风险[J]. 环境化学, 2023, 42(8): 2539-2548. doi: 10.7524/j.issn.0254-6108.2022030402 ZHOU R Y, LIU J Y, WEI Z X, et al. Study on the ecological risk of water and sediment microplastic pollution on offshore marine aquacultureareas[J]. Environmental Chemistry, 2023, 42(8): 2539-2548 (in Chinese). doi: 10.7524/j.issn.0254-6108.2022030402
[74] LIU K, WANG X H, FANG T, et al. Source and potential risk assessment of suspended atmospheric microplastics in Shanghai[J]. The Science of the Total Environment, 2019, 675: 462-471. doi: 10.1016/j.scitotenv.2019.04.110 [75] ENYOH C E, VERLA A W, RAKIB M R J. Application of index models for assessing freshwater microplastics pollution[J]. Natural Sciences, 2021, 38: 37-48. [76] HAKANSON L. An ecological risk index for aquatic pollution control. a sedimentological approach[J]. Water Research, 1980, 14(8): 975-1001. doi: 10.1016/0043-1354(80)90143-8 [77] TOMLINSON D L, WILSON J G, HARRIS C R, et al. Problems in the assessment of heavy-metal levels in estuaries and the formation of a pollution index[J]. Helgolä nder Meeresuntersuchungen, 1980, 33(1): 566-575. -
 点击查看大图
计量
- 文章访问数: 1230
- HTML全文浏览数: 1230
- PDF下载数: 43
- 施引文献: 0
