-
挥发性有机物(volatile organic compounds,VOCs)是大气中普遍存在的一类化合物,是形成光化学烟雾的前体物,具有相对分子质量小、沸点较低、饱和蒸汽压高和亨利常数较大等特征[1-2]。VOCs主要来源于各种自然源和人为源的直接排放,其中人为源的贡献巨大[3-6]。近年来,随着经济全球化和市场经济的快速发展,以臭氧为特征污染物的大气光化学污染成为我国城市区域越来越突出的大气环境问题[7]。汕头市以臭氧为首要污染物的污染天数占比自2016年起逐年升高,2017年和2018年所有污染天气首要污染物均为臭氧,且污染浓度呈上升态势。从臭氧的生成机制来看,近地面臭氧是氮氧化物(NOx)、VOCs等前体物,在太阳辐射的作用下,经一系列光化学反应生成的二次污染物[8]。在城市地区,控制VOCs排放是减少臭氧污染的有效途径[6]。因此,许多学者对不同地区的大气VOCs的浓度水平、来源、光化学反应机制及VOCs对臭氧生成的贡献等方面进行研究,并提出相应的臭氧控制方案[6, 9],如广州[10-12]、北京[11, 13]、上海[11, 14]、中国香港特别行政区[12, 15]、兰州[11]、重庆[16]和南京[2]等。
围绕打赢蓝天保卫战和空气质量持续改善的紧迫需求,汕头市亟须弄清导致本地臭氧污染的关键因素。基于历年汕头市臭氧污染统计数据,本文选取臭氧污染最严重的濠江区为研究对象,选择臭氧污染最突出的10月为监测时段,开展大气O3、VOCs、NOx、CO和气象参数的外场观测,获得高质量和高时间分辨率的成套实测数据。运用PMF模型软件开展大气VOCs的来源解析,分析VOCs的主要排放源及其贡献的时空变化;利用OBM模型对臭氧污染过程中的局地臭氧光化学的收支和主控因子进行了系统分析[16];结合PMF模型初步评估各类排放源减排的成效,提出臭氧污染防治的措施建议。
全文HTML
-
本研究观测时段为2019年10月7~31日,共计25 d。采样地点位于汕头市濠江区达濠中学(汕头市环境空气国控监测点)(23°16' 39"N,116°43' 33"E)5楼楼顶,测点离地高度约15 m。该测点地处汕头濠江区商业和居民混合区,交通密度相对较高,机动车排放相对密集,受周边人群活动的局部影响较小。周围2 km范围内无明显工业大气污染源,能够很好地代表濠江区域大气成分均匀混合的平均特征。
-
本研究中的VOCs观测采用武汉某公司生产的VOCs在线监测系统。该系统采用超低温预浓缩与气相色谱-质谱联用(GC-MS)检测技术,应用于在线和离线的痕量挥发性有机物测量。该系统每1 h自动收集一次空气样品,流速为40 mL/min,采样时间为10 min。分析仪器为Agilent GC:8860/MS:5977B。经过TH-300B前处理超低温捕集热脱附后,分为2条路径。一条路径经火焰电离检测器(FID)(C2-C5化合物)通过DM-PLOT Alumina/Na2SO4色谱柱(30 m×320 μm×5 μm)检测到,而另一条路径经过Agilent DB624色谱柱(60 m×250 μm×1.4 μm)后由MS检测器检测到(C6-C12化合物)。数据分析采用人工读谱方式获得每个样品的VOCs浓度。
臭氧、空气质量常规监测数据与气象数据等参考与观测地点相邻处的汕头市濠江区环境空气国控监测点的相关数据。
-
PMF受体模型是一种基于对大量观测数据进行分析的多元素分析工具,其研究思路是输入样品各化学组分的质量浓度和不确定性,并利用权重计算出各化学组分的误差,然后通过最小二乘法估算污染源的组成及其贡献率[17]。PMF受体模型广泛应用于对大气污染物主要来源的解析中[9]。本研究采用美国环保局认可的EPA PMF 5.0模型软件,模型原理见文献[17]。
-
OBM是美国乔治亚理工学院Cardelino和Chameides在1995年开发的一个盒子模型,是一种常用的基于观测数据的臭氧污染成因的分析方法[11, 18]。通过将VOCs、NO、NO2、CO、O3和气象条件的观测数据输入到OBM模型中,假设污染物充分混合,模拟大气光化学反应过程,计算臭氧生成速率。其中相对增量反应活性(Relative Incremental Reactivity, RIR)是OBM的核心概念,通过降低特定前体物的浓度(模拟污染源的削减)来计算不同前体物的RIR,进而判断臭氧生成的敏感性(即削减效果)[1, 18]。
本研究采用山东大学环境研究院开发的基于观测的大气氧化性和光化学模型OBM-AOCP(Observation-Based Model for investigating Atmospheric Oxidation Capacity and Photochemistry)。选用RACM2气相化学机制进行模拟,通过VOCs化学结构和活性相近的组分组合成为一个模型物种参与运算,模型物种组成分类见表1,具体组分对应分类详见文献[19],模型中臭氧化学生成速率,见式(1)~(3),RIR的计算,见式(4)。
式(1)~(3)中,k1~k9表示各反应的速率常数;P(O3)为O3的生成速率,L(O3)为O3的消耗速率,Net p(O3)为O3的净生成速率,即通常说的臭氧原位化学生成速率。
式(4)中,X为臭氧特定前体物;
${P}_{{\rm{O}}_{3}} $ (X)为X的O3生成速率;△${P}_{{\rm{O}}_{3}} $ (X)为X的O3生成速率的变化量;C(X)为X的浓度;△C(X)为X浓度的变化量。经验动力学模拟法(Empirical Kinetics Modeling Approach, EKMA),EKMA曲线指的是由不同的NOx和VOCs初始浓度对应的O3生成所绘制而成的O3等浓度曲线[13]。臭氧的生成与VOCs、NOx并不成线性关系,EKMA曲线方法则很好的呈现了三者的关系,已被广泛应用于臭氧污染控制的研究中[16, 20-21]。
1.1. 采样时间与地点
1.2. 仪器及分析方法
1.2.1. 正交矩阵因子分解法
1.2.2. 基于观测的模型
-
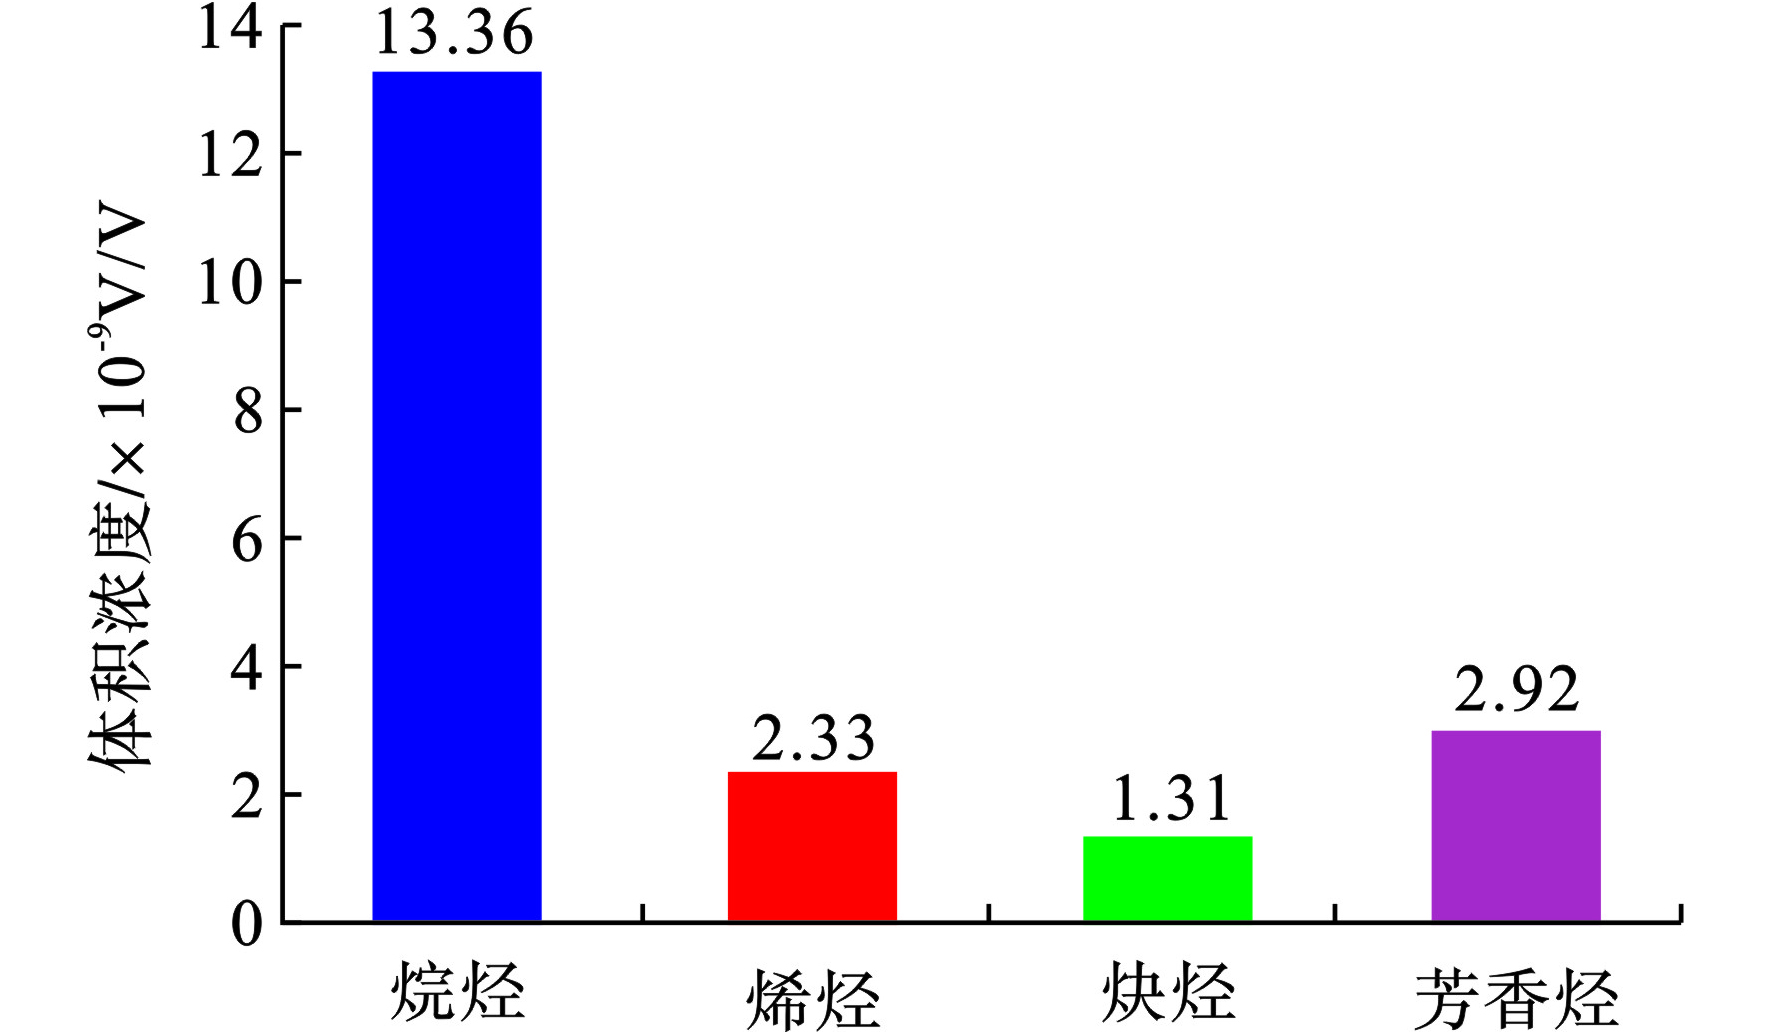
本文观测了57种VOCs组分,包括29种烷烃、17种芳香烃、10种烯烃和1种炔烃。在观测期间采集的样品中57种VOCs组分均有检出,总VOCs小时浓度变化范围为6.89×10⁻⁹~66.86×10⁻⁹ V/V,见图1。
图1可见,濠江区VOCs组分中烷烃、芳香烃、烯烃和炔烃的平均浓度依次为:13.36×10⁻⁹ V/V、2.92×10−9 V/V、2.33×10−9 V/V、1.31×10−9 V/V。烷烃在濠江区大气VOCs中含量最为丰富,占比达到67.1%,其余依次为芳香烃(14.7%)、烯烃(11.7%)和炔烃(6.6%)。
排名前10物种分别为烷烃的丙烷、乙烷、正丁烷、异戊烷、异丁烷.;炔烃的乙炔;烯烃的乙烯和芳香烃的甲苯、间/对二甲苯,这10种VOCs优势物种的体积浓度占比高达70.9%,其中丙烷、乙烷、正丁烷和乙炔的浓度贡献最突出,其浓度占优势物种的60.1%,相关研究表明,丙烷、正丁烷和乙炔都主要来源于机动车尾气的排放[22-27]。说明濠江区的VOCs受交通源影响较为显著。
-
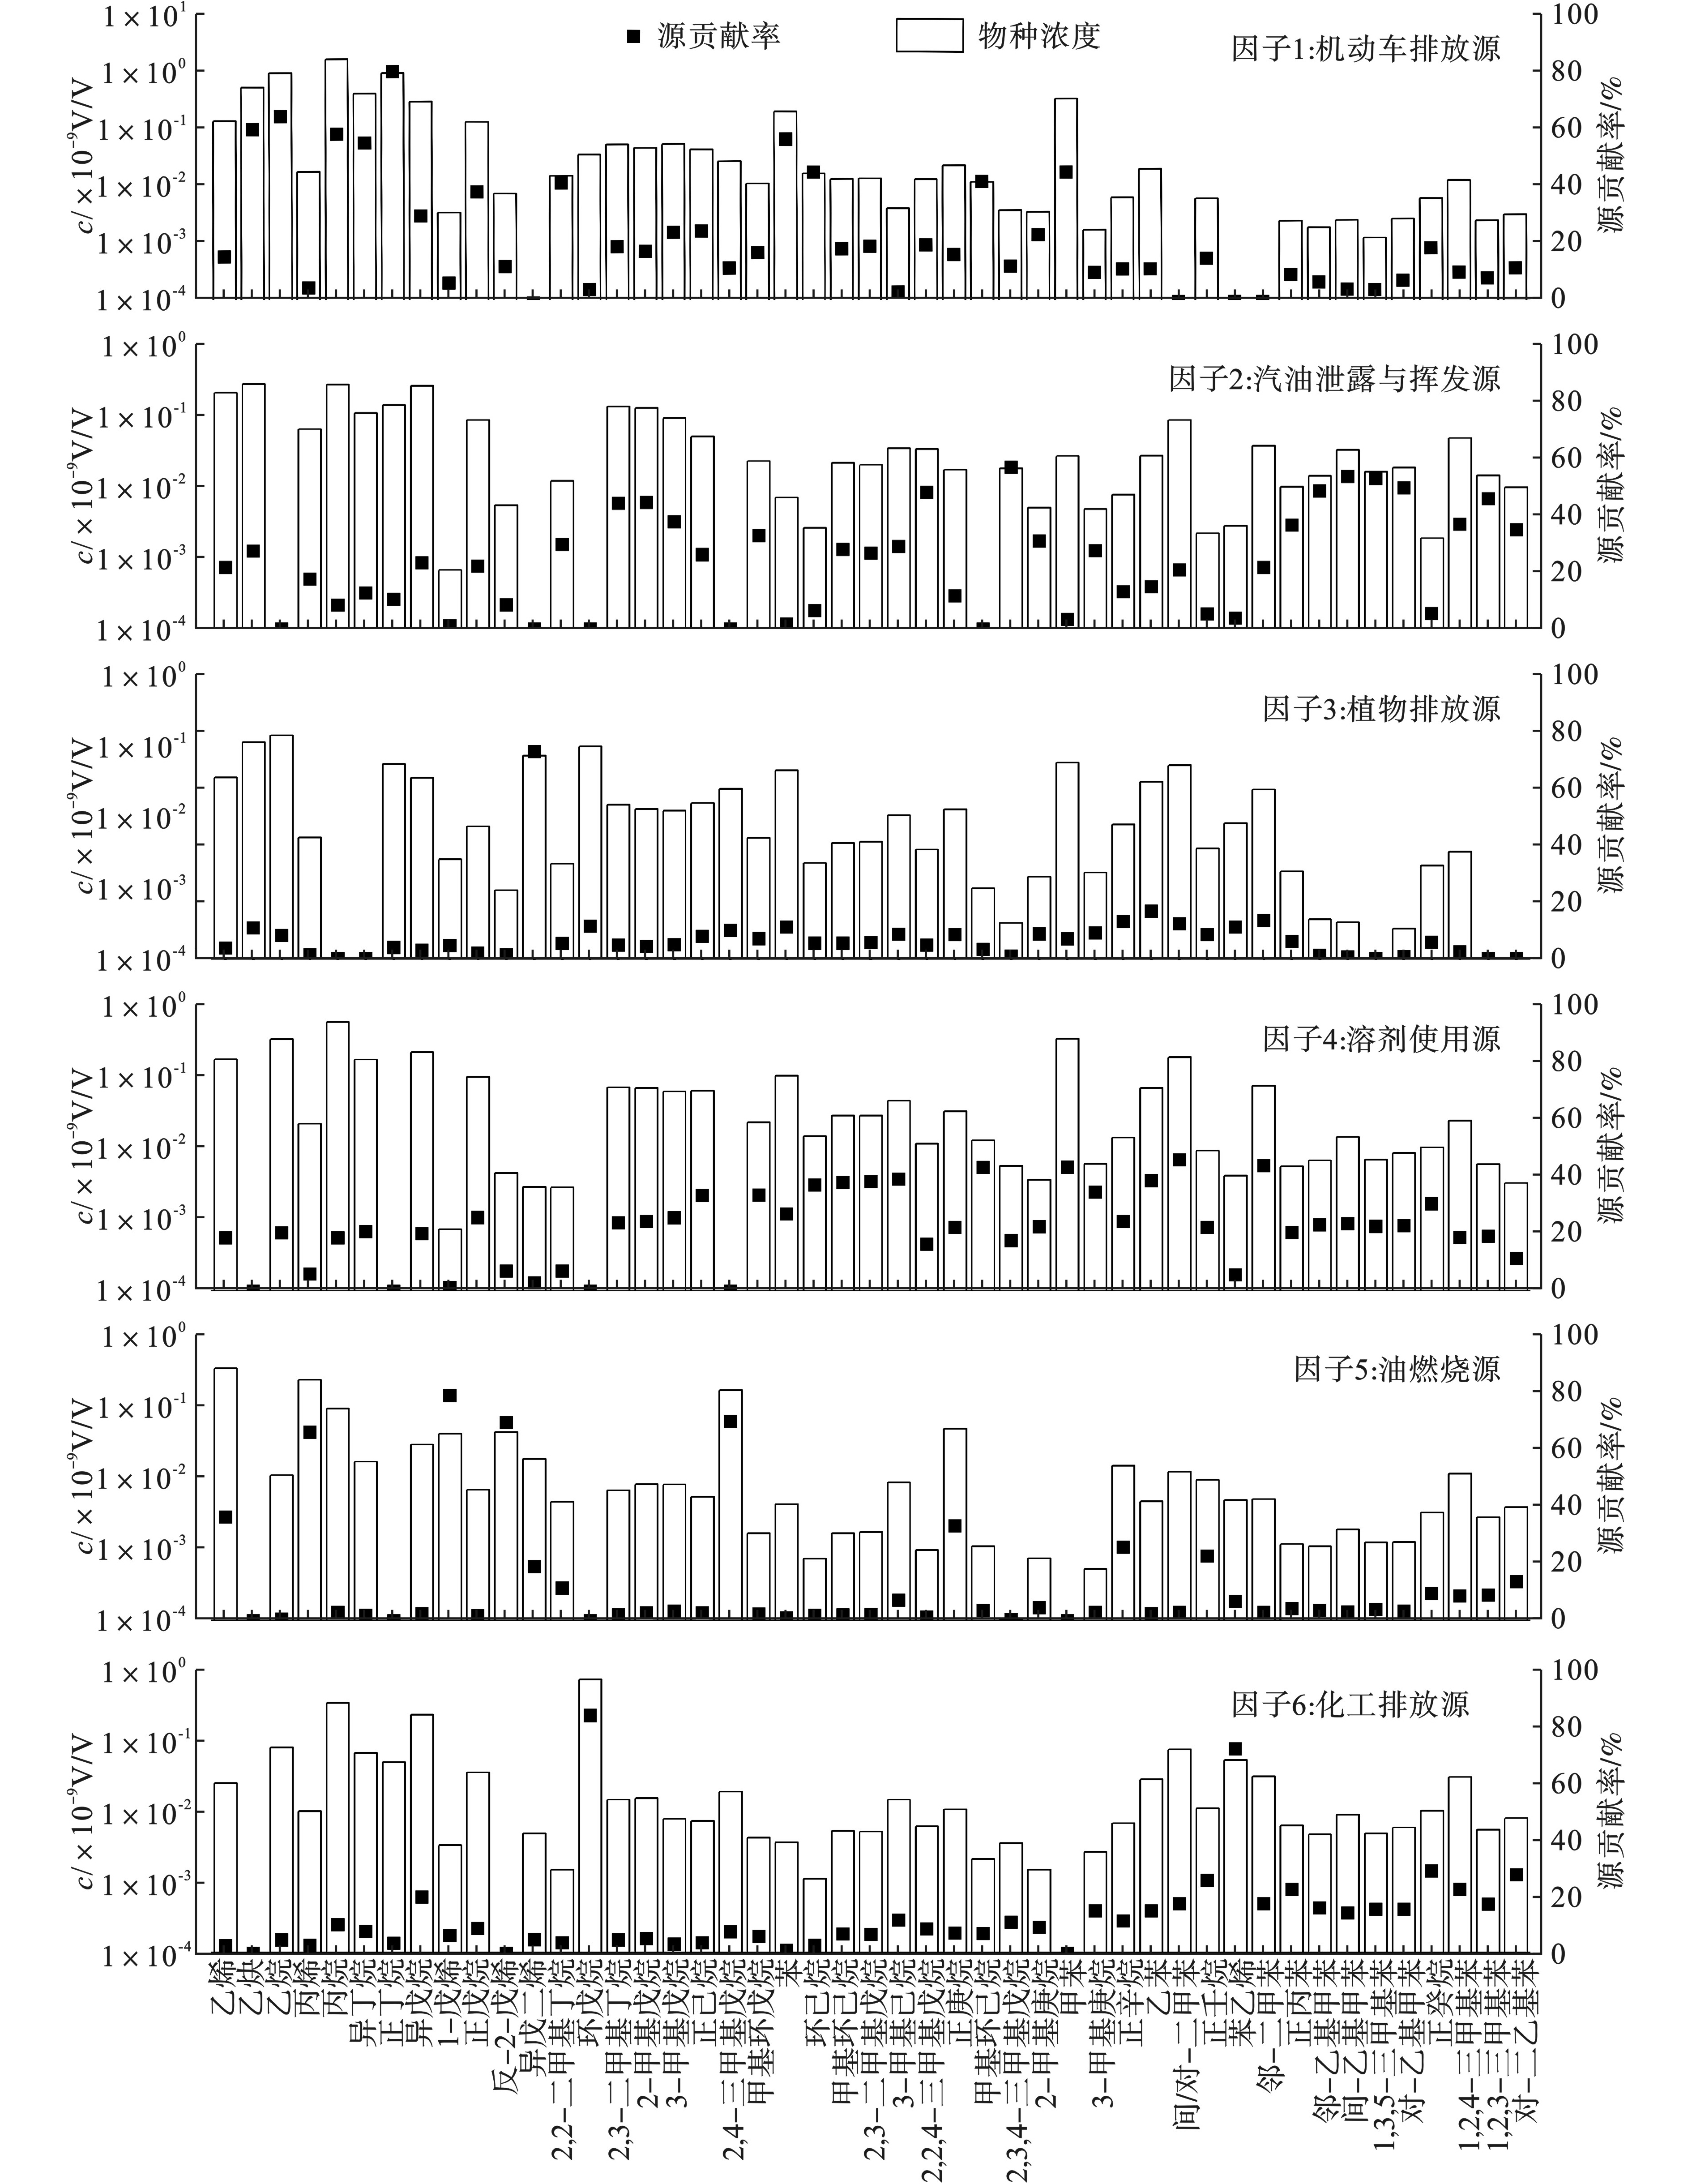
PMF共解析出6种可能的排放源,分别为机动车排放源、汽油泄露与挥发源、植物排放源、溶剂使用源、油燃烧源和化工排放源。各个源相应的主要示踪剂的组成和浓度,见图2[28-36]。
因子1源谱中含有大量的乙炔、乙烷、丙烷、异丁烷、正丁烷、苯和甲苯等苯系物。汽车尾气中含量最丰富的是正丁烷、异丁烷、异戊烷以及苯系物等物质[28];丙烷、异丁烷和正丁烷是LPG(液化石油气)排放的重要指标[29],因此认定因子1为机动车排放源。因子2源谱中含有较多的C4-C5的烷烃,2-甲基戊烷、3-甲基戊烷、三甲基戊烷等,以及大量的挥发性芳香烃。汽油挥发主要成分为C4-C5的烷烃,特别是异戊烷,其中2-甲基戊烷、3-甲基戊烷在汽油蒸汽中的含量也较丰富[28];戊烷作为汽油的主要成分,在此源谱中含量低于因子1源谱,同时苯系物的含量很低,因此认定因子2为工业生产过程、储存及运输过程中汽油的泄露与挥发源。因子3源谱中的异戊二烯主要来源于天然植物排放[30],为植物源的重要指示物种,认定因子3为植物排放源。因子4源谱中己烷、TEX(甲苯、乙苯、间/对-二甲苯、邻-二甲苯和甲苯)含量较高,正己烷主要用作有机溶剂[31];TEX主要与涂料及有机溶剂使用有关[32-33],因此因子4定性为溶剂使用源。因子5源谱中含有大量的乙烯、丙烯、1-戊烯等烯烃物种,重碳数的烷烃(正庚烷、正辛烷、正壬烷)含量也较高。1-戊烯可能来源包括石油燃烧和石油化工厂排放[34];乙烯、丙烯主要来源于石油燃烧;因此考虑为油燃烧源,包括锅炉燃烧、船舶引擎等[35]。因子6源谱中集中了72.2%的苯乙烯,苯乙烯主要来自化工生产[36],因此判定因子6为化工排放源。
PMF各因子的贡献占比情况,见表2。
表2可见,濠江区VOCs污染的主要来源为机动车排放源和溶剂使用源。因此,控制濠江区大气VOCs污染应着重于控制交通及溶剂使用企业的废气排放。结合汕头市VOCs重点行业分布特征,化学原料和化学制品制造业、医药制造业是濠江区溶剂使用的重点行业,也是重要的化工排放源产业,且集中在保税区,位于本次观测点位的上风向,是濠江区VOCs工业来源的重点关注对象,需加强管控。
-
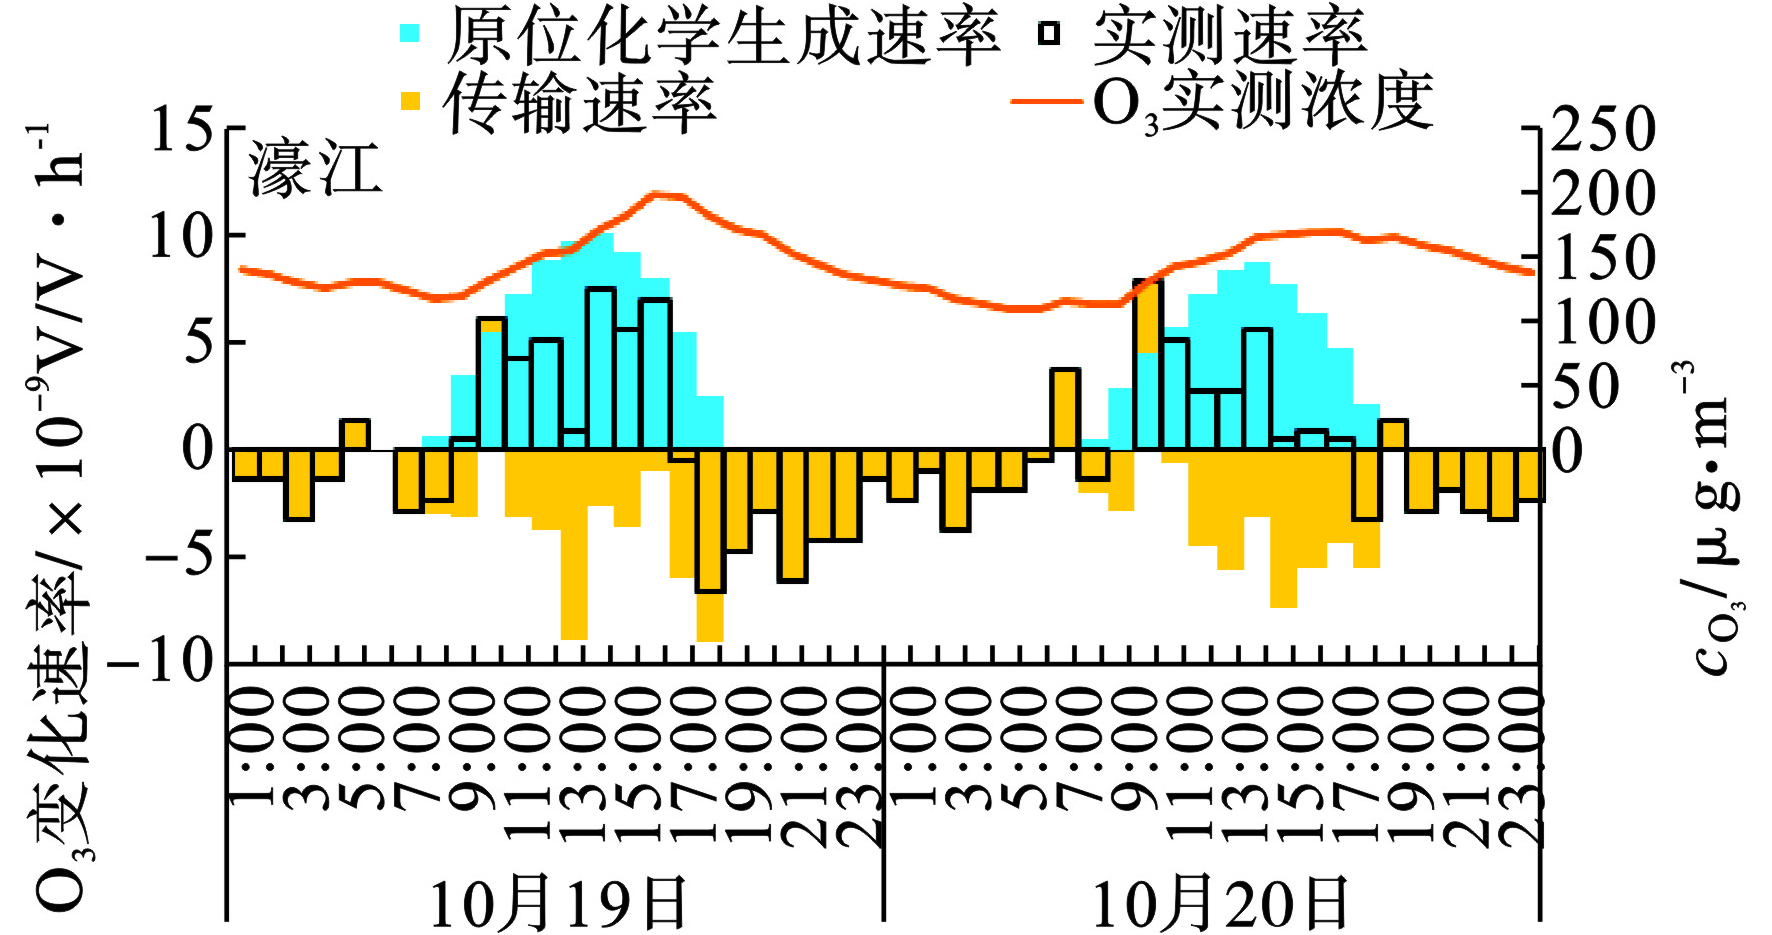
濠江区在观测期间出现2次臭氧轻度污染,10月19日臭氧浓度峰值为178 μg/m3,20日为165 μg/m3,选作臭氧污染日。通过局地臭氧化学收支模拟,估算濠江区臭氧光化学污染潜势。臭氧浓度的变化是局地光化学(包括生成和去除)与区域输送(包括输入与输出)共同作用的结果[16],日间浓度的变化以局地光化学生成与区域输送为主[11],对臭氧生成的影响可正(生成和输入)可负(去除和输出)[16]。
利用OBM模型计算污染日濠江区的臭氧原位化学生成速率,并与实测速率进行比较,分析局地光化学作用与区域传输对臭氧生成的贡献。在不考虑沉降等其他作用的影响下,可以认为,实测速率-原位化学生成速率=传输速率。10月19日、20日臭氧最大小时生成速率分别为10.1×10⁻⁹ V/V·h−1,8.74×10−9 V/V·h−1,均出现在14:00;日间累积生成臭氧浓度分别为70.72×10−9 V/V·h−1,59.32×10−9 V/V·h−1,见图3。观察到实测速率在上午存在少数高于原位化学生成速率的时刻,其余大部分时刻则明显低于原位化学生成速率。
化学收支分析结果表明,光化学初始阶段存在臭氧输入,主要是夜间残留层臭氧向下输入所致,但日间臭氧浓度的升高则主要是局地光化学生成所致。由于光化学反应前有较高的臭氧浓度本底值,同时受区域传输影响及日间前体物的光化学反应的共同作用,导致了此次臭氧污染的形成。且日间臭氧的局地光化学反应生成对日间臭氧浓度贡献显著。
-
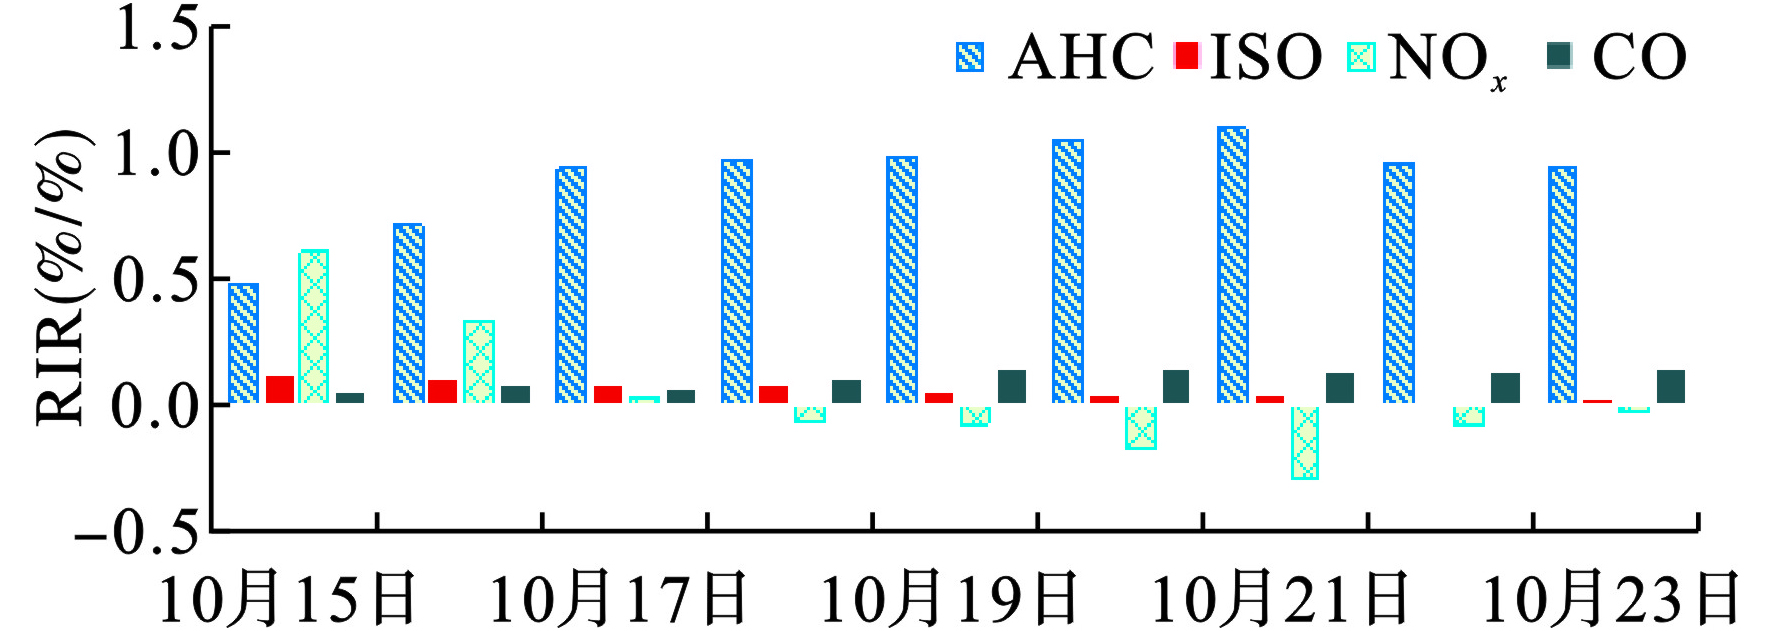
臭氧与前体物之间的相互影响对于理解本地臭氧过程至关重要[2]。为探究不同类别前体物对臭氧生成的敏感性,利用OBM模型计算10月15~23日污染过程(涵盖污染日与非污染日)4种主要臭氧前体物NOx、CO、人为源VOCs(AHC)、植物源VOCs(ISO)的浓度分别削减10%情景下的相对增量反应活性(RIR),见图4。
图4所示,削减AHC时的RIR值最大,而削减NOx除了10月15~16日有较大的RIR外,其余日期的RIR较小甚至为负值,说明观测点臭氧生成主要受AHC控制与影响。10月15~16日存在局部区域处于人为源VOCs和NOx共同控制区的情况。削减ISO和CO对臭氧的控制总体有利但效果并不显著。
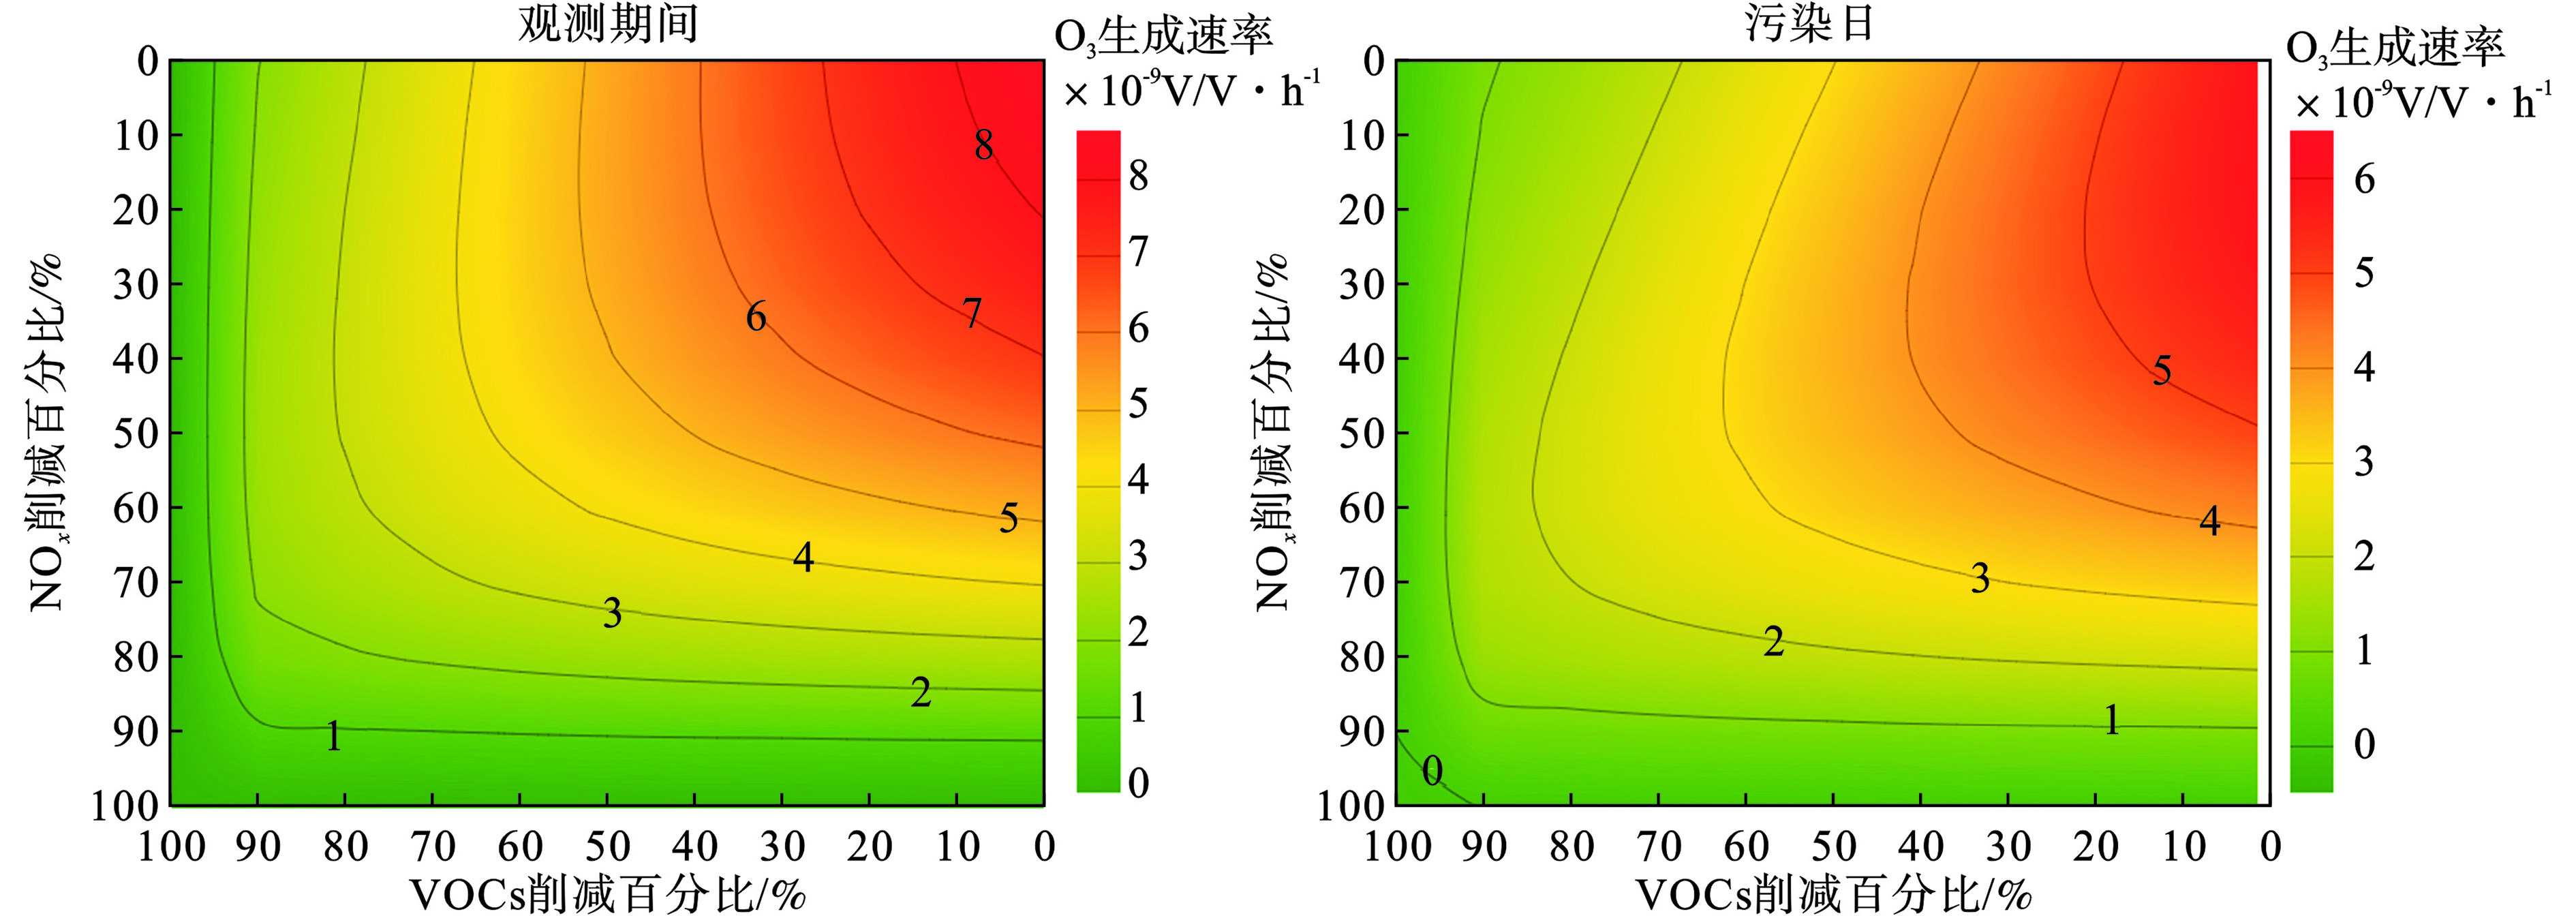
确定一个区域是否受到NOx控制或VOCs控制是有效控制臭氧的重要一步[37- 38]。基于观测期间与臭氧污染日的数据设计VOCs与NOx浓度不同削减比例情况下,计算臭氧原位化学生成的平均速率,绘制EKMA曲线,进一步探究AHC与NOx浓度改变对臭氧生成的影响,见图5。
濠江区臭氧的生成在观测期间和污染日均处于VOCs控制区,即与削减NOx排放相比,削减VOCs排放能更有效地降低臭氧浓度;在保持NOx浓度不变,降低VOCs浓度,臭氧生成速率会明显下降,例如削减10%的VOCs浓度,臭氧生成速率可下降7%~10%;而单独降低NOx浓度,只有在降幅足够大(20%~40%)的时候臭氧生成速率才能达到同等效果。
-
为了制定濠江区VOCs控制策略,将观测期间与臭氧污染日的VOCs组分进行RIR计算,并将57种VOCs组分对照表1分为13种模型物种,统计其RIR值,进一步识别出VOCs的关键活性组分,RIR值见表3。与VOCs浓度贡献占比不同,相对于烷烃,浓度更低的烯烃与芳香烃是观测期间VOCs活性较大的两类组分,臭氧污染日烷烃和芳香烃的RIR值有较明显的升高。综合来看,三类VOCs组分对臭氧生成的贡献几乎相当。观测期间和臭氧污染日影响臭氧生成的模型物种相对一致,RIR值较高的均为:芳香烃类的间/对二甲苯(XYM),甲苯和其他低活性芳香烃类(TOL),C6以上活性较大的烷烃(HC8),丙烯等直链烯烃(OLI)和反-2-丁烯等支链烯烃(OLT)。这5种模型物种占臭氧污染日RIR值的69.6%,是濠江区臭氧生成的主要关键活性组分。
为确定濠江区关键活性VOCs组分的来源贡献,将关键活性组分与PMF源解析结果相结合,计算各源所占的比例,见图6,关键活性组分芳香烃类的XYM,TOL主要来源于溶剂使用;烷烃类的HC8主要来源于溶剂使用和机动车排放;烯烃类的OLI,OLT主要来源于油燃烧排放。
通过不同源中的主要的活性组分浓度加和得到关键组分来源贡献比,见表4,关键活性组分主要来源为溶剂使用源,其次为机动车排放源。
-
为精确筛选出VOCs减排的重点源对象,结合PMF源解析结果,以关键活性组分在各源中的贡献比例为权重因子,对各类排放源中的VOCs关键活性组分分别进行10%的削减敏感性测试,见图7。
无论观测期间和臭氧污染日,溶剂使用源均是最重要的控制对象,削减溶剂使用源对降低濠江区臭氧局地生成的效果最好。因此,濠江区应重点关注保税区的化学原料和化学制品制造业、医药制造业。
2.1. 濠江区VOCs的化学组成特征
2.2. PMF受体模型源解析
2.3. 污染日局地臭氧化学收支分析
2.4. 臭氧化学生成的敏感性分析
2.5. VOCs关键活性组分的识别
2.6. VOCs关键活性组分污染源减排对于臭氧削减效果的评估
-
1)2019年10月7 ~31日观测期间,汕头市濠江区大气VOCs中烷烃含量占比最高,为67.1%,其余依次为芳香烃(14.7%)、烯烃(11.7%)和炔烃(6.6%)。排名前10优势物种分别为丙烷、乙烷、正丁烷、异戊烷、异丁烷、乙炔,乙烯、甲苯、间/对二甲苯,对VOCs的贡献为70.9%。
2)利用PMF受体模型进行VOCs来源解析,6类排放源分别为:机动车排放源(38.0%)、溶剂使用源(20.4%)、汽油泄露与挥发源(16.5%)、化工排放源(11.7%)、油燃烧源(7.9%)和植物排放源(5.5%)。
3)濠江区10月19~20日发生臭氧污染,此次污染是由于光化学反应前有较高的臭氧浓度本底值,同时受区域传输影响及光化学反应的共同作用,导致了此次臭氧污染的形成。且日间臭氧的局地光化学反应生成对日间臭氧浓度贡献显著。
4)濠江区臭氧生成主要受人为源VOCs控制与影响。人为源VOCs关键活性组分分别为:间/对二甲苯、甲苯和其他低活性芳香烃类,主要来源于溶剂使用;C6以上活性较大的烷烃,主要来源于溶剂使用和机动车排放;丙烯等直链烯烃和反-2-丁烯等支链烯烃,主要来源于油燃烧排放。这5种关键活性组分占臭氧污染日RIR值的69.6%,主要来源为溶剂使用源(32.4%),其次为机动车排放源(20.9%)和汽油泄露与挥发源(15.5%)。基于OBM的污染源削减敏感性分析结果显示,削减溶剂使用源对降低濠江区臭氧局地生成的效果最好,应重点关注保税区的化学原料和化学制品制造业、医药制造业。
综上所述,汕头市濠江区臭氧污染控制措施应先控制VOCs的排放,需要加强对溶剂使用企业的管控和减少机动车尾气排放。


 下载:
下载:
