-
温室气体排放是全球气候变化的重要诱因[1]。甲烷是仅次于二氧化碳的温室气体,具有远高于二氧化碳的升温潜势和较短的大气寿命。甲烷减排对缓解气候变化和全球变暖具有重要意义[2]。国际能源署 (International Energy Agency, IEA) 相关数据显示,自工业革命以来,甲烷对全球温升的贡献已达到30%,故甲烷减排被认为是实现巴黎协定目标的关键举措[3]。油气行业是大气环境中甲烷的重要排放源[3-17]。IEA发布的报告显示,能源行业对全球甲烷排放量的贡献比例接近40%,其中油气行业甲烷排放量达到约7.900×10⁷ t[3]。油气生产井、收集与增压站、处理场站等设施均会向大气环境排放大量甲烷,设备组件与管线泄漏、储罐、装卸及有组织排放等为主要排放源[5-17]。
CHEADL等[5]对油气生产设备泄漏导致的甲烷排放及减排潜力进行了分析。BRANTLEY等[9]、ALLEN等[10,12-13]和JOHNSON等[7]分别对油气生产井场、气动设备、储罐及返排过程甲烷排放情况进行了系统监测。MITCHELL等[11]对油气收集和处理环节甲烷排放进行研究。结果表明,页岩气生产井场平均甲烷排放为9.5 kg·d−1,而天然气处理场站甲烷排放速率为3~600 kg·h−1[6,11]。储罐和气动阀对甲烷排放总量贡献比例较高[7]。美国油气开发过程实测甲烷排放量要高于温室气体排放清单数据[9-10];超级排放源对油气生产过程甲烷排放影响显著[15]。
与美国页岩气开发过程相比,我国油气主要源于常规油气田,油气开发与处理过程与页岩气差异较大,相关环节甲烷排放研究较少,处理场站等设施甲烷排放特征不明确,难以支撑油气行业开展温室气体减排工作[18-19]。针对上述问题,本研究以西北地区大型油气田典型油气处理场站为样本,开展油气处理过程甲烷排放特征研究,以明确生产设备设施的泄漏率,量化重点源项甲烷排放速率、设备与设施排放因子及年度排放量,并针对排放特征给出治理建议,以期对完善我国油气开发过程甲烷排放基数,指导国内油气行业绿色低碳发展,开展温室气体减排工作提供参考。
-
3座油气处理场站位于我国西部某大型油气田。油气处理场站工艺过程主要包括集气单元 (负责单井来气收集与计量) 、初级分离、节流降温、二次分离、深度净化、液态烃稳定单元、污水集输和污水处理单元等工艺部分。典型工艺流程如图1所示。
-
本研究主要使用便携式火焰离子检测仪 (DataFID,INFICON,USA) 和Hi-FLOW大流量计 ( Bacharach Inc., New Kensington, PA) 等设备开展泄漏监测和排放速率量化。参考的标准规范主要包括:《工业企业挥发性有机物泄漏检测与修复技术指南 (HJ 1230-2021) 》、《陆上石油天然气开采工业大气污染物排放标准 (39728-2020) 》、《挥发性有机物无组织排放控制标准 (GB37822-2019) 》和《泄漏和敞开液面排放的挥发性有机物检测技术导则 (HJ 733-2014) 》等[20-23]。
对照标准要求[20],进行油气处理场站设备与工艺适用性分析。随后,通过便携式FID开展组件泄漏检测,明确泄漏点位置及浓度[20,23]。最后,利用大流量仪对泄漏点进行排放速率量化,主要技术参数如表1所示。排放速率量化具体过程为[9-10]:通过大流量仪内置泵将泄漏点泄漏组分及周围环境空气吸入仪器,同步测量被吸入气体体积流量和总烃 (甲烷+VOCs) 体积浓度,利用内嵌的处理单元经数据处理后给出总烃排放速率 (L·min−1) 。
为开展甲烷排放速率量化分析,需明确各排放源外排气中甲烷体积占比。利用SUMMA罐对各排放源外排组分进行采集,采样时间为15 min,采样流量为200 mL·min−1,平行采集2组气体样品。通过对采集样品进行组分分析,得到甲烷与VOCs体积分数比。基于排放源体积排放速率、甲烷占比等信息,进行重点源项甲烷排放速率量化。
-
便携式FID进行泄漏筛查时,浓度连续记录,数据间隔为1 s,记录时间为2 min。如无特殊说明,本文给出的浓度值均为测试时间范围内的平均值。采用Hi-Flow大流量仪开展总烃排放速率量化分析,检测时长为15 min。
基于各排放源大流量检测数据进行总烃排放速率量化,计算方法如式 (1) 所示。
式中:V为总烃排放速率,L·min−1;n为总检测时间,min;Vi: 检测时刻为i时对应的总烃排放速率,L。
基于各排放源总烃排放速率和甲烷占比进行甲烷排放速率量化,计算方法如式 (2) 所示。
式中:
${\mathrm{C}}_{{\mathrm{CH}}_4} $ 为甲烷体积分数。 -
参照《工业企业挥发性有机物泄漏检测与修复技术指南 (HJ 1230-2021) 》[20],统计3座油气处理场站密封点数量及泄漏情况如表2所示。密封点统计涵盖:泵 (P);压缩机 (轴封)(Y);搅拌器 (轴封)(A) ;阀门 (V);泄压设备 (安全阀)(R) ;取样连接系统 (S);开口阀或开口管线 (O);法兰 (F) ;连接件 (螺纹连接)(C) 和其他 (Q) 等类别。结合油气处理场站实际情况,将密封点分为压力表 (压力表、压变表、压力远传、温度表、温度远传)、阀门、法兰、连接件 (连接件、取样连接系统、放空管线)、储罐和压缩机等6大类。3座处理场站密封点合计14 623处,泄漏浓度超过500 μmol·mol−1 (ppm) 的密封点共有122处,设备管线与组件泄漏率为0.8%。各场站设备组件与管线泄漏率具有一定差异,DH站泄漏率最高,可以达到1.2%,YM站较低,为0.7%。油气处理场站处理物料类型、采用工艺路线、工艺参数及设备运行情况差异等是影响场站密封点泄漏率的重要因素。
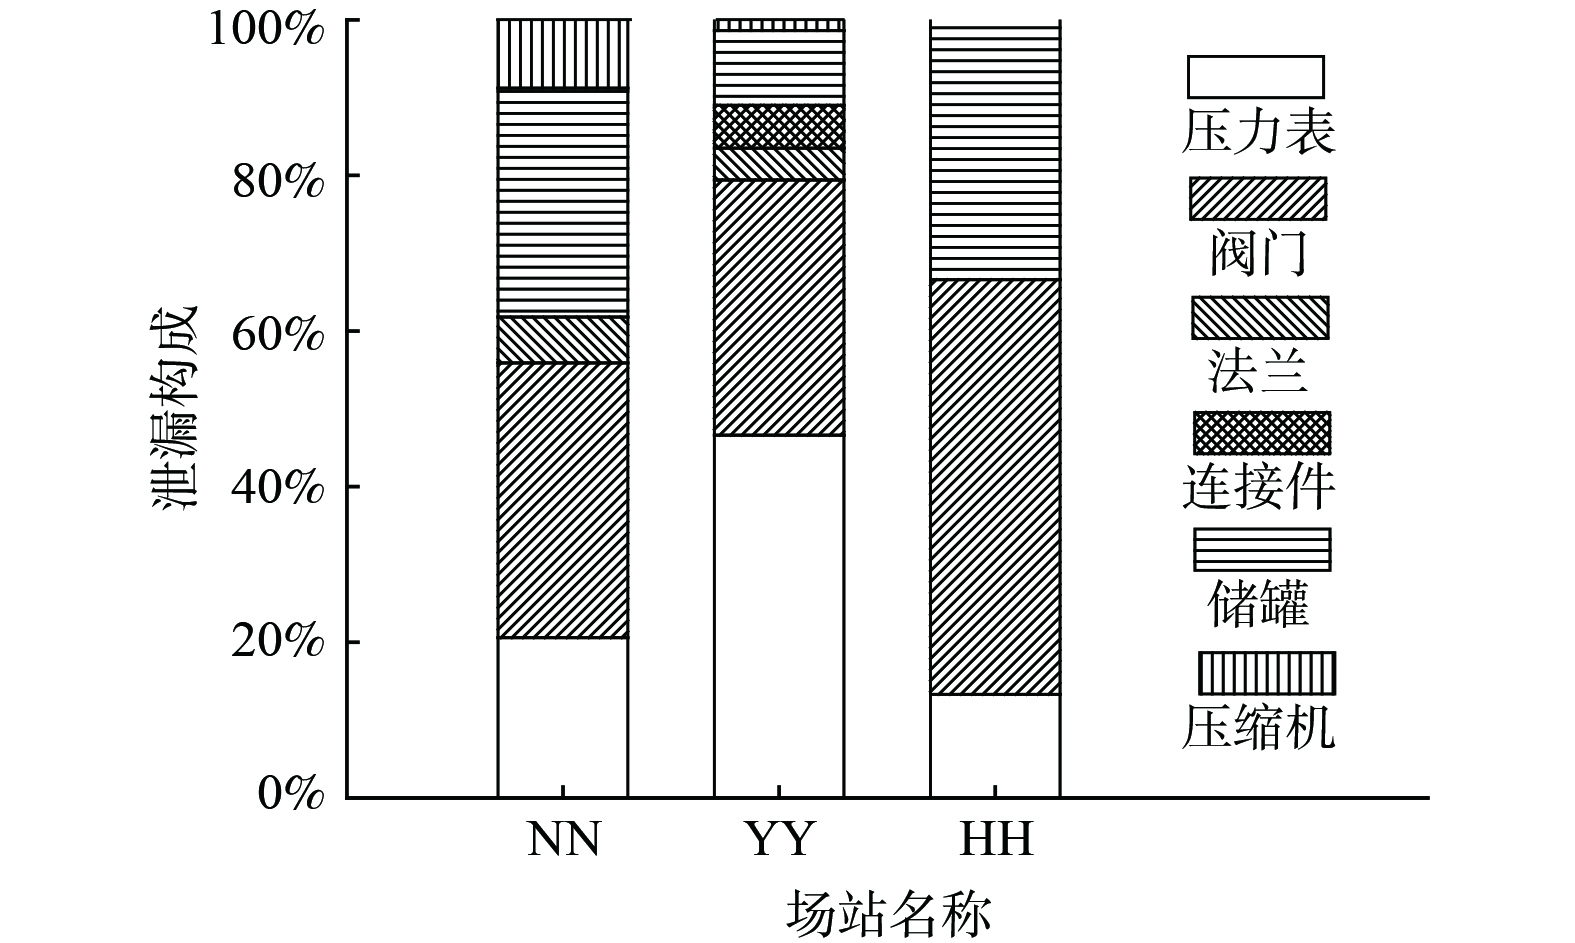
对泄漏点构成情况进行了分析,结果如图2所示。YM处理站泄漏点中压力表源项对泄漏贡献比例最高,达到46.6%,阀门源项紧随其后,对泄漏率贡献比为32.8%;DH和DN处理站泄漏率贡献比例最高的组件为阀门,贡献占比分别为53.3%和35.3%,储罐贡献占比紧随其后,分别为33.4% (DH处理站) 和29.4% (DN处理站) 。综上所述,压力表、阀门及储罐等是最主要的泄漏组件,对油气处理站泄漏贡献比例在80%以上。
对油气处理场压力表、阀门和法兰等类型组件密封点泄漏情况进行了分析,压力表类组件密封点发生泄漏比例为1.1% (YM)~11.8% (DH) ,阀门类组件密封点发生泄漏比例为0.4% (YM)~0.6% (DN) ,法兰类组件密封点发生泄漏比例为0.03% (YM)~0.3% (DH) 。不同类型组件发生泄漏概率差异较大,压力表类组件泄漏率要远高于其他类型设备组件。
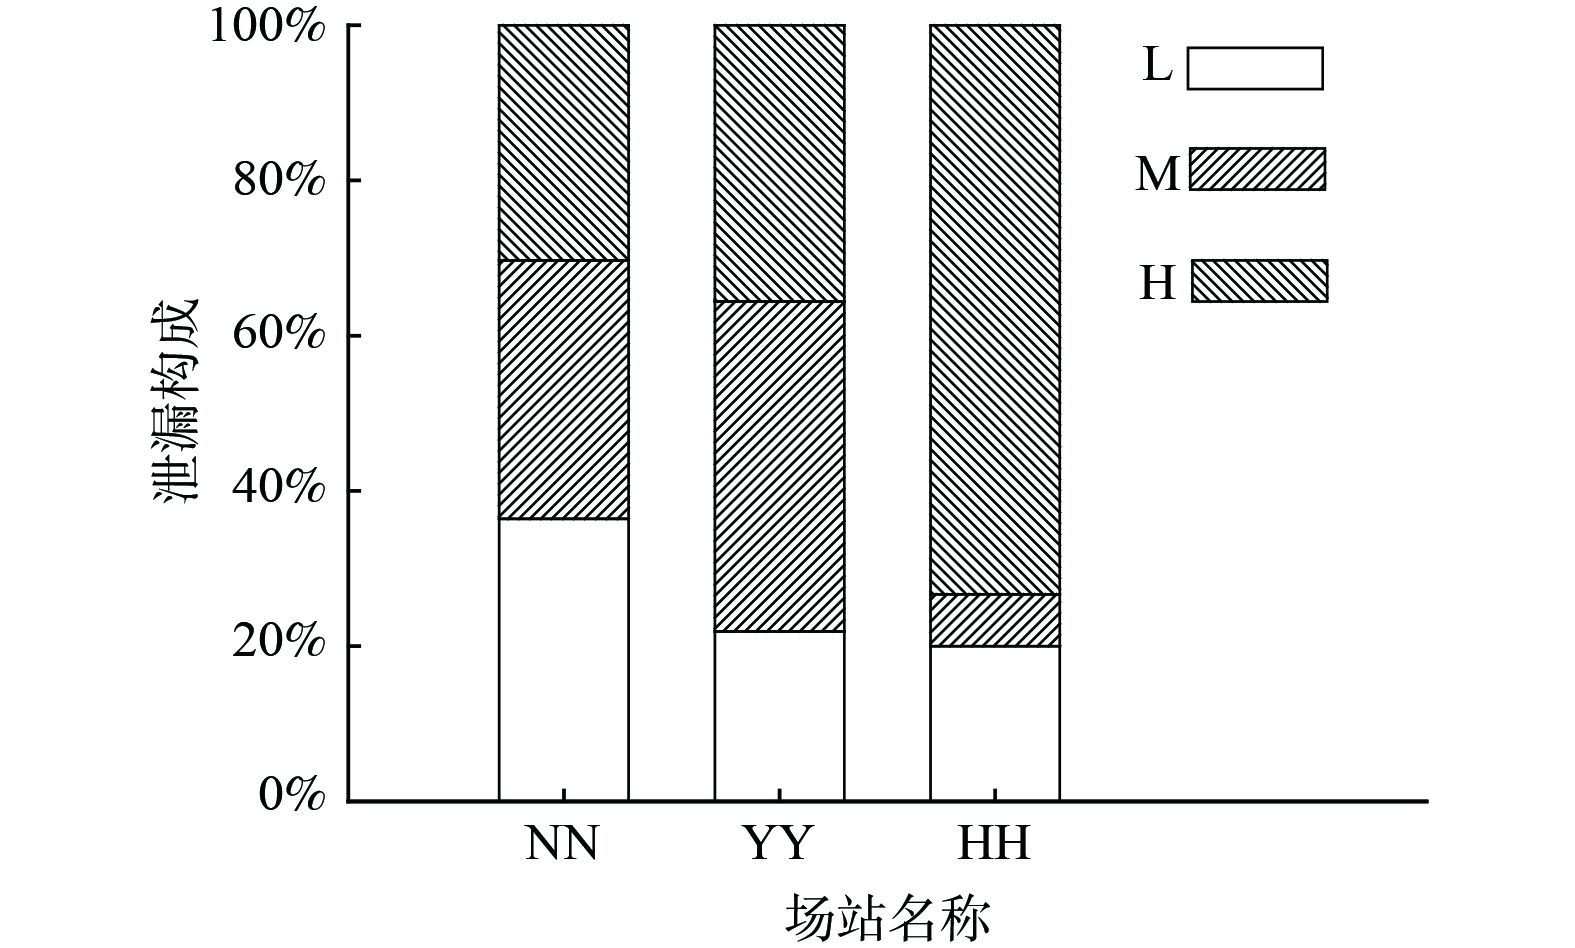
将泄漏点分为低浓度 (L,低于2 000 μmol·mol−1)、中浓度 (M,2 000~10 000 μmol·mol−1) 和高浓度 (H,高于10 000 μmol·mol−1) 等3类泄漏源,不同类别泄漏源构成情况见图3。高浓度泄漏源对DH油气处理站泄漏贡献比例最高,为73.3%;低浓度泄漏点对DN油气处理站泄漏贡献比例最高,为36.4%;而YM油气处理站泄漏点中,中浓度源项占比最高,达到42.5%。
结合现场情况,分析了组件泄漏原因。对油气处理站内压力表而言,均需进行定期检定。检出的43处泄漏压力表中,有37处刚完成检定并重新安装。检出泄漏后,经现场人员紧固后再次复测后,检测出浓度低于10 μmol·mol−1。分析看来,压力表定期检定后安装不到位是造成该类型组件泄漏的最主要原因。对阀门而言,受力不均导致的阀杆部位异位,长时间磨损导致的填料或密封部件破损等是该类组件泄漏的主要原因。对储罐而言,呼吸阀和量油口等是主要排放点,呼吸阀密封损坏、人孔和量油口密封不严是潜在原因。
-
《陆上石油天然气开采工业大气污染物排放标准 (39728-2020) 》将天然气系统泄漏标准设定为2 000 μmol·mol−1 (重点地区)。对标国家相关要求,对40处泄漏点 (大于2 000 μmol·mol−1) 的甲烷排放速率进行了量化分析,其中压力表类源项22处,阀门类源项16处,法兰类2处,结果见表3所示。压力表类 (P)、阀门类 (V) 及法兰类 (F) 等源项排放速率具有显著差异,压力表类源项甲烷排放速率为0.006~13.107 L·min−1,平均排放速率为1.247 L·min−1;阀门源项甲烷排放速率为0.002~2.365 L·min−1,平均排放速率为0.377 L·min−1,法兰类源项排放速率为0.006~0.180 L·min−1,平均排放速率为0.093 L·min−1。
进一步分析,排放速率低于0.1 L·min−1的排放源 (低强度源项) 占比为60%,排放速率为0.1~1 L·min−1的排放源 (中等强度源项) 占比为25%,排放速率超过1 L·min−1的排放源 (高强度排放源项) 占比为15%。综上所述,油气处理场站设备组件与管线泄漏源的甲烷排放速率以中低强度为主。
-
储罐和压缩机是油气处理场站重要设备。其中,储罐主要用于存储原油 (含凝析油和轻烃) 和污水 (包括含油污水、污油和处理后污水)。13台储罐 (T) 和1台压缩机 (Y) 的甲烷排放速率量化结果见表4。表中储罐命名按油气处理站 (YM,DH和DN)+储罐字母 (T)+编号原则进行命名。受限于油气处理场站基本情况,不同物料和类型储罐监测数量略有差异,其中轻烃物料内浮顶储罐小呼吸过程仅完成1座储罐监测。
储罐甲烷排放速率较高。其中,凝析油拱顶罐大呼吸过程的甲烷排放速率范围为71.25~133.30 L·min−1,均值为102.9 L·min−1;小呼吸过程的甲烷排放速率为0.68~33.8 L·min−1,均值为12.4 L·min−1。含油污水拱顶罐大呼吸过程的甲烷排放速率为71.76~133.30 L·min−1,均值为88.1 L·min−1,污水拱顶罐大呼吸过程的甲烷排放速率范围为2.07~2.94 L·min−1,均值为2.51 L·min−1;轻烃内浮顶罐大呼吸过程的甲烷排放速率范围为5.91~10.8 L×min−1,均值为8.36 L·min−1;小呼吸过程的甲烷排放速率为0.25 L·min−1。
储罐甲烷排放速率受储罐类型、存储物料性质及工况等等影响显著。总体而言,拱顶罐排放速率要显著高于内浮顶储罐,对相同物料和同一类型储罐而言,大呼吸过程排放速率要高于小呼吸过程。对拱顶罐而言,凝析油进料过程甲烷排放源速率略高于污油进料过程,高于含油污水进料过程,显著高于污水进料过程。需要指出的是,在不同油气处理场站,同类物料和同类型储罐甲烷排放速率具有一定差异,工况与物料精细化组成差异是潜在原因。
-
参照美国API经验做法[24],通过对各泄漏源项和排放环节排放速率进行线性加和,初步量化了油气处理场站甲烷排放速率,结果见表5。油气处理场站甲烷排放速率为111.66~274.63 L·min−1,均值排放速率为192.66 L·min−1。其中,DH油气处理站甲烷排放速率较高,YM油气处理站甲烷排放速率较低。
对场站级排放速率差异进行初步分析,结果如图4所示。油气处理场站甲烷排放速率与站内密封点数量、泄漏数量、油类物料储罐数量具有较高的线性关系,与储罐总数量线性关系较小。综合看来,泄漏点与油类物料储罐 (数量差异、排放速率差异) 是影响各油气处理站甲烷排放速率的主要因素。
-
量化了设备和设施级甲烷排放因子,并与国、内外甲烷排放因子进行了对比,结果见表6。本研究所得储罐源项甲烷排放因子与国外油气开发过程储罐甲烷排放因子基本一致,为989.9 L·h−1。与发改委[25]及美国API温室气体核算大纲[24]等机构数据相比,本研究所得油气处理场站级甲烷排放因子显著低于国外水平,仅为国内平均水平的25%左右。美国页岩气开发过程涉及大量气动阀[12],会导致显著甲烷排放。本研究涉及的油气处理场站处理工艺与国外具有较大差异,气动阀数量较少,故会导致甲烷排放因子大幅降低。
-
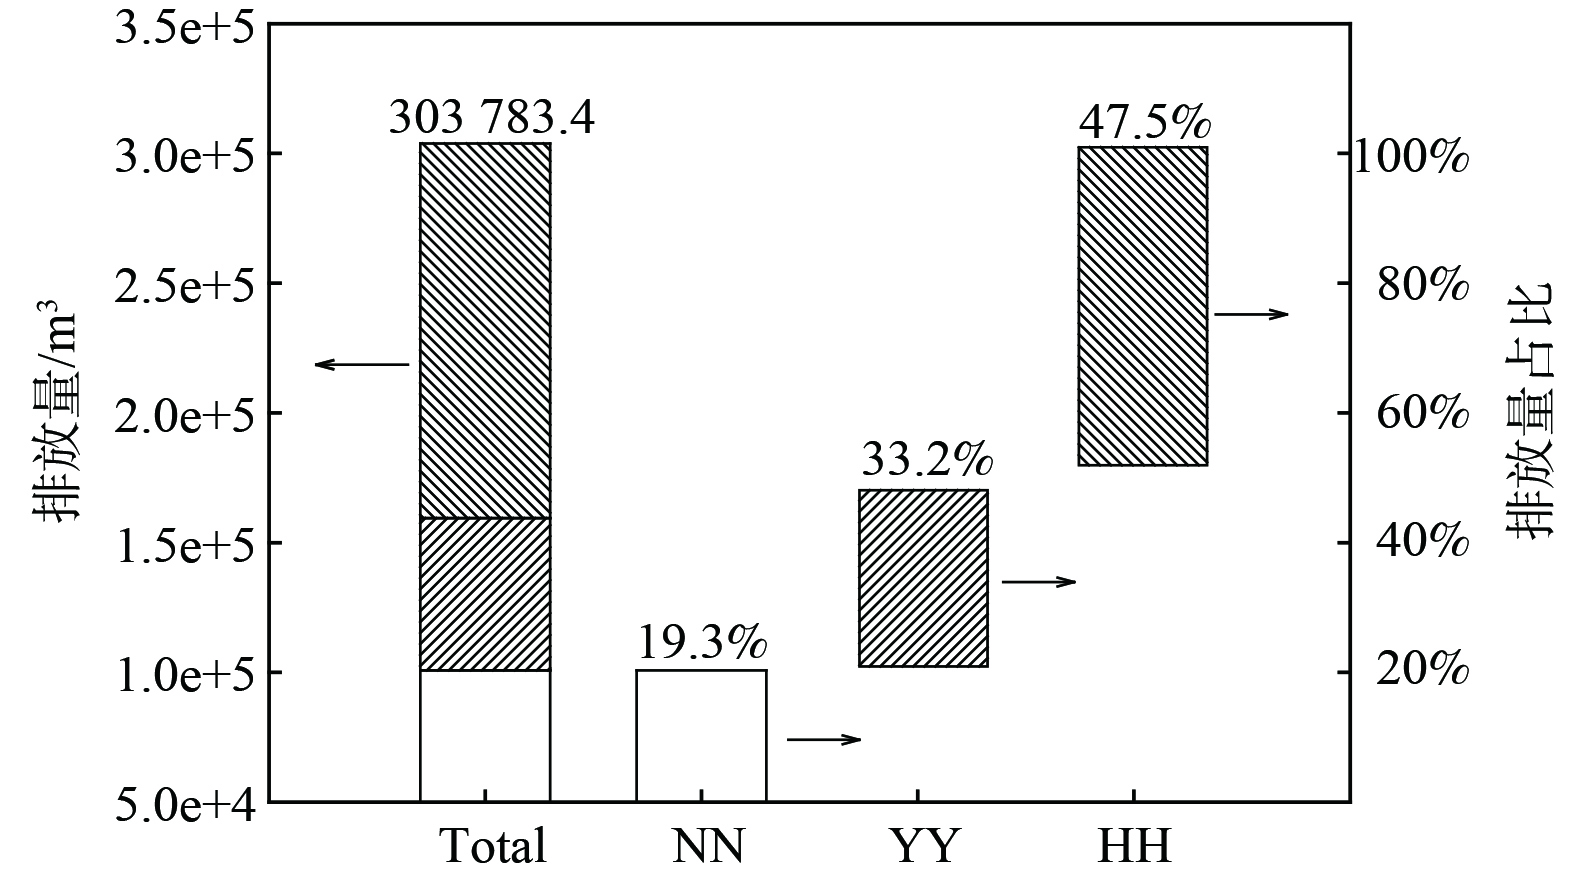
假定各排放源非监测阶段甲烷排放速率与监测阶段一致,对3座油气处理站甲烷年度排放量进行了估算(图5)。结果表明,设备组件与管线泄漏点及储罐等源项合计甲烷排放量达到303 783.40 m3 (约216.99 t) 。各场站对甲烷年度排放量贡献比例差异大,DH处理站贡献比例最高为47.5%,YM处理站紧随其后,DN处理站贡献比例最低,为19.3%。
对3座油气处理场站年度甲烷排放量构成特征进行了分析。结果显示,储罐源项是最主要甲烷排放源,对总甲烷排放量的贡献比例达到94.1%,设备组件与管线泄漏源项仅排放了5.9%的甲烷。对储罐源项甲烷构成进行了分析,结果表明,进料过程 (大呼吸排放+闪蒸气) 导致的甲烷排放量占储罐甲烷排放量95.9%,静置过程 (小呼吸过程) 产生的甲烷占总量比例为4.1%,储罐外排甲烷主要源于进料过程。
研究表明,油气处理过程少数排放源对甲烷排放量贡献比例可以超过50%以上,此类排放源被定义为超级排放源[15]。对油气处理过程设备组件与管线泄漏甲烷排放量构成进行了分析,不同泄漏点对甲烷排放量贡献比例具有显著差异,占比仅为15%的泄漏点对组件泄漏产生的甲烷排放量贡献比例达到88.4%,占比为85%的泄漏点对组件泄漏甲烷排放量贡献比例仅为11.6%。CHEADL等[5]指出,20%泄漏点对组件泄漏甲烷排放量贡献比例达到50%。我国油气处理过程组件泄漏产生的甲烷排放主要源于高排放速率泄漏源,该结论与国外油气处理过程规律一致。
-
1) 加强设备组件与管线密封点泄漏监管。加强压力表等设备检定安装过程泄漏评估,通过配备便携式仪器,对安装完成的压力表进行泄漏检测,确保安装到位,减少因安装不到位导致的甲烷泄漏。2) 强化油气处理过程储罐呼吸气治理。储罐源项对油气处理场站甲烷排放量贡献比例超过90%,是油气处理站最主要的甲烷排放源。目前,已有油气企业布局储罐呼吸气压缩回收、火炬焚烧等治理和减排措施,甲烷废气治理取得显著成效。建议系统开展油气开发过程储罐甲烷排放现状摸排,明确甲烷排放特征,结合现场工艺配套情况,通过呼吸气回收耦合压缩、冷凝和燃烧等单元,对呼吸气进行回收利用或消解处理,实现甲烷减排。
-
1) 我国典型油气处理站组件泄漏率范围为0.7%~1.2%,压力表、阀门及储罐是最主要泄漏源。
2) 组件、设施和场站甲烷排放速率具有显著差异。压力表类源项甲烷排放速率为0.006~13.107 L·min−1,阀门源项甲烷排放速率范围为0.002~2.365 L·min−1,法兰类源项排放速率为0.006~0.180 L·min−1。储罐甲烷排放速率受储罐类型、物料类别及工况等影响显著,凝析油拱顶罐大呼吸过程的甲烷排放速率为71.25~133.30 L·min−1,轻烃内浮顶罐大呼吸过程的甲烷排放速率为5.91~10.8 L·min−1。油气处理场站甲烷排放速率为111.66~274.63 L·min−1,泄漏点数量和油类储罐数量是主要影响因素。
3) 储罐甲烷排放因子 (989.9 L×h−1) 与美国基本相当,处理场站排放因子 (0.19 L·m−3) 远小于国外水平。
4) 3座油气处理站年度甲烷排放量为303 783.40 m3 (约216.99 t);储罐对甲烷排放贡献比例最高 (94.1%);储罐甲烷主要源于进料过程。
5) 设备管线与组件泄漏源项甲烷主要源项高强度排放源项,占比15%的高排放速率源项对泄漏甲烷排放量贡献比例达到88.4%。
油气处理场站温室气体甲烷排放特征与量化
Characteristics and quantification of greenhouse gas methane emission from oil and gas processing plant
-
摘要: 油气生产过程是甲烷重点排放源,对气候变化产生显著影响。采用便携式火焰离子检测器 (FID) 和Hi-Flow大流量仪等设备,对我国某油田3座油气处理场站甲烷泄漏排放特征进行了研究,明确了组件泄漏率,量化了重点源项甲烷排放速率,构建了设备设施甲烷排放因子,开展了甲烷排放量核算并提出了管控建议。结果表明,该油田油气处理场站设备组件与管线的甲烷泄漏率为0.7%~1.2%,压力表、阀门和储罐等在泄漏源项中占比较高。不同类型泄漏组件甲烷排放速率具有显著差异,处理场站的甲烷排放速率为111.66~274.63 L·min−1。单个储罐和场站的甲烷排放因子分别为989.9 L·h−1和0.19 L·m−3。3座场站年度甲烷排放量为303 783.40 m3,储罐是首要排放源,对总排放量贡献占比为94.1%。组件泄漏导致的甲烷排放主要源于高强度排放源,15%的泄漏点贡献了排放量的88.4%。该研究结果可为油田油气处理场站泄漏防控和温室气体排放控制提供参考。Abstract: Oil and gas (OG) production processes are key methane emissions sources, having prominent climate implications. Three OG processing plant located in a typical oil field in China were measured using portable FID and Hi-Flow Sampler in this work. The component based leakage characteristics and emission rates were studied and quantified, and corresponding abatement and management suggestions were proposed. The leak detection and repair results suggested that 0.7%~1.2% component and lines have leak problem, with pressure gauge, valve and tank having the largest contribution. There are distinct differences among emission rates for OG processing related components, and 111.66~274.63 L·min−1 methane released from OG plant. The established methane emission factor was 989.9 L·h−1 and 0.19 cubic meter per 1000 meters gas processed. In summary, almost 303 783.4 cubic meters methane were emitted from the measured sources annually, with tank contributing 94.1% total emission. As to component leak-related methane, most fraction derived from high emission source and 15% leaking point contributes more than 88.4% of leak-related methane.The research findings can provide reference for leak prevention and control and Greenhouse gas emission control in oil and gas processing plants.
-
Key words:
- oil and gas /
- methane /
- emission source /
- leak /
- emission rate
-

-
表 1 Hi-Flow 大流量仪技术参数
Table 1. Technical specification for Hi-Flow sampler
序号 技术参数 基本情况 1 流量范围 0.01~300 L·min−1 2 体积分数范围 0~100% 3 检测方法 催化氧化 4 精度 甲烷体积分数0.02% 5 稳定工况抽气速率 200 L×min−1 6 电池类型 镍氢充电包 7 电压 5.5 V 8 工作时长 4.5 h 9 安全等级 本质安全 表 2 油气处理场站泄漏情况
Table 2. Leakage information on oil and gas processing plant
场站及项目名称 密封点数/处 泄漏点数/处 泄漏率 DN 3 083 34 1.1% YM 10 282 73 0.7% DH 1 258 15 1.2% 合计 14 623 121 0.8% 表 3 油气处理场站泄漏组件甲烷排放速率
Table 3. Emission rate of methane for leaking component in oil and gas processing plant
泄漏组件 排放速率/(L·min−1) 泄漏组件 排放速率/(L·min−1) 泄漏组件 排放速率/(L·min−1) 泄漏组件 排放速率/(L·min−1) P-1# 0.013 P-11# 0.18 P-21 13.107 V-9# 0.074 P-2# 0.176 P-12# 0.357 P-22 5.682 V-10# 0.002 P-3# 0.080 P-13# 0.016 V-1# 0.924 V-11# 0.019 P-4# 0.013 P-14# 2.186 V-2# 0.041 V-12# 0.135 P-5# 0.006 P-15# 0.004 V-3# 0.103 V-13# 0.069 P-6# 0.014 P-16# 4.624 V-4# 0.004 V-14# 0.013 P-7# 0.090 P-17# 0.014 V-4# 1.922 V-15# 0.132 P-8# 0.043 P-18# 0.088 V-6# 0.019 V-16# 0.031 P-9# 0.006 P-19# 0.626 V-7# 0.176 F-1# 0.006 P-10# 0.090 P-20# 0.012 V-8# 2.365 F-2# 0.180 表 4 生产设施甲烷排放速率
Table 4. Emission rate of methane for production facility
设施 L×min−1 设施 L×min−1 YM-T-1#(凝析油,小呼吸,拱顶) 0.68 DH-T-4#(处理后污水,大呼吸,拱顶) 2.94 YM-T-2#(凝析油,大呼吸,拱顶) 71.25 DN-T-1#(含油污水,大呼吸,拱顶) 104.43 YM-T-3#(轻烃,大呼吸,内浮顶) 5.91 DN-T-2#(含油污水,大呼吸,拱顶) 71.76 YM-T-4#(轻烃,小呼吸,内浮顶) 0.25 DN-T-3#(处理后污水,大呼吸,拱顶) 2.07 DH-T-1#(凝析油,小呼吸,拱顶) 33.80 DN-T-4#(凝析油,小呼吸,拱顶) 2.60 DH-T-2#(凝析油,大呼吸,拱顶) 104.35 DN-T-5#(轻烃,大呼吸,内浮顶) 10.80 DH-T-3#(凝析油,大呼吸,拱顶) 133.30 Y-1# 0.96 表 5 各油气场站的甲烷排放速率
Table 5. Emission rate of methane for oil and gas processing plant
L·min−1 YM DH DN 均值 111.66 274.63 191.68 192.66 表 6 甲烷排放因子对比
Table 6. Comparison of methane emission factor
源项 本研究 文献[25] 文献[24] 储罐 989.9 L·h−1 (均值) — 950.9 L·h−1 场站 0.19 L·m−3 0.74 L·m−3 1.34 L·m−3 -
[1] Intergovernmental Panel on Climate Change(IPCC). Global Warming of 1.5oC: An IPCC Special Report on the impacts of global warming of 1.5oC above pre-industrial levels and related global greenhouse gas emission pathways, in the context of strengthening the global response to the threat of climate change, sustainable development, and efforts to eradicate poverty[R]. IPCC, 2018. [2] NISBET E G, MANNING M R, DLUGOKENCY E J, et al. Very Strong atmospheric methane growth in the 4 years 2014-2017: Implications for the Paris Agreement[J]. Global Biogeochemical Cycles, 2019, 33: 318-342. doi: 10.1029/2018GB006009 [3] IEA. Global methane tracker 2022[R/OL]. IEA, Parishttps://www.iea.org/reports/global-methane-tracker-2022. [4] U. S. Environmental Protection Agency. Inventory of U. S. Greenhouse Gas Emissions and Sinks: 1990-2018[R]. EPA, 2020. [5] CHEADL L, TRAN T, NYARADY J F, et al. Leak detection and repair data from California’s oil and gas methane regulation show decrease in leaks over two years[J]. Environmental Challenges, 2022, 8: 100563. doi: 10.1016/j.envc.2022.100563 [6] ZHOU X C, YOON S, MARA S, et al. Mobile sampling of methane emissions from natural gas well pads in California[J]. Atmospheric Environment, 2021, 244: 117930. doi: 10.1016/j.atmosenv.2020.117930 [7] JOHNSON D, CLARK N, HELTZEL R, et al. Methane emissions from oil and gas production sites and their storage tanks in West Virginia[J]. Atmospheric Environment:X, 2022, 16: 100193. doi: 10.1016/j.aeaoa.2022.100193 [8] 乐群, 张国君, 王铮. 中国各省甲烷排放量初步估算及空间分布[J]. 地理研究, 2012, 31(9): 15-26. [9] BRANTLEY H L, THOMA E D, LYON D, et al. Assessment of methane emissions from oil and gas production pads using mobile measurements[J]. Environmental Science & Technology, 2014, 48: 14508-14515. [10] ALLEN D T, TORRES V M, THOMAS J, et al. Measurements of methane emissions at natural gas production sites in the United States[J]. Proceedings of the National Academy of Sciences of the United States of America, 2013, 110(44): 17768-17773. [11] MITCHELL A L, TKACIK D S, ROSCIOLI J R, et al. Measurements of methane emissions from natural gas gathering facilities and processing plants: Measurement results[J]. Environmental Science & Technology, 2015, 49: 3219-3227. [12] ALLEN D T, SULLIVAN P D, ZAVALA-ARAIZA D, et al. Methane emissions from process equipment at natural gas production sites in the United States: Pneumatic controllers[J]. Environmental Science & Technology, 2015, 49: 633-640. [13] ALLEN D T, SULLIVAN P D, ZAVALA-ARAIZA D, et al. Methane emissions from process equipment at natural gas production sites in the United States: Liquid unloadings[J]. Environmental Science & Technology, 2015, 49: 641-648. [14] ZAVALA-ARAIZA D, LYON D R, ALVAREZ R A, et al. Reconciling divergent estimates of oil and gas methane emissions[J]. Proceedings of the National Academy of Sciences of the United States of America, 2015, 112: 15597-15602. [15] MILLER S, WOFSY S C, MICHALAK A M, et al. Anthropogenic emissions of methane in the United States[J]. Proceedings of the National Academy of Sciences of the United States of America, 2013, 110(50): 20018-20022. [16] LYON D R, ALVAREZ R A, ZAVALA-ARAIZA D, et al. Aerial surveys of elevated hydrocarbon emissions from oil and gas production sites[J]. Environmental Science & Technology, 2016, 50(9): 4877-4886. [17] FLOERCHINGER C, MCKAIN L, BONIN T, et al. Methane emissions from oil and gas production on the North Slope of Alaska[J]. Atmospheric Environment, 2019, 218: 116985. doi: 10.1016/j.atmosenv.2019.116985 [18] ZANG K P, ZHANG G, WANG J Y. Methane emissions from oil and gas platforms in the Bohai Sea, China[J]. Environmental Pollution(B), 2020, 263: 114486. doi: 10.1016/j.envpol.2020.114486 [19] 薛明, 翁艺斌, 刘光全, 等. 石油与天然气生产过程甲烷逃逸排放检测与核算研究现状及建议[J]. 气候变化研究进展, 2019, 15(2): 85-93. [20] 生态环境部. 工业企业挥发性有机物泄漏检测与修复技术指南(HJ 1230-2021)[S]. 中华人民共和国生态环境部, 2021. [21] 生态环境部. 陆上石油天然气开采工业大气污染物排放标准(39728-2020)[S]. 中华人民共和国生态环境部, 2020. [22] 生态环境部. 挥发性有机物无组织排放控制标准(GB37822-2019)[S]. 中华人民共和国生态环境部, 2019. [23] 生态环境部. 泄漏和敞开液面排放的挥发性有机物检测技术导则(HJ733-2014)[S]. 中华人民共和国生态环境部, 2015. [24] American Petroleum Institute. Compendium of greenhouse gas emissions estimation methodologies for the Natural Gas and Oil Industry[R]. API, 2021. [25] 国家发展改革委员会. 中国石油和天然气生产企业温室气体排放核算方法与报告指南(试行)[R]. 国家发展改革委员会, 2014. -


 下载:
下载:


