-
挥发性有机物(volatile organic compounds,VOCs)是城市大气中一种重要的大气污染物。VOCs化学反应活性较高,是产生臭氧的重要前体物质[1-2],并参与雾霾形成[3],故受到越来越多研究者关注。王佳颖等[4]的研究结果表明,北京市夏季大气中O3的生成主要受VOCs控制,特别是受人为源VOCs控制;罗恢泓等[5]发现,上海市中部及东部大气O3的生成亦主要受VOCs控制;韩旸等[6]发现,天津市大气中VOCs的化学反应活性较强,尤其是低碳(C2~C5)的烯烃和烷烃。部分VOCs具有一定的致癌和非致癌毒性作用,如苯、甲苯和1,3-丁二烯等,长期暴露则对人体具有健康风险[7]。现有研究结果表明,工业源是我国 VOCs 的主要排放源[8],因此,加强工业污染控制是大气治理的首要内容[9]。
厦门市位于福建省南部,毗邻台湾海峡。近年来多位学者的研究表明,厦门空气质量呈现明显下降趋势[10]。NIU等[11]研究了厦门市海沧工业区 VOCs 的污染特征;徐慧等[12]研究了厦门冬春季大气VOCs的污染特征及臭氧生成潜势;王坚[13]进行了厦门市VOCs排放特征及光化学反应特征研究。目前,针对厦门市VOCs的相关研究多集中于VOCs污染排放特征及臭氧生成潜势方面,少有针对厦门市具体企业VOCs治理工艺效果及区域性治理效果的评估。空间地理信息系统(geographic information system,GIS)结合区域地理信息,可更有针对性地对各区域VOCs来源及分布等情况进行评估。高爽等[14]借助GIS对常州市区各类大气污染贡献源进行了分析,结果表明工业污染是常州市区最主要的大气污染源,主要污染行业为热电厂和钢铁厂,交通污染次之。黄络萍[15]借助GIS平台对成都市工业源VOCs空间分布特征进行了研究,得出了工业源、溶剂使用源、工艺过程源、化石燃烧源、生物质燃烧源等的相关空间分布及相关地区排放贡献率。
本研究以厦门市8大重点监测行业的企业为代表,通过企业实地调研,实地设备检测等方式,得到VOCs治理设备参数和去除率,进而相关对治理工艺的去除效果进行了评估。同时,运用空间地理信息系统(GIS)将VOCs去除率、排风口VOCs浓度等企业实测参数在地图上进行可视化呈现,据此对厦门市VOCs治理情况进行区域性评价,并与治理工艺的特点相结合进行分析,提出针对不同治理工艺的应用建议,以期为厦门市各重点监测行业的VOCs治理技术选用策略提供参考。
全文HTML
-
综合考虑所调研行政区各行业占比、企业VOCs排放量、国家行业规范以及各级政府管理文件的具体要求,本研究选取厦门市地区8个VOCs重点监测行业(汽车维修、工业涂装、印刷、橡胶、化工、工艺品、制鞋业、船舶维修)的370 家典型工业企业共计439套设备为研究对象,进行了3个阶段的调查(各行业企业数占比如图1所示)。图1数据表明,汽车维修、印刷、化工、橡胶制造4个行业为此次调查所涉及到的主要行业,相关企业分布在厦门全市6个辖区(思明区、湖里区、集美区、海沧区、同安区、翔安区),涉及区域广、VOCs排放占比高。
-
1)数据获取方法。本次调查数据来自于厦门市8大行业VOCs调研,通过实地调研对企业相关处理设备参数(活性炭填装量及更换周期、紫外灯管功率及安装数目、催化剂种类等)进行收集;通过实地检测,对企业设备进出口风量、进出口相关物质浓度(VOCs、苯、甲苯、二甲苯)等进行测量和记录。采用HJ 732-2014《固定污染源废气挥发性有机物的采样气袋法》[16]、HJ 734-2014《固定污染源废气挥发性有机物的测定固相吸附-热脱附/气相色谱质谱法》[17]及HJ 584-2010《环境空气苯系物的测定活性炭吸附/二硫化碳解吸-气相色谱法》[18]对废气进行收集与检测,符合国家相关检测方法规定。
2)VOCs治理工艺实际效果评估方法。工业 VOCs 治理工艺的去除率(η)根据式(1)计算得到。
式中:C1、C2 分别为治理前、后VOCs浓度,mg·m−3;Q1、Q2分别为治理前、后采样口在分析状态下的气体流量,m3·h−1; 根据式(1)可计算出各治理工艺对VOCs的去除率。将苯系物进出口浓度带入C1、C2,根据式(1)可计算各治理工艺对苯、甲苯、二甲苯等苯系物的去除率。
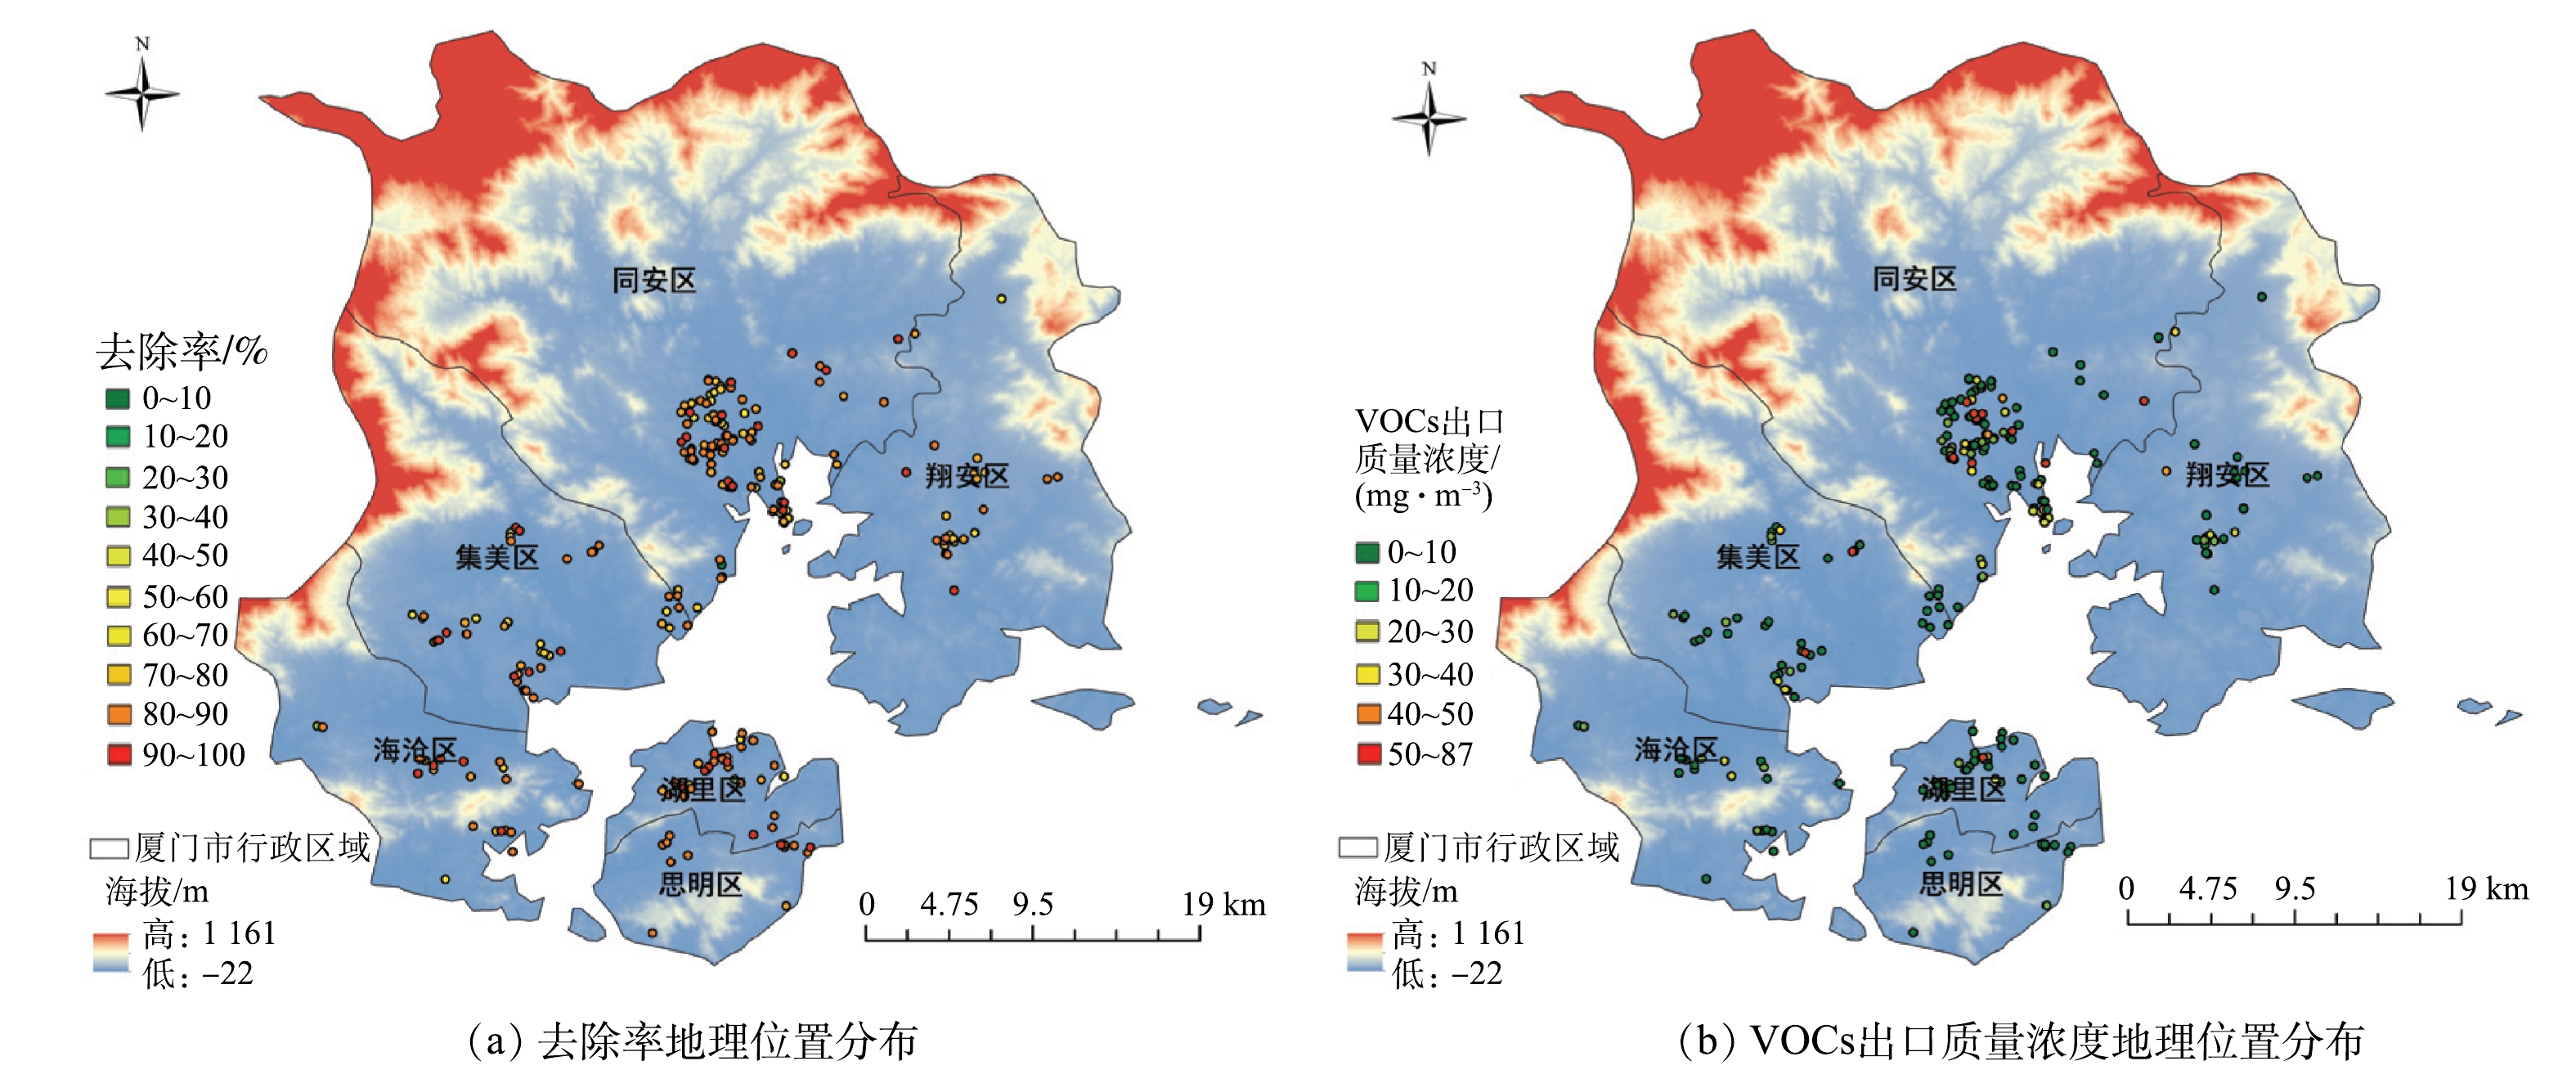
3)基于GIS平台的治理效果评估方法。运用ArcGIS软件将受调查企业标注在厦门市地图上,并按照行业、设备去除率、出口VOCs浓度进行分类,不同梯度采用不同颜色的点进行标注(部分企业存在多套相同工艺设备,需将对应参数取平均值后再进行分类标注),得到相关参数的区域分布图,结合区域图对VOCs的治理效果进行区域性评估。
1.1. 研究对象
1.2. 研究方法
-
根据国民经济行业分类梳理8大行业的细分情况、各子行业排放源及各行业VOCs产生量,结果如表1所示。由表1可见,各种有机化学原料、橡胶、活性剂、黏合剂等原辅材料被广泛使用,印刷、化工及涂装行业大量使用粘合剂、稀释剂等高VOCs产生量的原辅材料,导致这些行业VOCs产生量较大(>1 000 kg·d−1),其中印刷行业VOCs产生量最大,达到5 158.1 kg·d−1,其余行业的VOCs产生量较低。
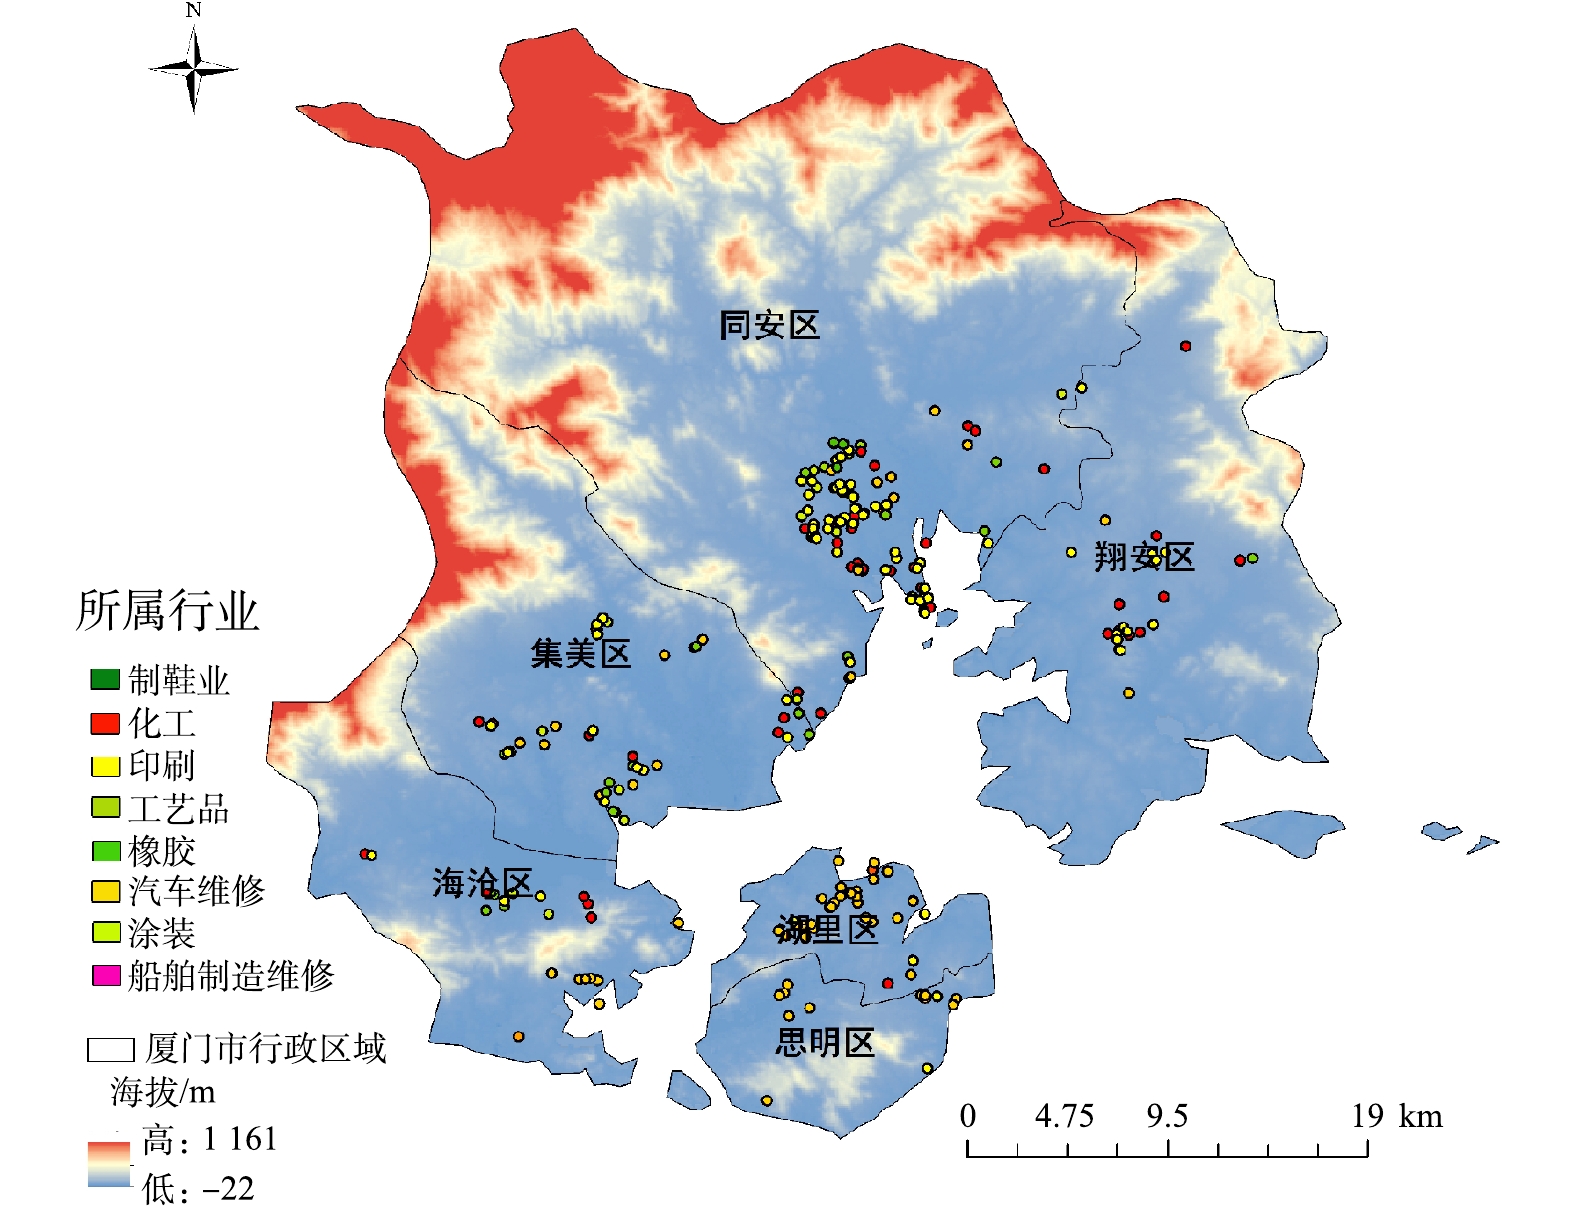
厦门市8大行业企业地理位置分布情况如图2所示。由图2可见,本次调查企业广泛分布于厦门市6个区(海沧区、集美区、同安区、翔安区、湖里区、思明区),其中岛外区域企业数量远多于岛内区域。岛外区域主要以印刷、化工、涂装等高VOCs产生量(>1 000 kg·d−1)行业为主。岛内区域主要以汽车、船舶维修等低VOCs产生量(<1 000 kg·d−1)的服务业行业为主,基本不涉及印刷、化工、涂装等行业,这与厦门市辖区规划和产业布局有关。由于岛内地理位置靠近海域且辖区面积较小,岛内产业主要以旅游、软件、电子以及服务类行业为主,岛外则以大规模的工业企业为主,所以VOCs产生量及排放量也呈现出岛外>岛内的特点。
-
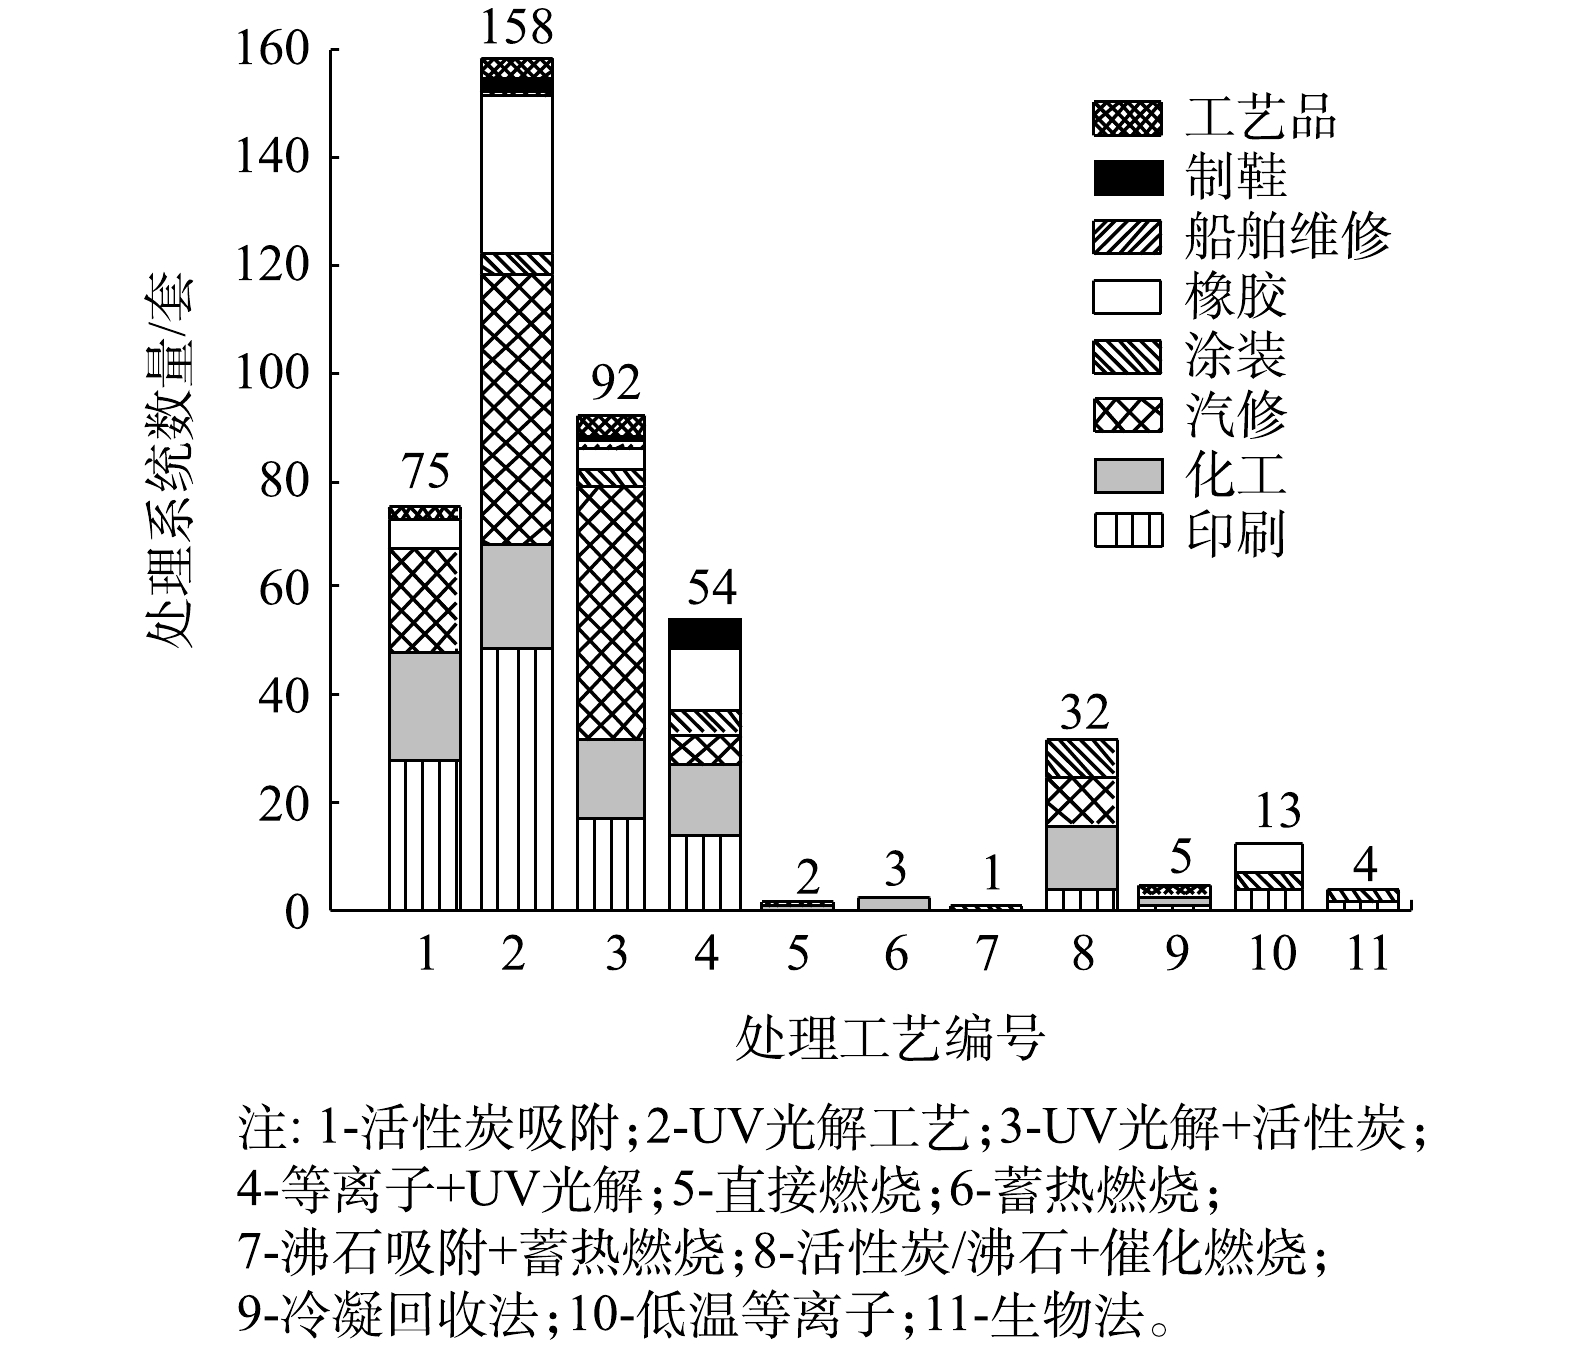
各类VOCs治理工艺在厦门市8大行业中的应用情况如图3所示。由图3可见,从工艺组合上看,多数企业采用单一VOCs治理技术,占调研企业的59.5%,采用组合式VOCs治理技术的企业占被调研企业总数的40.5%。从治理技术的使用分布上看,UV光解(包含UV光解和UV光催化)及其相关组合工艺应用最广,共有304套处理系统,占总数的69.2%,涉及行业主要为汽修、印刷、化工和橡胶;其次为活性炭吸附工艺,共有75套处理系统,占总数的17.1%,其中采用含蜂窝活性炭的处理系统有125套,含颗粒活性炭吸附的处理系统有24套,含纤维活性炭的有18套,涉及行业主要为印刷、化工和汽修;燃烧类工艺(包括直接燃烧、蓄热燃烧、沸石吸附+蓄热燃烧和活性炭/沸石+催化燃烧工艺)在本次调研企业中也有一定比例的应用,共计32套设备,占总数的7.3%,涉及行业主要为化工、汽修和涂装;另有个别企业采用除上述工艺的其他工艺,因数量较少,将其归为其他类工艺进行分析。
-
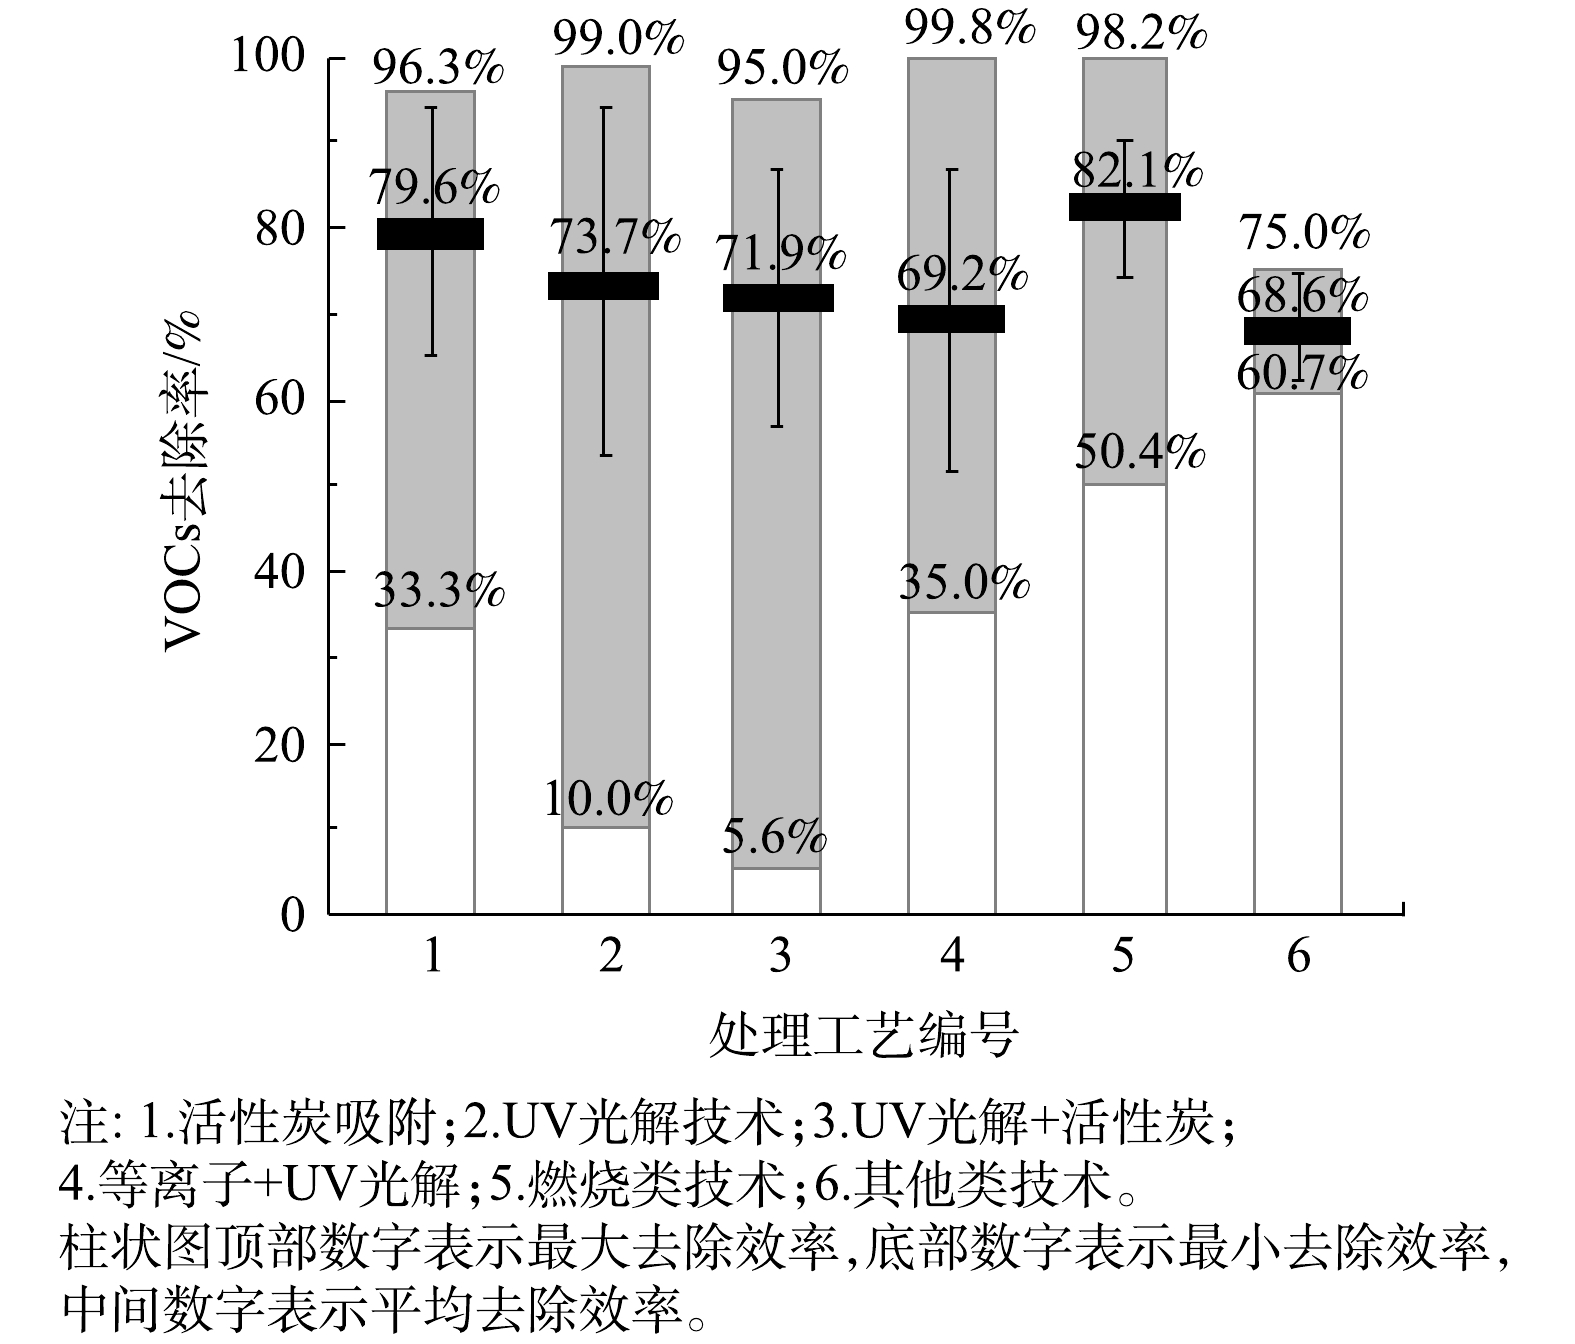
6类处理技术的VOCs去除率如图4所示。在处理的稳定性方面,与活性炭吸附及UV光解有关的工艺VOCs去除率波动较大,去除率的标准偏差也较大,其中“UV光解+活性炭”工艺的标准偏差最大。其可能原因有3点:1)不同行业存在原辅材料、生产工艺和现场环境等方面的差异,故采用同一治理工艺,去除效果也有差异;2)活性炭吸附及其组合工艺存在活性炭相关参数和更换周期差异问题;3)UV光解及相关组合工艺的处理效果受紫外灯管品牌和功率差异、催化剂装填量和方式不同等问题影响。
在平均VOCs去除率方面,6类治理工艺在现场实测条件下的平均去除率为68.6%~82.1%,其中燃烧类工艺的平均去除率最高,其次为活性炭吸附工艺。燃烧类工艺中“活性炭/沸石+催化燃烧”工艺的平均去除率达到80.5%,直接燃烧、蓄热燃烧、“沸石吸附+蓄热燃烧”等工艺虽采用企业较少,但平均去除率也均在90%以上;UV光解及其组合工艺平均去除率较低(均低于75%)。其他类工艺中生物法、低温等离子法、冷凝回收法的平均去除率均在70%左右。
不同处理系统在各个行业中的平均处理效率如表2所示。由表2可知,活性炭吸附工艺对工艺品、印刷、汽修行业的平均去除率较高(均高于80%),治理效果较好,但对橡胶行业的平均去除率仅为63.4%,治理效果较差;UV光解及其组合工艺对汽修行业的平均去除率较高(80%左右),但在印刷、化工、橡胶等行业中平均去除率均较低,治理效果差。燃烧类工艺在各行业处理效果均较好(高于75%),其中在印刷、化工行业处理效果最好,平均处理率均在80%以上。其他类工艺在各行业中发平均去除率为61.2%~74%,处理效果相对较差。
-
甲苯、二甲苯属于苯的同系物,都是煤焦油分馏或石油的裂解产物[19]。苯系化合物已被世界卫生组织确定为强烈致癌物质[20]。由于本次调查涉及大量汽修以及印刷行业企业,部分涂装行业企业,其中含苯系物的油漆、涂料和防水材料的溶剂或稀释剂被广泛使用,故将苯系物去除率也作为VOCs去除效果评定指标。
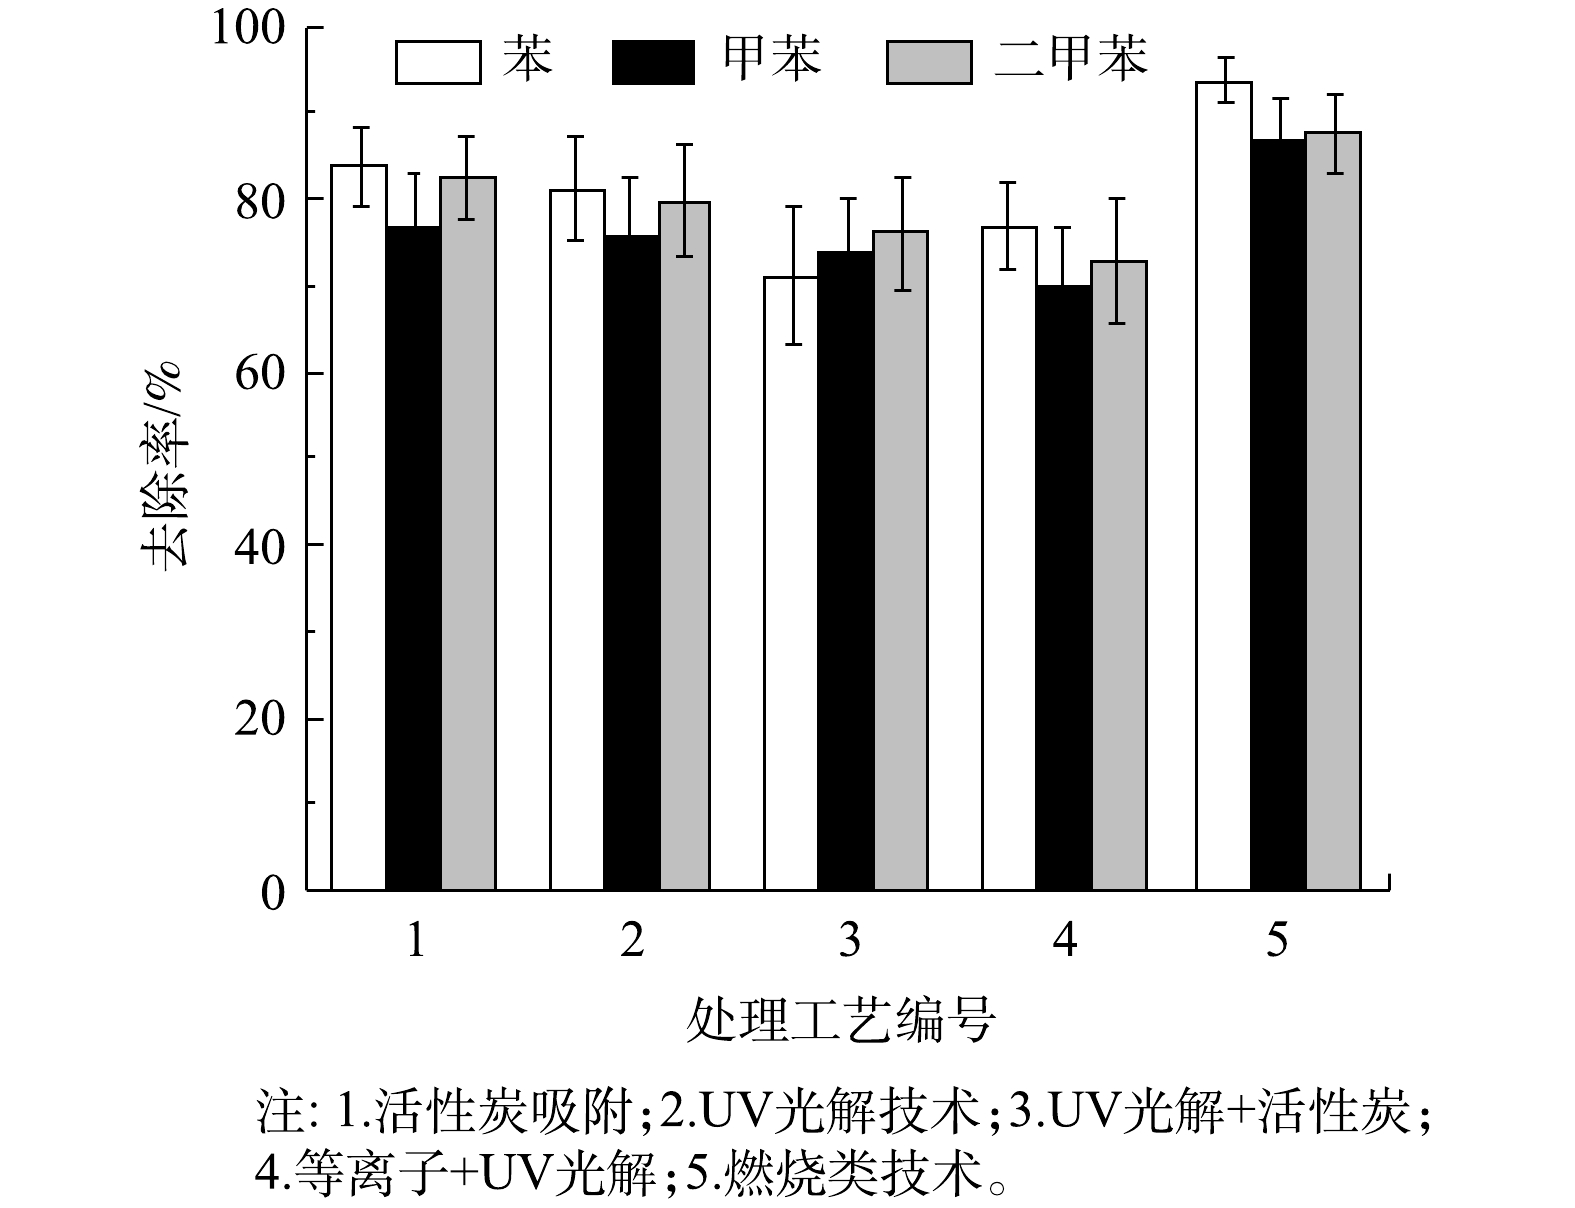
5 种处理工艺的苯系物去除率如图5 所示。5种工艺中,燃烧类工艺对苯系物的去除率最高,对苯、甲苯、二甲苯的平均去除率分别达到93.6%、86.9%、87.6%;其次是活性炭吸附工艺,对苯、甲苯、二甲苯的平均去除率分别为83.8%、76.8%、82.5%;“UV光解+活性炭联用”工艺,因为与活性炭工艺联用,去除率有一定的提升,高于UV光解及“等离子+UV光解”工艺,但整体UV光解及其组合工艺对苯系物去除率较低。
-
1)进口VOCs浓度。各处理工艺在不同进口VOCs 浓度下的去除率如表3所示。由表3可见,进口VOCs浓度对各种治理技术的处理效果有较大影响。各工艺VOCs去除率均随着进口VOCs浓度的升高而增大,且波动范围变小,处理效果更加稳定。经分析,其主要原因为VOCs浓度偏低,影响了吸附反应、化学或光化学反应的速率,在相同反应时间内,VOCs的转化速率下降,从而影响VOCs的去除效率。
2)进口风量。各处理工艺在不同进口风量下的VOCs去除率如表4所示。由表4可见,进口风量对UV光解类工艺影响较大,随着风量的增大,这类工艺的VOCs去除率下降,且波动变大;UV光解类工艺在高风量(>20 000 mg·m−3)条件下对VOCs去除率较低。活性炭吸附和燃烧类工艺受风量影响较小,这2类工艺在高风量(>20 000 mg·m−3)条件下,对VOCs仍保持较高的去除率(高于80%)。
3)设计参数选取。对于不同的 VOCs 治理工艺,要发挥其最佳处理效果,必须选取合适的设计参数。本次调研的企业中,大部分处理效率不佳的VOCs处理设备均存在设计参数选取不当的问题。如采用活性炭吸附和其组合工艺的企业中,有58家企业的设备不符合《厦门市生态环境局关于加强挥发性有机物污染防治的通告》[21-23](后简称“通告”)中的相关规定。根据规定中的要求,采用不具备脱附功能的吸附法治理废气时,每10 000 m3·h−1设计风量的吸附剂装填量应不小于1 m3,否则会出现活性炭填装量不足的现象,从而导致部分设备VOCs去除率偏离正常值。又如采用UV光解及其组合工艺的企业中,有93家企业设备使用的紫外灯管在每10 000 m3·h−1风量下总功率低于8 kW,有7家企业设备每10 000 m3·h−1风量停留时间不足1 s,不符合通告[21-23]中“采用光催化氧化法治理废气时,每10 000 m3·h−1设计风量的紫外灯管总功率不得低于8 kW,废气停留时间不得低于1 s”的相关要求。紫外灯管功率与废气停留时间均不足,导致UV光解类工艺大量设备处理效率低于理论值。
4)工艺联用。本次调研企业采用的组合工艺为“UV光解+活性炭工艺”、“等离子+UV光解工艺”、“活性炭/沸石吸附+催化燃烧工艺”和“沸石吸附+蓄热燃烧工艺”。不同治理工艺的联用,可在反应上相互促进,能在提高处理VOCs去除率的同时节省能耗,如燃烧类工艺(催化燃烧、蓄热燃烧)与活性炭、沸石等吸附工艺联用,将大风量、低浓度的有机废气被浓缩成小风量、高浓度的废气后再进行燃烧处理,大大提升了工艺的VOCs去除率、热量的利用效率和对工况条件的适应性。其中,“活性炭/沸石吸附+催化燃烧”工艺利用燃烧余热对吸附饱和的活性炭进行脱附,不仅促进了热量循环,也在一定程度上克服了由于活性炭性质差异、更换周期过长以及填料不足所带来的负面影响。而本次调查中UV光解相关组合工艺去除率低于UV光解工艺,其可能原因有:①UV光解工艺本身存在设计参数选取和治理设施维护问题,导致部分设备VOCs去除率低于正常值;②与活性炭工艺联用中,部分设备活性炭装填量不足或更换周期过长,导致活性炭吸附效果较差,甚至出现脱附现象;③等离子体工艺中,等离子体产生量少而实际有效反应区的风速过大、停留时间过短,无法有效净化VOCs[24]。
5)治理设施维护。不同VOCs 治理技术要达到稳定的处理效果,都需要做好维护工作,但因缺少专业人员维护和节约成本等原因,本次调研的企业中普遍存在日常管理及维护问题。采用活性炭吸附相关工艺的企业中,有57%的企业活性炭更换周期超过3个月,部分企业更换周期超过12个月,存在活性炭更换不及时的现象。活性炭吸附过程同时也是吸附和解离相平衡的过程,当活性炭吸附饱和时,就会出现脱附大于吸附的现象[25]。这样的设备运行时会因为吸附饱和活性炭的脱附现象导致VOCs的去除率降低,甚至出现处理后VOCs浓度高于处理前的现象。部分采用UV光解类工艺的企业紫外灯管损坏维修不及时,设备无法达到设计功率,故导致VOCs去除率偏低。
-
各企业治理效果的分布情况如图6所示,从处理效果上看,思明区90%以上企业去除率高于80%,50%左右企业去除率高于90%,治理效果最好;其次为湖里区,该区绝大多数企业去除率高于70%,超过70%企业的去除率在80%以上。可见,岛内2个区整体治理效果较好。岛外4个区域中,海沧区去除率在80%~90%与90%~100%区域上的企业最多,处理效果最好,但有部分企业去除率为50%~70%,治理效果差于岛内2区;翔安区80%左右企业去除率在70%~80%,但是中部及北部少数企业处理效率在40%~60%,处理效果一般。集美区与同安区虽有部分企业去除率高于80%,但整体去除率偏低,大量企业去除率分布在50%~70%,同安区中超过40%企业去除率低于70%,在6个区域内治理效果最差。
从出口VOCs浓度来看,除湖里区某企业出口质量浓度高于50 mg·m−3外,岛内各企业VOCs出口质量浓度均低于20 mg·m−3,出口浓度处在较低水平。在岛外区域,海沧区有2家企业出口质量浓度为20~30 mg·m−3,翔安区有3家企业出口质量浓度为20~40 mg·m−3,集美区中有3家企业出口质量浓度为20~40 mg·m−3、2家企业浓度超过50 mg·m−3,部分企业出口浓度偏高。除这部分企业外,上述3区各企业VOCs的出口质量浓度均低于20 mg·m−3。同安区中,有将近40%左右的企业VOCs出口浓度高于20 mg·m−3,中部地区有大量企业VOCs出口质量浓度高于50 mg·m−3,甚至出现了87 mg·m−3的高质量浓度值。该区整体VOCs出口质量浓度处于较高水平。综上所述,对厦门市域各行政区8大VOCs 重点监测行业的企业整体治理效果排序为:思明区>湖里区>海沧区>翔安区>集美区>同安区。
-
1)在使用活性炭工艺处理VOCs 废气时,应确保活性炭填装量符合通告规定的标准,并在活性炭达到吸附饱和时及时进行更换。
2)在应用UV光解及其组合工艺时,应确保紫外灯管总功率和废气停留时间符合通告中的相应技术规范。当处理苯系物含量较高的VOCs废气时,建议用活性炭吸附工艺进行替代或联用,以确保对苯系物的高效去除。光催化工艺中的催化剂优先考虑蜂窝陶瓷负载的光催化剂。
3)在应用燃烧类工艺处理低浓度废气时,应优先考虑通过吸附方式进行浓缩后再燃烧。直接燃烧能耗相对较高,但净化更为彻底。蓄热燃烧可降低能源消耗。“活性炭/沸石+催化燃烧”工艺可在一定程度上避免因活性炭所导致的问题,对工况适应性较强,但当废气中含有硫、硅和卤素等易使催化剂中毒的物质时,应优先考虑直接燃烧、蓄热燃烧等燃烧类工艺。
4)生物法、冷凝回收法、低温等离子等3种工艺的处理效率较低,但也具有低成本的优点,可视具体情况应用于低VOCs排放企业。
5)由于同安区、集美区、翔安区中印刷、化工等高VOCs产生量企业较多,整体治理效果较差,因此在今后应加强这3个区域的治理,且不建议同安区、翔安区、集美区、海沧区等高VOCs产生量(>1 000 kg·d−1)与高进口风量(>20 000 m3·h−1)的企业使用UV光解及其组合工艺,建议以燃烧类工艺进行替代。
2.1. VOCs排放企业分析
2.2. 各类VOCs废气治理工艺的应用情况
2.3. 不同治理技术的处理效果及影响因素
2.3.1. 对VOCs的去除率
2.3.2. 对苯系物的去除效果
2.3.3. 对VOCs处理效果的影响因素
2.4. 区域治理效果评估
2.5. VOCs废气治理技术的应用建议
-
1)本次调查的6类治理工艺中,燃烧类工艺对VOCs处理效果最好,平均去除率为82.1%;活性炭吸附类工艺在工艺品、印刷、汽修行业的治理效果较好,但在橡胶行业治理效果较差;UV光解类工艺VOCs处理效果最差,但这类治理工艺在汽修行业具有较好的治理效果。
2)燃烧类工艺对苯系物去除率最高,对苯、甲苯、二甲苯的平均去除率分别为93.6%、86.9%、87.6%,其次是活性炭吸附工艺,UV光解及其组合工艺对苯系物去除率较低。
3) UV光解及其组合工艺、活性炭吸附工艺在设计参数选取和治理设施维护中存在问题,导致UV光解及其组合工艺的整体去除效果较差。活性炭吸附工艺部分设备去除率低于正常值。在今后的废气治理中,应充分考虑各类影响因素,选择合适的处理技术,并应做好设备日常维护。
4)对厦门市VOCs 8大行业所进行的区域治理效果评估表明,厦门市各区的VOCs治理效果的排序为,思明区>湖里区>海沧区>翔安区>集美区>同安区。


 下载:
下载:
